
Related Manuals for Druck DPI 610E


Summary of Contents for Druck DPI 610E
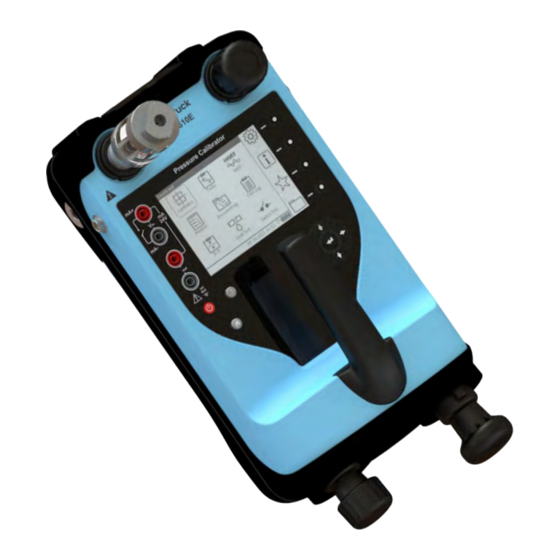
- Page 1 DPI 610E DPI 610E-IS Portable Pressure Calibrator Instruction Manual DPI 610E-PC DPI 610E-SPC DPI 610E-HC DPI 610E-SHC Druck.com...
-
Page 2: Table Of Contents
1.15.8 Volume Adjuster (Pneumatic Version) 1.15.9 Volume Adjuster Wheel (Hydraulic Version) 1.15.10 Pressure/ Vacuum Selector (Pneumatic Version) 1.15.11 Auxiliary Ports 1.15.12 External Sensor Port 1.15.13 Barometric Port (Pneumatic Version only) Copyright 2022 Baker Hughes Company. English–DPI 610E Instruction Manual | 3... - Page 3 Relief Valve Test Tasks Selection Adding Tasks to the Dashboard Removing Tasks from the Dashboard General Settings DATE, TIME and LANGUAGE BACKLIGHT AUTO POWER DOWN TOUCHSCREEN LOCK ENABLE HOLD ADVANCED Copyright 2022 Baker Hughes Company. 4 | DPI 610E Instruction Manual–English...
- Page 4 8.1.1 Overview 8.1.2 Media Compatibility 8.1.3 Setup 8.1.4 The Zero Function 8.1.5 Available External Pressure Sensors 8.1.6 Configuration of an External Pressure Sensor RTD Probe and Interface 8.2.1 Overview Copyright 2022 Baker Hughes Company. English–DPI 610E Instruction Manual | 5...
- Page 5 Setting up Periodic Data Logging Viewing & Deleting Data Log files 9.6.1 Viewing Data Log Files 9.6.2 How to use a PC to view Data Log files in the DPI 610E 9.6.3 Deleting Data Log Files How to transfer a Data Log file Analysis 10.1 Overview...
- Page 6 14.1.1 The Files system screen options 14.2 Calibration 14.3 Data Log 14.4 Procedures 14.5 Leak Test 14.6 Switch Test 14.7 Relief Valve 14.8 How to view the File System on a PC Copyright 2022 Baker Hughes Company. English–DPI 610E Instruction Manual | 7...
- Page 7 15.8.1 How to export and view Exported Error Log files 15.9 EVENT LOG 15.9.1 How to export and view Exported Event Log files General Specification 16.1 Open Source Software Licenses Manufacturer 17.1 Contact details Copyright 2022 Baker Hughes Company. 8 | DPI 610E Instruction Manual–English...
-
Page 8: Overview
It has a smart and simple user interface allowing it to be operated by any technician, service or maintenance engineer. The DPI 610E series combines a practical and robust design with reliable and accurate measurements. It is battery-powered and features highly reliable pneumatic and hydraulic assemblies for continuous and reliable performance for field calibration, even in harsh environmental conditions. - Page 9 Type: Hydraulic - Intrinsically Safe Pressure Range: 70 - 1000 bar, Pressure Range: 70 - 1000 bar, 1000 - 15000 psi, 7 - 1000 MPa 1000 - 15000 psi, 7 - 1000 MPa Copyright 2022 Baker Hughes Company. 10 | DPI 610E Instruction Manual–English...
-
Page 10: Equipment In The Box
Equipment in the Box 1.2 Equipment in the Box The following items are supplied with the instruments in the DPI 610E series. When unpacking the instrument, make sure that there are no missing items. Note: When the hydraulic instrument is delivered there is a protective cap in the reservoir socket. -
Page 11: Accessories
Chapter 1. Overview 1.4 Accessories Table 1-2 shows common accessories for the DPI 610E series. See Datasheet (BHCS39207) for a full list of accessories. Table 1-2: Common accessories Part Code Description RTD-INTERFACE-485 RTD Interface only (IS area) RTD-INTERFACE-IS RTD IS Interface (non-IS area) -
Page 12: General Safety Precautions
Do not use tools on the instrument that might cause incendive sparks - this can cause an explosion. It is dangerous to ignore the specified limits (refer to data sheet) for the DPI 610E series or to use the instrument when it is not in its normal condition. Use the applicable protection and obey all safety precautions. -
Page 13: Pressure Warnings
CAT I equipment cannot be CAT I directly connected to the mains power. E.g a process loop powered device. This is for single phase electrical CAT II installation. E.g appliances and portable tools. Copyright 2022 Baker Hughes Company. 14 | DPI 610E Instruction Manual–English... -
Page 14: Maintenance
1.7 Maintenance Maintain the instrument using the procedures outlined in this User Manual and for information relating to maintenance issues please contact: www.bakerhughesds.com/druck/global-service-support Table 1-4 summarizes manufacturer recommended maintenance tasks for the DPI 610E series. Table 1-4: Maintenance Tasks Task Period... -
Page 15: Spares
1.10 Instrument Return 1.10.1 Returned Goods Procedure If the unit requires calibration or is unserviceable, please return it to the nearest Druck Service Centre listed at: https://www.bakerhughes.com/druck Contact the Service Centre to obtain a Return Goods Authorization (RGA). If you are in the USA, obtain a Return Material Authorization (RMA). -
Page 16: Preparing The Instrument
The instrument can be charged while switched on and also when powered off. Battery charge time is approximately two hours from empty to fully charged. Socket Figure 1-1: Battery Charging Socket Copyright 2022 Baker Hughes Company. English–DPI 610E Instruction Manual | 17... -
Page 17: Battery Status Indicator
The instrument has an Auto Power Down feature that can be enabled/deactivated as required. See General Settings Section 4 on page 43: (on the instrument it can be found under the General Settings screen on the Dashboard). Copyright 2022 Baker Hughes Company. 18 | DPI 610E Instruction Manual–English... -
Page 18: Parts
Screen Selection softkeys Clip Fastener for Carrying Strap Power ON/OFF button Barometer Port Help Button Battery Level Indicator (One bar equals 25% charge) Home Button External Sensor Port Navigation Pad Copyright 2022 Baker Hughes Company. English–DPI 610E Instruction Manual | 19... - Page 19 Clip Fastener for Carrying Strap Screen Selection softkeys Pressure Release Valve Power ON/OFF button Battery Level Indicator (One bar equals 25% charge) Help button External Sensor Port Home button Copyright 2022 Baker Hughes Company. 20 | DPI 610E Instruction Manual–English...
-
Page 20: Test Port
1.15.5 Handle and Shoulder Strap The DPI 610E has a carry handle to allow for a steady grip on the instrument, while the shoulder strap can be used for more comfortable use. 1.15.6 Pump (Pneumatic Version) When the pump selector is in the (+) orientation the hand pump generates pressure by a forward- backward stroke action. -
Page 21: Barometric Port (Pneumatic Version Only)
Canada ISED Radio Approval ID (Bluetooth) US FCC Radio Approval ID (Bluetooth) China RoHS WEEE (Recycling) Marking. Do not dispose of as normal refuse - take to an authorized disposal facility. Copyright 2022 Baker Hughes Company. 22 | DPI 610E Instruction Manual–English... -
Page 22: User Interface
Navigation Pad. 1.17.1.5 Navigation Pad The Navigation Pad consists of Up, Down, Left, Right and Enter buttons which allow quick and easy navigation when using the user interface. Copyright 2022 Baker Hughes Company. English–DPI 610E Instruction Manual | 23... -
Page 23: First Use
This can make the system execute unintended actions. This can happen, for example, when pushing cables into the sockets in the face of the instrument or by letting cables touch the screen. Copyright 2022 Baker Hughes Company. 24 | DPI 610E Instruction Manual–English... -
Page 24: Dashboard Navigation
When all parameters have been selected press the Tick softkey to accept the Date/Time changes or press the Back button to exit without saving the changes. Copyright 2022 Baker Hughes Company. English–DPI 610E Instruction Manual | 25... - Page 25 1.19.3.3 Open Source Licenses There are two files that relate to the software for upgrading the firmware for this instrument: 1568-notices-report-08_08_2022_17_04.txt covers DK0491 DPI610E Bootloader 1563-notices-report-08_08_2022_16_01.txt covers DK0492 DPI610E Main Application. Copyright 2022 Baker Hughes Company. 26 | DPI 610E Instruction Manual–English...
-
Page 26: Pump Operations
2.1.2 Flexible hose A flexible hose is delivered with the DPI 610E, to enable connection to other equipment. Two types of hose are available: one for Safe area use and the other for Intrinsically Safe (IS) environments. -
Page 27: Attach Instrument Dirt (And Water) Trap To Test Port
Note: Make sure that the device under test has a male G ⅜ Quickfit adapter thread or use a suitable adapter rated to 35 bar. If in doubt, please contact www.bakerhughesds.com/druck/global- service-support Copyright 2022 Baker Hughes Company. 28 | DPI 610E Instruction Manual–English... - Page 28 Attach the Blanking Plug to seal and protect the socket if the instrument will not be in immediate use, see “Use of Blanking Plug” on page 27. Step 2 Copyright 2022 Baker Hughes Company. English–DPI 610E Instruction Manual | 29...
-
Page 29: Preparing The Instrument For Pressure/Vacuum Operation
Make sure the instrument is safe to use: refer to the instructions on page 27. Power ON the instrument by holding down the power button for Step 1 2 seconds until the Druck splash screen appears. Select the required pressure function from the Channel Function screen. -
Page 30: Generating Pressure/Vacuum
Use the pump to achieve the desired pressure/vacuum. Step 3 Turn the volume adjuster to make fine adjustments to the pressure/vacuum. Step 4 Copyright 2022 Baker Hughes Company. English–DPI 610E Instruction Manual | 31... - Page 31 Make sure that the device under test is properly connected to the test port and that the DPI 610E relief valve is fully open (turn counter-clockwise). Make sure the pressure-vacuum selector is set to the ‘+’ position for the pressure mode.
- Page 32 If -950 mbar is achieved but then the pressure slowly increases (i.e. system appears to be leaking) then check that the relief valve is tightly shut and the IDT (Instrument Dirt Trap) top/bottom seals are not leaking. Copyright 2022 Baker Hughes Company. English–DPI 610E Instruction Manual | 33...
-
Page 33: Hydraulic System
The reservoir can be unscrewed from the instrument and filled. To avoid contamination, use only one type of pressure media in the instrument. If you wish to change the pressure medium after first use, please contact the Service Department. Copyright 2022 Baker Hughes Company. 34 | DPI 610E Instruction Manual–English... -
Page 34: Priming The Instrument
Go to step 16 for more information. Step 2 Turn the volume adjuster wheel clockwise until it stops: this can be up to 30 turns. Note: This is the zero point. Copyright 2022 Baker Hughes Company. English–DPI 610E Instruction Manual | 35... - Page 35 See Section 2.2.1 on page 34. Step 5 Power ON the instrument by holding down the power button for 2 seconds until the Druck splash screen appears. Step 6 Select the required pressure function from the Channel Function screen.
- Page 36 If pressure is observed, turn the pressure release knob fully counter-clockwise until the pressure display reads zero (gauge sensor) or atmospheric pressure (absolute sensor). Step 13 Remove the blanking plug from the test port. Copyright 2022 Baker Hughes Company. English–DPI 610E Instruction Manual | 37...
- Page 37 Note: As required, use adapters provided with the instrument or an AMC adapter(s) and the corresponding seal(s). Step 17 Use the priming pump to prime the system to a maximum of 10-20 bar. Copyright 2022 Baker Hughes Company. 38 | DPI 610E Instruction Manual–English...
-
Page 38: Generating Pressure
1m length is used to connect to the device under test. Note: Using long (or wide-bore) hoses may prevent the required pressure from being reached within the limits of the screw pump mechanism. Copyright 2022 Baker Hughes Company. English–DPI 610E Instruction Manual | 39... -
Page 39: Basic Tasks
This task is typically for calibrating Current Output Pressure transmitters. 3.1.2 P-P (Pressure to Pressure) This configures CH1 to internal (INT) pressure measurement and CH2 to external (EXT) pressure measurement. Copyright 2022 Baker Hughes Company. 40 | DPI 610E Instruction Manual–English... -
Page 40: P-V (Pressure To Voltage)
Relief Valve Test utility. If external pressure is detected on CH1, it will retain this function otherwise, it defaults to internal pressure. CH2 configuration remains unchanged. For more details on the Relief Valve Test, refer to Section 7.4 on page 140. Copyright 2022 Baker Hughes Company. English–DPI 610E Instruction Manual | 41... -
Page 41: Tasks Selection
UP/DOWN/LEFT/RIGHT buttons to select the desired task and press the (HOMEx) softkey to remove the selected option. Once removed, the mini HOME icon next to the option text will disappear. Copyright 2022 Baker Hughes Company. 42 | DPI 610E Instruction Manual–English... -
Page 42: General Settings
General Settings DATE, TIME and LANGUAGE 4. General Settings The following General Settings are available on the DPI 610E: Setting Description DATE/TIME Set the date/time. LANGUAGE Set the language. BACKLIGHT Turn the back light on/off. Select the USB communication mode. -
Page 43: Backlight
Chapter 4. General Settings 4.2 BACKLIGHT This feature controls the instrument backlight. By default, the DPI 610E is configured to Timed (5 Minutes). To change this setting: Select Backlight from the General Settings menu. Select the required mode (described below). -
Page 44: Usb
If TIMED (5 MINUTES) is selected, the backlight will remain on and automatically switch off after a period of 5 minutes of inactivity. 4.3 USB The following USB settings are available on the DPI 610E: Setting Description Mass Storage Storage mode facilitating the transfer of files/folders between the instrument and a PC. -
Page 45: Auto Power Down
Step 2 4.4 AUTO POWER DOWN This feature controls the auto power down behavior of the instrument. By default, the DPI 610E is configured to remain on until powered down by the user. To change this setting: Select Auto Power Down. - Page 46 AUTO POWER DOWN If 10 Minutes Inactivity is selected, the instrument will automatically switch off after 10 minutes of inactivity. Note: Auto Power Down will not come into effect until all tests running have been completed. If 30 Minutes Inactivity is selected, the instrument will automatically switch off after 30 minutes of inactivity.
-
Page 47: Touchscreen Lock
4.5 TOUCHSCREEN LOCK This feature allows the user to lock the touchscreen and navigate using the navigation keypad and softkeys only. By default, the DPI 610E is configured with Touchscreen Lock disabled. To change this setting: Check TOUCHSCREEN LOCK box is unchecked (it has no Tick mark). -
Page 48: Enable Hold
ENABLE HOLD 4.6 ENABLE HOLD This feature allows the user to enable/disable the icon (Hold) on the main reading screen. By default the DPI 610E is configured with Enable Hold enabled. To change this setting: Uncheck ENABLE HOLD. Step 1 Select OK. -
Page 49: Advanced
Chapter 4. General Settings 4.7 ADVANCED This feature provides access to the Advanced Menu, which has the following options: Option Description CALIBRATION* Calibration options. CHANGE PIN Change the Advanced menu PIN. SOFTWARE UPGRADE Upgrade system software. FACTORY RESET Set the instrument back to default settings FORMAT FILE SYSTEM Erases all content on mass storage and creates factory default folders... - Page 50 ADVANCED The Advanced Menu screen is now unlocked and its options available (see “Advanced Menu” on page 52) Step 3 Copyright 2022 Baker Hughes Company. English–DPI610E Instruction Manual| 51...
-
Page 51: Advanced Menu
Note: To access the Advanced menu, select ADVANCED from the General Settings menu (see Chapter 4.7, “ADVANCED,” on page 50). * A separate chapter describes the Instrument Calibration options. (See Chapter 13 on page 227). Copyright 2022 Baker Hughes Company. 52 | DPI 610E Instruction Manual–English... -
Page 52: Calibration Menu
Advanced Menu screen as shown below: Select CALIBRATION from the Advanced Menu. Step 1 Refer to Chapter 13, “Instrument Calibration” on page 227, for how to use the CALIBRATION menu and its options. Copyright 2022 Baker Hughes Company. English–DPI 610E Instruction Manual | 53... -
Page 53: Change Pin
To change the PIN to a new number, use the onscreen keypad to enter the new number. Select . Enter the new PIN again and select to confirm the selection. Step 2 Copyright 2022 Baker Hughes Company. 54 | DPI 610E Instruction Manual–English... -
Page 54: Software Upgrade
Download the “DK0492.raw” application image from https://inspectionworks.com/druck-portal/#/store/public on to the PC that is to Step 1 connect to the DPI 610E. Make sure the file name is not renamed. Select the Settings icon on the Dashboard. Press the Home button necessary, to show the Dashboard. - Page 55 Note: You may have to request for USB exception via Service Catalog: http://servicecatalog.ent.bhicorp.com/usm/wpf?Node=icguinode.catalogitemdetails&Args= 11846&ObjectID=11846&NspPath=&searchIn=&searchInstr=Entire%20Catalog The PC should automatically detect the DPI 610E which should appear as a Mass Storage drive (default name is DPI610E). Step 5 Copy the DK0492.raw file from the PC file system location and paste it into the root directory of the DPI 610E mass storage drive.
-
Page 56: How To Upgrade The Firmware
SOFTWARE UPGRADE When the successful transfer of the DK0492.raw file from the PC to the memory of the DPI 610E is Step 7 confirmed, remove the USB cable from the DPI 610E. The next heading describes the procedure for how to upgrade the software firmware. - Page 57 Chapter 5. Advanced Menu The DPI 610E starts again and shows the Dashboard screen. Press the Information (Status) icon then select SOFTWARE BUILD on the Status screen that appears. Step 3 The versions of the DK0491 Boot-loader and DK0492 Application software will be shown.
-
Page 58: Factory Reset
Select FACTORY RESET from the Advanced Menu screen. Step 1 Select OK button to confirm selection of Factory Reset. Step 2 Select OK button to confirm deletion of all user files. Step 3 Copyright 2022 Baker Hughes Company. English–DPI 610E Instruction Manual | 59... - Page 59 Select OK button to confirm restart of instrument. Step 4 If Cancel is selected in Step 4, reset will be completed on next boot. Select OK button to confirm selection. Option Copyright 2022 Baker Hughes Company. 60 | DPI 610E Instruction Manual–English...
-
Page 60: Format File System
“Formatting will be completed on next reboot”. Click OK to close this message window. Step 3 After the instrument is restarted, copy any backup files back into their respective folders. Copyright 2022 Baker Hughes Company. English–DPI 610E Instruction Manual | 61... -
Page 61: Service / Engineering
Chapter 5. Advanced Menu 5.6 SERVICE / ENGINEERING This Advanced SERVICE/ENGINEERING function is not for operator use and requires a PIN for use only by specialist users. Copyright 2022 Baker Hughes Company. 62 | DPI 610E Instruction Manual–English... -
Page 62: Calibrator Tasks
Calibrator Task Screen Calibrator Tasks 6. Calibrator Tasks 6.1 Calibrator Task Screen Figure 6-1: Calibrator Task Screen Function Name – name of the currently selected function on the channel. Primary reading – measured values that directly represent the channel function description and displayed in large digits within the channel windows. -
Page 63: Calibrator Tasks Screen Shortcuts
Chapter 6. Calibrator Tasks 6.1.1 Calibrator Tasks Screen Shortcuts 6.1.1.1 Maximize and Minimize Channel Window Using the Touchscreen When in the default 50:50 channel window layout, tap on any blank area on the desired channel window (except the Units area) to maximize the window area. - Page 64 Calibrator Task Screen Using Navigation Buttons When in the default 50:50 channel window layout, press the UP button to select the Channel 1 (CH1) window area. Step 1 INFORMATION Press the DOWN button to select the Channel 2 (CH2) window area. Press the Enter button to maximize the Channel window.
- Page 65 Chapter 6. Calibrator Tasks 6.1.1.2 Change Measurement Units To change the measurement units on each channel on the calibrator task screen: Select the units text on the relevant channel window. Step 1 Select the desired unit from the CH Units screen. Select to confirm the selection.
- Page 66 6.1.1.3 10 V/24 V Loop Power Enable/Disable The Loop Drive is the internal power supplied by the DPI 610E. It is available to use with any of the electrical functions listed in the CH2 Setup screen (to enable the Loop Power, see Section 6.2.9 on page 88).
- Page 67 Chapter 6. Calibrator Tasks The Loop Power function can be disabled quickly without leaving the Calibrator screen: Using the Touchscreen Tap on the 10 V/ 24 V text field in the Calibrator screen. Step 1 Check that the 10 V/ 24 V function has been disabled: as shown by the removal of the voltage text field (e.g.
- Page 68 Calibrator Task Screen Press the RIGHT button until the 10V/24V text area is highlighted. Step 2 Press the Enter Key to cancel the 24V ON function. Step 3 Check that the 10 V/24 V function is not in the display because it has been disabled.
-
Page 69: Error Indications
Chapter 6. Calibrator Tasks 6.1.2 Error Indications An out-of-range error message occurs when the values of the primary reading measure are more than the full-scale value of the function range. Table 6-1: Error Indicators Condition Description Depiction Under-range Measured reading<110% of the negative full-scale value. -
Page 70: Functions
Functions 6.2 Functions 6.2.1 Functions available by channel Figure 6-3: Channel 1 Functions Figure 6-4: Channel 2 Functions Copyright 2022 Baker Hughes Company. English–DPI610E Instruction Manual| 71... - Page 71 Chapter 6. Calibrator Tasks Figure 6-5 is a channel function combination matrix. It shows the combinations of channel selections that are supported in the DPI 610E product range. Figure 6-5: Channel Function Combination Matrix Channel 2 None Electrical Pressure Barometer Observed RTD HART...
-
Page 72: None
Pneumatic units contain internal pressure sensors which range from 350 mbarg to 35barg. Hydraulic units contain internal pressure sensors which range from 70 bara/g to 1000bara. Available internal pressure sensors are listed in Table 6-2. Table 6-2: Internal Pressure Sensors in DPI 610E Range Pressure Pressure Range Code... - Page 73 Chapter 6. Calibrator Tasks To configure a pressure measurement reading from an internal sensor Select the desired channel (Channel 1 in this example). Step 1 Select FUNCTION in the Channel Setup screen. Step 2 Select Pressure in the Channel Function screen. Select INT.
- Page 74 External pressure sensors (PM700E) are available in the range 25 mbarg/d to 1400 bara. Refer to “External Sensors” on page 142 for a list of available sensors, and information about how to configure the DPI 610E to recognize and use external sensors and RTD probes. 6.2.3.3 The Zero Function The zero function is used on gauge sensors to remove offset drifts and therefore maintain the highest accuracy.
- Page 75 Make sure that the sensor is open to Chapter 2.2.4 on page 39 for hydraulic units. atmosphere. Example: For the DPI 610E internal sensor, open the pressure release knob fully or make sure that the test port is open to atmosphere.
- Page 76 Functions Select OK to confirm. Step 5 Check that the desired pressure channel has been zeroed. Note: A Zero Error can occur if the pressure reading, measured from the sensor, is outside 1% of the full scale value when the instrument pressure port is opened to atmosphere.
- Page 77 Chapter 6. Calibrator Tasks How to configure an External Sensor as a Sealed Gauge The EXT Pressure function must be configured in one of the channels and you need to go into Calibrator to trigger this popup message. Switch on the instrument and select the Calibrator icon and when the popup window appears select YES.
- Page 78 Functions Internal Sensor INFORMATION The INT Pressure function must be configured in one of the channels and you need to go into Calibrator to trigger this popup message. Select YES. Step 1 INFORMATION If NO is selected the sensor will be used in its native form - an Absolute pressure sensor.
-
Page 79: Sum
Chapter 6. Calibrator Tasks 6.2.4 Sum Sum is a pressure related function which allows the internal pressure reading from the instrument to be combined with the pressure reading from an external sensor. An external pressure sensor must be connected to see the resulting reading on the Calibrator Main screen. The SUM function is only available on CH1. - Page 80 Functions Select Sum from the channel FUNCTION menu. Select to confirm. The CH Setup screen will appear again. Step 3 Check that the desired configuration appears in the CH Setup menu. Select to go back to the Calibrator Main screen. Step 4 Copyright 2022 Baker Hughes Company.
-
Page 81: Difference
Chapter 6. Calibrator Tasks 6.2.5 Difference Difference is a pressure related function: this allows the difference between the internal pressure sensor reading and the external pressure sensor reading to be displayed on the calibrator task screen. An external pressure sensor must be connected to see the resulting pressure reading. Note: Care should be taken when both sensors are not the same type (absolute/gauge) to ensure that the contribution from atmospheric pressure has been considered. - Page 82 Functions Check that the desired configuration appears in the CH Setup menu. Select to return to the Calibrator Main screen. Step 4 Confirm that the Difference function is correctly configured on the desired channel. The Difference icon (DIFF) together with the function name will be Pressure (INT-EXT) or (EXT-INT) depending on Step 5 the priority chosen.
-
Page 83: Barometer
Chapter 6. Calibrator Tasks 6.2.6 Barometer The internal Barometer has a range of 750 to 1150 mbar. The Barometer function allows the measured atmospheric pressure to be displayed on the Calibrator Main reading screen as a primary reading. The internal barometer is only available in the pneumatic variant. To configure a pressure measurement reading using the Barometer function: Select the icon as desired. - Page 84 Functions Confirm that the INT Barometer function appears in the CH Setup menu. Select the Back icon to go to the Calibrator Main Screen. Step 4 Check that the Barometer function is correctly configured in the desired channel window. Step 5 Copyright 2022 Baker Hughes Company.
-
Page 85: Observed
Chapter 6. Calibrator Tasks 6.2.7 Observed The Observed function is a non-measured function and has a range of +/- 999999.9. It allows manual entry of an observed reading from an external measuring and indicating device. It is often used in conjunction with a second measured function on another channel to record the relationship between the two readings. -
Page 86: Rtd
The RTD function enables temperature or resistance measurements to be displayed on the Calibrator main reading screen as a primary reading when the RTD-Probe is connected to the DPI 610E via the RTD-Interface (or RTD-Interface-IS). When the RTD-Interface connection is detected, the sensor icon is shown in the status bar and the “Connected”... -
Page 87: Current
When using the CH2 Current function, there is the additional option to use the internal 10 V (non-IS instruments only) or 24 V power supply provided by DPI 610E or to use an external power supply for the device under test. - Page 88 Functions Select the channel. Step 2 Select FUNCTION from the CH2 Setup screen. Step 3 Select Current > Measure > then select one of the following: 10 V for measure with internal 10 V Loop Power supply (only for non-IS units) OR 24 V for measure with internal 24 V Loop Power supply.
- Page 89 Chapter 6. Calibrator Tasks This screen will have only “Current” as the Function when Off is selected. When 24V is selected, “Current (24V)” will appear. When 10V is selected, “Current (10V)” will appear. Select the Back icon to go to the Calibrator Main Screen.
- Page 90 Functions 6.2.9.2 Current Source To configure the Current Source function: Use the diagram on the left to make the necessary connections for Current Source when the 10/24V internal power supply is not used (when the Off option is selected in Step 4). Step 1 Use the diagram on the left to make the necessary connections for Current...
- Page 91 Chapter 6. Calibrator Tasks Select FUNCTION from the Channel Setup menu. Step 3 Select Current > Source > then select one of the following: 10 V for measure with internal 10 V Loop Power supply (only for non-IS units) OR 24 V for measure with internal 24 V Loop Power supply.
- Page 92 Functions Direct Input of Current Value The DPI 610E can provide electrical current accurately within the 0 to 24 mA range. The diagram on the left shows the terminal connections for this configuration. You can directly input the current value to be sourced. First select the type of test to be done (See Section 3.2 on page 42).
- Page 93 Chapter 6. Calibrator Tasks INFORMATION Once a target current source value is set, the displayed value will start to flash. Once the setpoint has been reached, the source value will stop flashing and remain steady. The other methods to set the current source output are: Nudge (manual) Span Check (manual or automated) Percent Step (manual or automated)
- Page 94 Functions Select the desired option from the Source Automation screen, for example: NUDGE. Step 3 If required, select the Edit softkey to configure the selected automation. Note: Different automation options will have different configuration parameters. Step 4 Copyright 2022 Baker Hughes Company. English–DPI610E Instruction Manual| 95...
- Page 95 Chapter 6. Calibrator Tasks NUDGE This is the default Source Automation option. It allows the source value to be incremented or decremented by a defined step size value. This can be achieved in the current source channel window by: To use the screen. From the Source Automation screen select the NUDGE radio button and then the Edit...
- Page 96 Functions SPAN CHECK Span Check is normally used to check the span of a device under test by providing the minimum current output corresponding to the device's zero or negative full-scale, and the maximum current output corresponding to the positive full-scale of the device under test. For most current output devices, this minimum and maximum values are 4 and 20 mA respectively.
- Page 97 Chapter 6. Calibrator Tasks The Calibrator screen will have two additional icons indicating that the Span Check mode is active and the Auto-repeat operation is available. Step 3 LOW value - is the first current source value to be set using this option. HIGH value - is the maximum current source value set-point using this option.
- Page 98 Functions PERCENT STEP The PERCENT STEP function allows the source value to be incremented in steps that correspond to a set percentage of the span. The Low, High and Step size value can be set as well as the option to auto-repeat this automation process. From the Source Automation screen tap the PERCENT STEP radio button to show the Percent Step Automation...
- Page 99 Chapter 6. Calibrator Tasks STEP SIZE value - is the magnitude of each step increment or decrement. When using this option, it is expressed as a percentage. The resulting mA step size will be based on the step size percentage of the LOW and HIGH value. DWELL - time interval which can be set to wait at each set-point value before changing to the next value.
- Page 100 Functions Tap or select the parameter value to be changed. Select the parameter row to show an onscreen keypad, enter the new value using the onscreen or Navigator keys. Tap the Back icon to enter the Step 2 value and return to the Calibrator screen.
- Page 101 Chapter 6. Calibrator Tasks RAMP The RAMP function allows the source value to be automatically incremented from a defined START value to a defined END value in steps of a defined value in both increasing and decreasing direction. The TRAVEL time can be set to define the period of time it takes the value to go from START to END (and vice versa).
- Page 102 Functions TRAVEL - time required for the current source value to ramp from the Start value to the End value. This automatically calculates the required step size to be used to achieve the travel time. DWELL - time interval which can be set to pause or wait at the end of each direction or travel before changing to the opposite direction of travel.
-
Page 103: Voltage
Chapter 6. Calibrator Tasks 6.2.10 Voltage For the DPI 610E instrument voltage is measured in Volts (V) or milliVolts (mV) and is a function of CH2 only. When the Voltage function is selected, the Direction is automatically set to Measure, as the Source option is not supported by the DPI 610E. - Page 104 Functions Select Voltage > Measure then select one of the following: Off for measurement without internal loop power supply OR 10 V for measure with internal 10 V loop power supply (only for non-IS units) OR 24 V for measure with internal 24 V loop power supply.
-
Page 105: Millivolts Measure - Configuration
When using the Millivolts function, there is the additional option to use the internal 10 V (non-IS units only) or 24 V power supply provided by DPI 610E or to measure the millivolts input from a source that is powered external to the unit. - Page 106 Functions Select Millivolts > Measure then select one of the following: Off for measurement without internal loop power supply OR 10 V for measure with internal 10 V loop power supply (only for non-IS units) OR 24 V for measure with internal 24 V loop power supply.
-
Page 107: Hart
HART bi-directional communications technology works as a master/slave protocol and when connecting the DPI 610E to the HART device, the DPI 610E acts as the master and the HART device, the slave. The DPI 610E supports commonly used functions from the Universal and Common Practice commands specified in HART revision 5, 6 and 7. - Page 108 Functions Select None in the FUNCTION column and tap the page down softkey to view the second page of CH2 functions. Tap HART on the second screen to view the two more selection columns. Select the required options in the columns and then select the Tick icon to confirm the selection and configure the instrument.
-
Page 109: Process Options
Chapter 6. Calibrator Tasks 6.3 Process Options 6.3.1 Tare The Tare function is used to set the channel readings to a temporary zero. When Tare is enabled, the primary reading value is deducted from subsequent reading values until Tare is disabled. The initial reading will be approximately zero. - Page 110 Process Options Select the TARE Checkbox. Tap on the Checkbox or use the Navigation Pad buttons to move to the TARE row and press the Pad’s Enter button. Select the Back icon to go back to the Channel Setup screen. Step 3 Check that the TARE icon is in the...
-
Page 111: Min/Max/Mean
Chapter 6. Calibrator Tasks 6.3.2 Min/Max/Mean The Min/Max/Mean function provides the minimum, maximum and average of the primary reading from the time it is enabled. It is continuously updated as the reading values change and is displayed in addition to the live primary reading. When enabled, the Min/Max/Mean status icon is displayed. - Page 112 Process Options Select the MIN/MAX/MEAN Checkbox and then select the Back icon. Step 3 Check that Min/Max/Mean is enabled in the Channel Setup screen. (The Min/Max/Mean icon will be displayed as the PROCESS option). Select the Back icon. Step 4 Check that the Min/Max/Mean icon appears on the relevant channel...
- Page 113 Chapter 6. Calibrator Tasks Min/Max/Mean information appears in the maximized channel window. Step 6 Copyright 2021 Baker Hughes Company. 114 | DPI610E Instruction Manual–English...
-
Page 114: Filter
Process Options 6.3.3 Filter The Filter function allows a low pass band filter to be applied to the channel readings. It is used to obtain a more stable measurement reading over a noisy signal. INFORMATION The Filter function can be applied on all functions except HART. - Page 115 Chapter 6. Calibrator Tasks Tap the FILTER Checkbox (put a tick mark in it) and then select the Back icon. Step 3 The FILTER icon should appear in the PROCESS row, to show that FILTER is enabled in the Channel Setup menu (as the PROCESS Option.) Select the Back icon to go back to the...
-
Page 116: Flow
Process Options 6.3.4 Flow The Flow function enables the square root of the measured pressure value to be displayed as the primary reading. INFORMATION The Flow process option is only supported by pressure functions i.e. Internal Pressure, External Pressure, Sum and Difference. When enabled the Flow status icon appears. - Page 117 Chapter 6. Calibrator Tasks Tap the FLOW Checkbox (put a tick mark in it) and then select the Back icon. Step 3 The FLOW icon should appear in the PROCESS row, to show that FLOW is enabled in the Channel Setup menu (as the PROCESS Option.) Select the Back icon to go back to the Calibration Main screen.
-
Page 118: Alarm
Process Options 6.3.5 Alarm This process option provides a visual indication of when a user-set alarm limit is exceeded. INFORMATION The user Alarm option is available with all Measure functions except for Barometer and HART. To enable and configure the user Alarm option: Select the icon as the desired channel. - Page 119 Chapter 6. Calibrator Tasks Tap the ALARM area or use the Navigation Pad buttons to select it. The Alarm screen appears. Step 3 Use the procedures given below to set the LOW and HIGH values for alarm activation. Use the Navigation button to move to the LOW option, press the Navigation Enter button to show an onscreen keypad.
- Page 120 Process Options The values displayed in the ALARM row switch between the LOW and HIGH values. Press the Back softkey to return to the Channel Setup screen. The ALARM icon appears, to show that the PROCESS option is enabled. Step 5 When the Alarm is enabled, the ALARM icon appears in the relevant channel window.
-
Page 121: Scaling
Chapter 6. Calibrator Tasks 6.3.6 Scaling This process option provides a method of configuring custom measurement units, using the original units of the Functions. Scaling provides two pairs of values that define the linear relationship between the original measurement unit and the configured custom unit. INFORMATION The Scaling option is available with all measure and source functions except for Observed and HART. - Page 122 Process Options Tap the SCALING area or use the Navigation pad buttons to select it. The Scaling screen appears for the selected channel. Step 3 Copyright 2022 Baker Hughes Company. English–DPI610E Instruction Manual| 123...
- Page 123 Chapter 6. Calibrator Tasks Use the keys on the Navigation Pad to move to the required row and press the Enter key to show a screen keypad. Tap or use the Navigation keys (press the Enter key to enter each number) to select each keypad number.
- Page 124 Process Options To enable or use the custom units, press the Back softkey to go to the Channel Setup screen. Select UNITS. Move down the UNIT options and select Custom. Select the Tick softkey to confirm the selection and return to the Channel Setup screen.
- Page 125 Chapter 6. Calibrator Tasks The Scaling icon will be in the relevant channel window and the UNITS field will show the configured custom label. In addition, the full-scale value will be expressed as its equivalent in the custom unit. Check that the minimum and maximum Step 7 displayed values correspond with the minimum and maximum measured...
- Page 126 Process Options 6.3.6.2 Second Scaling Method Select the UNITS field in the Calibrator screen (Refer to steps 1 to 4 in Section 6.3.6.1) Step 1 Select the Custom option Step 2 Copyright 2022 Baker Hughes Company. English–DPI610E Instruction Manual| 127...
- Page 127 Chapter 6. Calibrator Tasks Select the Setup softkey to view and/or change the Scaling parameters which configure the custom unit. For details on how to configure the parameters, see Section 6.3.6.1 for Method 1) Step 3 Copyright 2021 Baker Hughes Company. 128 | DPI610E Instruction Manual–English...
- Page 128 Process Options Copyright 2022 Baker Hughes Company. English–DPI610E Instruction Manual| 129...
-
Page 129: Utilities
When the Leak Test, Switch Test and Relief Valve Tests are done, there is the option to save the test results in the DPI 610E. These result files are in the CSV format and can be viewed when transferred to a PC (See Section 5.3.1 on page 55). As a result, the Data logging application does not support these tests. - Page 130 Leak Test From the Tasks menu, select Leak Test from the Task list. Tap the Leak Test option again if using the touchscreen or press the Navigation pad OK button to launch the Leak Test utility. Step 2 Note: If no compatible function is configured on CH1, the Internal Pressure function will be used automatically to run the Leak Test.
- Page 131 This time is referred to as WAIT TIME on the DPI 610E and the default WAIT TIME is 1 minute (00:01:00). This time value can Step 3 be changed to any value between ...
- Page 132 Leak Test Select the PLAY softkey to begin the task. (This icon will change to a STOP icon after selection). Note: the displayed WAIT TIME and TEST TIME settings will be cleared. Note: If a WAIT TIME has been set, a “Waiting”...
- Page 133 Note: Result files are stored within the internal memory of the DPI 610E. See Chapter 14 (File System). Only the list of test result files can be viewed on the device. Details of the files can only be accessed when the files are opened on a PC (See Section 9.6.2 on page 169).
-
Page 134: Switch Test
Switch Test 7.2 Switch Test The DPI 610E can test pressure switches or pressure devices with switch contacts. Pressure switches open or close an electrical circuit when a configured setpoint pressure level is reached and/or exceeded. Pressure switches commonly have two types of contact which are: normally open or normally closed. - Page 135 1 bar if using an absolute sensor. Step 4 Connect the pressure switch or device to the test port securely. Connect test leads from the pressure switch contacts to the ± mA/Vin ports on the DPI 610E as shown in the connection diagram below.
- Page 136 Restart softkey. Note: Result files are stored within the internal memory of the DPI 610E. See Chapter 14 (File System). Only the list of test result files can be viewed on the device. Details of the files can only be accessed when the files are opened on a PC (See Section 9.6.2 on page 169).
-
Page 137: Tx (Transmitter Simulation) Simulator
The DPI 610E provides a current output (current source) which is proportional to the pressure measured and indicated by the DPI 610E. This utility is normally used by the DPI 610E to simulate a pressure transmitter and it configured by specifying the transfer function parameters of the current output transmitter to be simulated. - Page 138 Default values are 0 and 24 mA. There is also the option for the DPI 610E to provide power i.e. 10V or 24V. The default setting is Off (no power provided by the DPI 610E). Press the Back softkey.
-
Page 139: Relief Valve Test
Relief Valve Test result files are stored within the internal memory of the DPI 610E. See Chapter 14 (File System). Only the list of test result files can be viewed on the device. Details of the files can only be accessed when the files are opened on a PC (See Section 9.6.2 on... - Page 140 Relief Valve Test Connect the Device Under Test (DUT) securely to the pressure test port of the DPI 610E. Refer to Step 5 “Attach Device Under Test” on page 28 for instructions. Seal the pressure system by closing the pressure release valve securely. For location of this valve Step 6 refer to “Parts”...
-
Page 141: External Sensors
1400 bar, with ranges available in absolute, gauge and differential models. PM700E sensors are available for both commercial and hazardous area environments. Any number of remote sensors can be individually used with a single DPI 610E, because all sensors hold their own calibration data. -
Page 142: Setup
Each PM700E sensor is supplied with a 2.9m (9.5 feet) PM700E-CABLE. This cable is for connection of the sensor to the “EXT SENSOR” port on the side of the DPI 610E. Align the pin/slot arrangement at the female end of the cable connector with the male connector end of the sensor. -
Page 143: The Zero Function
Refer to “The Zero Function” on page 75 for more information about the use of this function. 8.1.5 Available External Pressure Sensors Only the external pressure sensors in Table 8-2 are compatible with the DPI 610E type of instrument. Table 8-2: External Pressure Sensors for DPI 610E Range... -
Page 144: Configuration Of An External Pressure Sensor
PM700E 8.1.6 Configuration of an External Pressure Sensor To configure a channel with the external remote pressure reading: Select the desired channel (channel 1 in this example). Step 1 Select FUNCTION from the Channel Setup screen. Step 2 Select Pressure > EXT> Normal or Pseudo. - Page 145 If the external sensor is disconnected while the function is in use an error message may appear. PM 700E External Remote sensors with DK481 firmware version 2.00.00 and above are fully supported for use with the DPI 610E. Sensor validation is done each time a connection is detected If a channel is configured for External Pressure and an unsupported sensor is detected (for example a PM 700E sensor with firmware older than 2.00.00), a warning message appears...
- Page 146 PM700E Each time a PM 700E sensor is connected or when the DPI 610E is powered on with the sensor connected, the calibration status is checked. If the days remaining from the current DPI 610E system date to the calibration-due date of the sensor is less than 30 days, an on-screen message appears, to inform the user.
-
Page 147: Rtd Probe And Interface
8.2 RTD Probe and Interface 8.2.1 Overview The DPI 610E can be configured to display readings from the RTD-INTERFACE, which is a remote adapter interface and the RTD-PROBE (or any other compatible probe). Temperature measurements can be displayed as resistance or temperature units. The RTD-PROBE and ... -
Page 148: Setup
(IO-RTD-M12EXT) can be used to extend the connection between the RTD-INTERFACE and the RTD-PROBE. If using a compatible RTD not supplied by Druck, use the M12 field wireable connector (IO-RTD-M12CON) to connect the RTD probe to the ... - Page 149 Chapter 8. External Sensors If a channel is configured with RTD function without a sensor connected, the primary reading in that channel window will be displayed as “- - - - -“. If the external sensor is disconnected while the function is in use an error message may appear.
-
Page 150: Configuration Of A Channel For A Rtd Sensor
RTD Probe and Interface 8.2.4 Configuration of a channel for a RTD sensor Select the desired channel (channel 1 in this example). Step 1 Select FUNCTION from the Channel Setup screen. Step 2 Select RTD and select the Tick icon to confirm the selections and show the Channel Setup screen. - Page 151 Chapter 8. External Sensors To configure the RTD measurement as resistance or temperature, select the RTD Mode option from the channel Setup screen and press the Enter key in the Navigation Pad. Tap in the radio button for Resistance or Temperature.
-
Page 152: Rtd Profiles
RTD Probe and Interface 8.2.5 RTD Profiles The full-scale value of the RTD probe is displayed as well as the RTD probe type. When the RTD function is selected, the desired RTD profile might need to be configured by: • Tapping on the currently saved RTD profile field in the Channel Setup screen.... - Page 153 It is possible to copy the parameters saved in any of the profiles to a custom profile. Note the Default EU and Default US profiles cannot be overwritten but can be copied into any of the custom profiles. Custom profiles are saved in the RTD-INTERFACE not on the DPI 610E. Table 8-5: RTD Profile parameters...
- Page 154 RTD Probe and Interface 8.2.5.1 To copy a RTD profile Select the desired profile: Once selected, tap or press the Copy icon softkey and then select the desired destination profile, for example: Profile 1. 8.2.5.2 RTD Units When in Resistance mode, the only units available to select are Ohms (Ω) and Custom units. In Temperature mode, select from °C, °F or Custom units.
-
Page 155: Data Log
Data Log Chapter 9. Data Log 9. Data Log The Data Log function records instrument readings (measured or sourced) so that they can be reviewed or analyzed.The following options are available under the Data Log menu: Option Description Setup Set up data log Files View and delete data log files To access Data Log:... -
Page 156: How To Set The Data Log Filename
Data Log Setup Menu 9.1.1 How to set the Data Log Filename To set the Data Log filename: Select SETUP from the Data Log screen. Step 1 Select Filename from the Data Log Setup screen. Note: TIME INTERVAL, LOG DURATION and DATA POINTS are only listed on the Data Log Setup screen when TRIGGER is set to periodic. - Page 157 Chapter 9. Data Log Use the keypad to enter the new Data Log filename. Note: Only a maximum of 20 characters and symbols is available. Select to confirm the new file name. Step 4 Check that the new filename appears in the Data Log Setup screen.
-
Page 158: Trigger Menu
TRIGGER Menu 9.2 TRIGGER Menu The TRIGGER menu allows the user to select the type Data Log Trigger requirement.The following options are available under the TRIGGER menu: Option Description KEY PRESS Data Log triggered by a key press PERIODIC Periodic Data Log Figure 9-1: Data Log Trigger Menu When KEY PRESS is selected, no more settings will be required to set up the data log. -
Page 159: Periodic Trigger Options
Chapter 9. Data Log 9.3 Periodic Trigger Options The options TIME INTERVAL, LOG DURATION and DATA POINTS are only available for use when PERIODIC is the trigger mode for recording data results. 9.3.1 TIME INTERVAL When a Periodic trigger is selected, the option to set the Periodic interval is available from the Data Log Setup screen. - Page 160 Periodic Trigger Options Use the keypad to set the LOG INTERVAL. Select to confirm. Note: The time interval must be entered in the [HH:MM:SS.S] format in the range [00:00:01] to [23.59.9]. Step 2 Check that required interval appears in the TIME INTERVAL row of the Data Log Setup screen.
-
Page 161: Log Duration
Chapter 9. Data Log 9.3.2 LOG DURATION When a Periodic trigger is selected, the option to set the Data Log Duration is available from the Data Log Setup screen. The log duration determines the period over which the logging will take place i.e., start to end. -
Page 162: Data Points
Periodic Trigger Options Check that required duration appears in the LOG DURATION section of the Data Log Setup screen. Step 3 9.3.3 DATA POINTS When a Periodic trigger is selected, the number of data points configured is displayed in the Data Log Setup screen. - Page 163 Chapter 9. Data Log Use the keypad to set the number of data points. Select to confirm. Step 2 Check that required number of data points appears in the DATA POINTS field of the Data Log Setup screen. Step 3 Copyright 2022 Baker Hughes Company.
-
Page 164: Setting Up Manual Data Logging
Setting up Manual Data Logging 9.4 Setting up Manual Data Logging The KEY PRESS option (see Section 9.2) is a manual data trigger. Use the following steps to continue with a KEY PRESS triggered Data Log session: Select the PLAY icon in the Data Log Setup screen. - Page 165 Chapter 9. Data Log A popup message appears that requests confirmation that the data log session is to end. Select OK to end the session or cancel to continue. If you select OK, another popup message will appear to confirm the data log file has been saved.
-
Page 166: Setting Up Periodic Data Logging
Setting up Periodic Data Logging 9.5 Setting up Periodic Data Logging The PERIODIC option is a time-based data trigger (see Section 9 on page 156, Section 9.2 on page 159 and Section 9.3 on page 160). Use the following steps to continue with a PERIODIC triggered Data Log session: After selecting the PERIODIC Data Log mode and the values of the PERIODIC... -
Page 167: Viewing & Deleting Data Log Files
Chapter 9. Data Log 9.6 Viewing & Deleting Data Log files 9.6.1 Viewing Data Log Files To view the Data Log files: Select FILES in the Data Log screen. Step 1 Tap on (or use the Navigation Pad) to select the required Data Log file. -
Page 168: How To Use A Pc To View Data Log Files In The Dpi 610E
Data log files are saved as csv format in the DPI 610E internal memory. Use a micro- USB data cable to connect the DPI 610E device to the PC (See Section 9.7 on page 173). On the PC, the DPI610E memory appears as a mass storage device or drive within Windows File Explorer. -
Page 169: Deleting Data Log Files
Chapter 9. Data Log Right-click on the desired log file, and choose a supported application to open the file and view the contents: Microsoft Excel is recommended. 9.6.3 Deleting Data Log Files 9.6.3.1 To delete a single Data Log file Select FILES from the Data Log screen. - Page 170 Viewing & Deleting Data Log files Select the ‘single’ trash icon on the Data Log File screen. Step 3 Select OK to confirm. Step 4 Copyright 2022 Baker Hughes Company. English–DPI610E Instruction Manual | 171...
- Page 171 Chapter 9. Data Log 9.6.3.2 To delete all Data Log files Select FILES from the Data Log screen. Step 1 Select the ‘double’ trash icon on the Data Log summary screen. Step 2 Select OK to confirm. Step 3 Copyright 2022 Baker Hughes Company. 172 | DPI610E Instruction Manual–English...
-
Page 172: How To Transfer A Data Log File
How to transfer a Data Log file 9.7 How to transfer a Data Log file Data Log files can be copied from the DPI 610E internal memory to an external device. This device can either be a micro-USB memory stick or an external PC. - Page 173 The PC should automatically detect the the DPI610E which should appear as a Mass Storage drive (default name is DPI610E). Step 6 When the copy process is confirmed, remove the USB memory stick or cable from the DPI 610E. Copyright 2022 Baker Hughes Company.
-
Page 174: Analysis
The Input channel provides a measure of the input signal to the device under test (DUT). For example, if calibrating a pressure transmitter, the Input channel could be the DPI 610E Internal Pressure which measures the supplied pressure to the DUT. -
Page 175: Function
Chapter 10. Analysis 10.3 Function The Analysis Setup screen shows the selected CH1 and CH2 calibrator functions and units. The required functions needed in the Analysis application, need to be selected in the Calibrator application prior to running Analysis. For example, to run analysis on a pressure transmitter with a 4 to 20 mA output, CH1 can be configured to INT Pressure and CH2 to Current Measure ... -
Page 176: Error Type
Analysis Function 10.3.3 ERROR TYPE The error or deviation from the transfer characteristic can be calculated and expressed in any of the following options: % Span - a percentage of the Output signal span. % Full Scale - a percentage of the Output signal full-scale. % Reading - a percentage of the Output signal reading. -
Page 177: Data Logging Within Analysis
To test the full range of the of the Device Under Test (DUT): • Step the input signal value through its range. In the example screen shot, step the internal pressure generated by using the DPI 610E pump from the lower range of the DUT to the full-scale pressure value. •... -
Page 178: Documenting
Test procedures can be created within the Documenting application and stored for future use. When test procedures are used to calibrate DUTs, the test details and results of the calibration are saved in DPI 610E memory. This data can also be transferred to a PC for further analysis or post calibration tasks. -
Page 179: How To Create An Internal Procedure
Chapter 11. Documenting 11.2.2 How to create an Internal Procedure This screen appears after INTERNAL PROCEDURES has been selected from the Procedures screen (see Section 11.2.1 on page 179). The Internal Procedure Files screen shows the list of available internal procedure files. - Page 180 INTERNAL PROCEDURES This is the test procedure setup screen which has the following sections which are critical to the procedure: 1. Input. 2. Output. 3. Test Points. 4. Tolerance. These details are auto populated based on the current Calibrator configuration, parameters configured in the Analysis application setup and other default settings.
- Page 181 Chapter 11. Documenting OUTPUT: The Output refers to the output signal from the Device Under Test (DUT). By default, the FUNCTION (and hence SENSOR type) set up in CH2 is configured as the output with the selected UNITS. These are read-only and not editable in the procedure creation wizard.
- Page 182 INTERNAL PROCEDURES Set the desired number of points UP and DOWN if different from the dis-played. Either UP or DOWN values must be between 0 and 25. Note: There must be a minimum of 2 points UP and maximum of 25 test points in total (i.e.
- Page 183 Chapter 11. Documenting Linearity – the relationship between the input and output can also be specified i.e., either Linear or Square Root transfer function. The default is Linear. TOLERANCE – this is the maximum deviation or permissible error margin for each input test point in the calibration.
- Page 184 INTERNAL PROCEDURES ADJUSTMENT (Tolerance): This sets the maximum deviation within the PASS/FAIL tolerance which indicates that the Device Under Test (DUT) is close to out of specification limits. Hence the ADJUSTMENT tolerance value must be less than the PASS/FAIL tolerance value to be captured.
- Page 185 Chapter 11. Documenting ERROR TYPE (Tolerance): this specifies the way the maximum deviation is calculated and expressed. Options include: • %FS (Percent of Full-scale) • %Span (Percent of Span) • %Percent of reading) Step 4 • %Fixed (Measurement units). Cont’d See Section 10.3.3 on page 177 for more details.
-
Page 186: How To Start A Test Procedure
INTERNAL PROCEDURES 11.2.3 How to start a Test Procedure Once the test procedure has been saved successfully, it is available to be used immediately by selecting the Proceed softkey. Step 1 The test procedure can also be selected from the Internal Procedure Files screen. Select a test procedure, for example, File 2, by tapping in the row or using the Navigation pad. -
Page 187: Additional Data Required
Chapter 11. Documenting 11.2.5 Additional Data Required When a test procedure has been created and saved in DPI 610E memory, additional data is required before a test procedure can be activated. This data is the Device Under Test (DUT) details, plus the Environment and User ID details that apply to a specific test procedure. - Page 188 INTERNAL PROCEDURES 11.2.5.2 Environment and User ID data If required, enter additional data into this screen. AMBIENT TEMPTERATURE – Enter the ambient temperature value where the test is being done. Temperature units available are °C or °F. Use the Toggle softkey to switch between these units.
- Page 189 Chapter 11. Documenting USER ID – enter User ID of the person doing the test procedure. Maximum number of characters: 20. When the required fields have data in them Step 1 select the Back icon to show the Cont’d Environment screen. Copyright 2022 Baker Hughes Company.
-
Page 190: How To Proceed After Input Of Additional Data
INTERNAL PROCEDURES 11.2.6 How to proceed after input of additional data After the Environment and User ID data have been entered, select the Proceed softkey to continue. Step 1 A popup message will appear to prompt the user to check all the details are correct. Select the OK button to clear the message. - Page 191 The screen in Step 5 will appear. Step 4 The DPI 610E performs a verification check to make sure the test requirements and the DUT connected match. At this stage any discrepancies will be flagged with the relevant popup message displayed.
-
Page 192: The Documenting Main Screen
The Documenting Main Screen 11.3 The Documenting Main Screen This section describes the different elements of the Documenting Main Screen. The title bar contains information about: • Number of steps the test requires and what the current step is e.g., Step 1 of 2. The input test point value to apply e.g., ... - Page 193 Chapter 11. Documenting Select the Add Test Point softkey to capture the datapoint. Copyright 2022 Baker Hughes Company. 194 | DPI610E Instruction Manual–English...
-
Page 194: Documenting Settings
Documenting Settings 11.4 Documenting Settings If additional test procedure setup is required before documenting begins, select the Setup softkey. Step 1 Pressure Sensor Type For pressure calibrations, if a different pressure sensor type is to be used from that which was used to create the test procedure, it is possible to change the sensor configuration to match. - Page 195 Chapter 11. Documenting Pressure Sensor Function For pressure-to-pressure calibrations i.e., INT pressure and EXT pressure, the option to swap the assignments of the sensors as Input and Output using the Toggle softkey. Care must be taken to make sure the sensor Step 3 type and range are compatible with that specified in the test.
-
Page 196: Example Testing Session
(or input) the Step 1 setpoint value displayed. In this example, apply 0.0000 bar using the DPI 610E pump and/or volume adjuster. When the value is within the test point tolerance limits, select the Add Test Point Step 1 softkey to capture the datapoint. - Page 197 Chapter 11. Documenting After the last calibration data point has been logged, the Tick softkey will replace the Add Test point softkey. The title bar will show Procedure complete. Select the Tick softkey to confirm completion of the calibration. Step 4 The following screen is the CALIBRATION REMARKS screen.
-
Page 198: Post Examination Of Test Procedure Results
Post Examination of Test Procedure Results 11.6 Post Examination of Test Procedure Results Note: When a test procedure is done on a new Asset for the first time, there will be no As-Found or As-Left results. When no As-Found or As-Left results are detected for a particular asset, the calibration data will be automatically saved as As-Found. -
Page 199: Making An Adjustment On The Device Under Test (Dut)
Chapter 11. Documenting 11.7 Making an adjustment on the Device Under Test (DUT) If at the end of the test procedure, an adjustment is required. For example, if the end result of the test procedure is a Fail. Then it is possible to perform and verify an adjustment using the Analysis softkey. -
Page 200: How To Redo A Test Procedure
How to redo a Test Procedure 11.8 How to redo a Test Procedure The instructions in this section relate to doing a Test Procedure again for an existing asset or Device Under Test (DUT). Select the desired test procedure file from the list in the Internal Procedures Files screen. -
Page 201: How To View Test Results
Chapter 11. Documenting To view As-Found or/and As-Left calibration results, select the desired Asset filename by tapping once to select and a second time to open. Any available results associated with that test procedure and asset will appear on the screen. - Page 202 How to View Test Results. The calibration test procedure results show the following: • Result type – As-Found or As-Left • Date/Time – the date and time stamp the calibration procedure was completed • Details of the input and output function i.e.
-
Page 203: Deleting Asset Data
Chapter 11. Documenting 11.10 Deleting Asset Data Select the required test procedure. Select the required asset to be deleted. Select the Delete softkey. Note: All asset data will be deleted. Step 1 11.11 How to use the Calibration Certificate Wizard When an As-Found or As-Left asset or Device Under Test (DUT) result is viewed, it is possible to create a certificate document,... - Page 204 How to use the Calibration Certificate Wizard Connect the DPI 610E to a PC using a compatible data micro-USB cable. Note: Make sure the USB setting is in Storage mode (See Section 4.3 on page 45). Open the Calibration Certificate Template file and click on the Select CSV cell.
-
Page 205: Hart
HART bi-directional communications technology works as a master/slave protocol and when connecting the DPI 610E to the HART device, the DPI 610E acts as the master and the HART device, the slave. The DPI 610E supports commonly used functions from the Universal and Common Practice commands specified in HART revision 5, 6 and 7. - Page 206 See Section 12.2 on page 210 for Configuration details. The 250-ohm HART resistor option allows Step 5 the DPI 610E provide the resistor when enabled (checkbox ticked). If the instrument is connected directly to a network, there must be a 250-ohm resistor connected in series with the loop power supply and the HART device.
-
Page 207: Starting The Hart Application (2Nd Method)
Chapter 12. HART Note: the 250-ohm HART resistor is important in allowing communication with the HART device, as it provides enough impedance in the signal loop for the HART signal to develop. Select the Back softkey to return to Step 6 the Calibrator screen. -
Page 208: Hart Device Electrical Connection
HART® Connection 12.1.3 HART device electrical connection Use the electrical connection locations as shown below. HART with internal 24 V loop power enabled HART with external loop power (internal loop power disabled). Copyright 2022Baker Hughes Company. English–DPI610E Instruction Manual | 209... -
Page 209: Hart Device Configuration
When the HART device has been physically connected to the DPI 610E (electrical connection and/or pressure connection), the loop current measured by the DPI 610E is displayed as the secondary reading in the CH2 window. Step 1 To establish communication between... - Page 210 HART Device Configuration The connected HART device can be configured with its unique Poll Address. The configuration screen provides options for the HART device polling. Select one of the following Device Poll methods to use: The connected HART device can be configured with its unique Poll Address.
- Page 211 Chapter 12. HART When the DEFINE CUSTOM RANGE option is selected, the Poll Address range must be specified. The default is 0 to 63. To edit the Address range, select the Edit softkey and enter the desired START and END value. Press the Tick softkey to accept and the Step 3...
- Page 212 HART Device Configuration In the Device Poll screen the following information is available: In the Title bar, the Device Poll status is provided i.e., Scanning or Scan Complete. Poll Address being currently searched. Poll Search method or criteria. Search result table which displays the Poll Address, Tag and Step 3 Descriptor of the device when...
- Page 213 Chapter 12. HART The HART device is now connected, and the Primary reading displays the Primary Variable reading from the HART device. The device Poll Address is displayed as well as its full-scale value. Step 4 Cont’d Copyright 2022 Baker Hughes Company. 214 | DPI610E Instruction Manual–English...
-
Page 214: Hart Dashboard
Note: for the HART softkey to appear in the next screen, the HART device must be connected successfully to the Step 1 DPI 610E. See previous section. From the Calibrator screen: select the HART channel icon (either tap the screen icon or press the softkey.) Step 2 A screen of HART options appears. -
Page 215: Unique Id
Chapter 12. HART 12.3.1 Unique ID Figure 12-1: Unique ID screen The Unique ID screen gives identity information about the connected HART device. This HART command gets the long address of the device plus other manufacturer information available. The PREAMBLES data relates to the code that identifies the start and end of a data packet. Note: this is a read-only screen. -
Page 216: Measure Variables
% Range (Percentage - the current PV reading of the PV range) • CH1 Primary (Primary reading on CH1) • CH2 MA (Loop current measured by the DPI 610E). 12.3.4 Signal Condition Figure 12-4: Signal Condition screen This screen shows the following variables (variables with a pen icon can be edited): •... -
Page 217: Sensor Information
Chapter 12. HART 12.3.5 Sensor Information Figure 12-5: Sensor Information screen This screen shows the following variables: • Serial Number • Sensor Units • LRL (Lower Range Limit) • URL (Upper Range Limit) • Minimum Span. Note: This is a read-only screen. Copyright 2022 Baker Hughes Company. -
Page 218: Hart Service Methods
It is useful in testing the integrity of the current loop and ensures the system is functioning correctly. With the DPI 610E Loop test method, the user can force an output current between 4 and 20 mA for normal transmitter operation or <3.6 mA and >21 mA to verify failure alarm indication in the device. - Page 219 Tick softkey. Step 2 On this screen, the current measured by the DPI 610E will be displayed as the result of the forced current output from the HART device. Note: The signal measured by the DPI610E is indicated by the icon...
-
Page 220: D/A Output Trim
Step 2 The Low Trim value has been applied and the measured value now appears. Note: The signal measured by the DPI 610E is indicated by the icon while that measured by the HART Step 3 device is indicated by Make sure that the reading is stable. - Page 221 Chapter 12. HART Select OK in the popup message window to accept the Trim. Or select CANCEL to return to the previous step. Step 3 Cont’d When the Low trim is complete, select the Next softkey to proceed to the High Trim procedure or select the Back softkey to exit.
- Page 222 The High Trim value has been applied and the measured value is now displayed. Note: the signal measured by the DPI 610E is denoted by the icon while that measured by the HART Step 7 device is denoted by Make sure that the reading is stable.
- Page 223 Chapter 12. HART Select the Verification softkey to test if the adjustment has been sufficient. Step 9 In the Verification screen, use the Edit softkey to enter test current output values between 0 and 24 mA and check the measured values at each point. To exit the Verification screen, use the Step 10 Back...
-
Page 224: Pressure Zero Trim
Step 1 Wait and make sure the reading is stable. Note: the signal measured by the DPI 610E is denoted by the icon while that measured by the HART device is denoted by Select the Trim softkey. -
Page 225: Hart Error And Message Codes
Chapter 12. HART 12.5 HART Error and Message Codes Error Description Code Success Undefined Error Invalid Selection Passed Parameter Too Large Passed Parameter Too Large Too few data bytes received Device-specific Command Error In Write Protect Mode 8-14 Multiple Meaning Warning Access Restricted Invalid Device Variable Index Invalid Unit Code... -
Page 226: Instrument Calibration
Instrument Calibration How to show the Instrument Calibration screen 13. Instrument Calibration 13.1 How to show the Instrument Calibration screen Select the Settings icon the Dashboard. Tap on the icon or press the softkey on the right of icon. Step 1 Select ADVANCED at the bottom of the General Settings screen Tap on ADVANCED or use the... - Page 227 Chapter 13. Instrument Calibration Use the onscreen keypad in the Advanced Menu screen to enter the PIN number 4321 and then select the tick icon. Step 3 In the Advanced Menu screen, select CALIBRATION. Refer to Chapter 5, “Advanced Menu” on page 52, for instructions on how to use the other Advanced Menu options.
-
Page 228: The Instrument Calibration Screen Options
Return to the factory (default) calibration status Note: The information in this chapter is for calibrating Internal and External sensors. The configuration of external sensors, to enable the DPI 610E to recognise and use external sensors, is explained in Chapter 8, “External Sensors” on page 142. -
Page 229: Perform Calibration
Chapter 13. Instrument Calibration 13.2 PERFORM CALIBRATION The following functions are available in the Perform Calibration screen: Function Direction Range Current Measure 20 mA 55 mA Source 24 mA Voltage Measure 20 V 30 V Source 10 V Millivolts Measure 200 mV 2000 mV Pressure... - Page 230 To calibrate an electrical function (Current Measure is used in this example), make sure the electrical connection between the DPI 610E and the external calibrated equipment is correct (See Section 6.2.9 on page 88 for Current Measure electrical connection diagram). ...
- Page 231 The top two sections cover: • The reference reading from an external calibrated equipment. • The measured (or sourced) reading from the DPI 610E. The bottom section provides the following information: Step 5 Function minimum range (or negative full-scale) value.
- Page 232 Calibration point 2. Step 8 Apply Steps 6 to 8, but this time begin by applying the nominal zero Current (approximately 0 mA) to the DPI 610E. This completes Calibration point 2. Step 9 Copyright 2022 Baker Hughes Company. English–DPI610E Instruction Manual | 233...
- Page 233 Chapter 13. Instrument Calibration Once again, apply Steps 6 to 8, but this time begin by applying the positive full-scale Current (approximately 20 mA) to the DPI 610E. Press the Next softkey to complete Calibration point 3. Step 10 A message window appears, requesting...
-
Page 234: Calibration - Internal Pressure Sensor
13.2.2 Calibration - Internal Pressure Sensor To calibrate the internal pressure sensor of the DPI 610E, make sure the correct pressure connection is made from the test port and the external calibrated pressure source. This sensor calibration should only be done by approved service centres and personnel. - Page 235 The top two sections cover: • The reference reading from external calibrated equipment. • The measured (or sourced) reading from the DPI 610E. The bottom section provides the following information: Function minimum range (or negative Step 3 full-scale) value. Function maximum range (or positive...
- Page 236 PERFORM CALIBRATION Press the Next softkey to complete Calibration point 1 and proceed to Calibration point 2. Step 6 Apply Steps 4 to 6, but this time begin by applying the nominal positive full-scale pressure to the DPI610E. Press the Next softkey to complete Calibration point 2 and proceed to Calibration point 3.
- Page 237 Chapter 13. Instrument Calibration If OK is selected, the CALIBRATION COMPLETE message appears in the status box, to confirm the adjustment has been made. At this stage, there are three icons for three ways to proceed. These are: VERIFICATION softkey navigates to Step 9 the Verification screen (see Step 13).
-
Page 238: Calibration - Internal Barometer
PERFORM CALIBRATION 13.2.3 Calibration – Internal Barometer To calibrate the internal barometer sensor of the DPI 610E, make sure the correct pressure connection is made from the barometer port and the external calibrated pressure source. This sensor calibration should only be done by approved service centres and personnel. - Page 239 The top two sections show: • The reference reading from external calibrated equipment. • The measured (or sourced) reading from the DPI 610E. The bottom section gives the following information: Function minimum range (or negative full-scale) value. Function maximum range (or positive...
- Page 240 Calibration point 2. Step 5 Apply Steps 3 to 5, but this time begin by applying the nominal positive full-scale pressure to the DPI 610E. When the measured Pressure reading is stable, select the Next icon to continue. This completes Calibration point 2.
- Page 241 Chapter 13. Instrument Calibration If OK is selected, the CALIBRATION COMPLETE message appears in the status box, to confirm the adjustment has been made. At this stage, there are three icons for three ways to proceed. These are: VERIFICATION softkey navigates to Step 8 the Verification screen (see Step 9).
-
Page 242: Internal Pressure Sensor Status
INTERNAL PRESSURE SENSOR STATUS 13.3 INTERNAL PRESSURE SENSOR STATUS The Internal Pressure Sensor Status screen (Figure 13-2) provides information about the instrument’s internal pressure sensor: Figure 13-2: Instrument Status screen To access the Internal Pressure Sensor Status screen (Figure 13-2), select INTERNAL PRESSURE SENSOR STATUS from the Instrument Calibration screen as shown below: Select INTERNAL PRESSURE SENSOR STATUS from the Instrument Calibration... -
Page 243: Set Calibration Date & Interval
Chapter 13. Instrument Calibration 13.4 SET CALIBRATION DATE & INTERVAL The following options are available in the Instrument Calibration Date & Interval screen: Option Description LAST CALIBRATION Set the date the instrument was last calibrated CALIBRATION INTERVAL Enable user notification by setting the number of days between the last calibration and the next scheduled calibration (default is 365 days) CALIBRATION DUE... -
Page 244: Change Last Calibration Date
SET CALIBRATION DATE & INTERVAL 13.4.1 Change Last Calibration Date Select LAST CALIBRATION from the Instrument Calibration Date & Interval screen. Step 1 Select the required day, month, and year, as required (see Chapter 1.19.3 on page 25). To change the value, select the row of the variable. -
Page 245: Change Calibration Interval
Chapter 13. Instrument Calibration 13.4.2 Change Calibration Interval Select CALIBRATION INTERVAL from the Date & Interval Instrument Calibration screen. Step 1 Enter a calibration interval between 7 and 548 (days). Select to confirm. Step 2 Copyright 2022 Baker Hughes Company. 246 | DPI610E Instruction Manual–English... -
Page 246: Change Calibration Due Date
SET CALIBRATION DATE & INTERVAL 13.4.3 Change Calibration Due Date Select CALIBRATION DUE from the Date & Interval Instrument Calibration screen. Step 1 Select the required day, month and year, as required (see Chapter 1.19.3 on page 25). To change the value, select the row of the variable. -
Page 247: Backup Calibration
Chapter 13. Instrument Calibration 13.5 BACKUP CALIBRATION The current calibration configuration can be saved in the form as a Backup file. This Backup file can be used to restore the instrument’s calibration if necessary. Select BACKUP CALIBRATION from the Date & Interval Instrument Calibration screen. -
Page 248: Restore Calibration
RESTORE CALIBRATION 13.6 RESTORE CALIBRATION This function allows the user to restore a previous calibration configuration. Note: A valid calibration backup file must exist, to enable this calibration restore feature to be used. See Section 13.5 on page 248 for how to create this file. Select RESTORE CALIBRATION from the Instrument Calibration menu. -
Page 249: Restore Factory Calibration
Chapter 13. Instrument Calibration 13.7 RESTORE FACTORY CALIBRATION The instrument has its factory calibration saved internally before it is shipped from our factory. If for any reason (for example, if an incorrect calibration adjustment has been made), the instrument needs its calibration resetting to the point at which it was shipped, the Restore Factory Calibration feature can be used Select RESTORE FACTORY CALIBRATION from the Instrument... -
Page 250: External Pressure Sensor Calibration Menu
Also, ensure the sensor is connected to the EXT SENSOR port on the DPI 610E using the sensor cable supplied. This sensor calibration should only be done by approved service centres and personnel. -
Page 251: View External Pressure Sensor Status
Chapter 13. Instrument Calibration The calibration procedure of the external PM700E sensor is like that of the DPI 610E internal pressure sensor. See Section 13.2.2 on page 235. Step 2 13.8.2 VIEW EXTERNAL PRESSURE SENSOR STATUS The External Pressure Sensor Status screen (Figure 13-4) provides information about the instrument’s internal pressure sensor. -
Page 252: Set Calibration Date & Interval
EXTERNAL PRESSURE SENSOR CALIBRATION MENU 13.8.3 SET CALIBRATION DATE & INTERVAL The External Pressure Sensor Calibration Date & Interval screen provides the following options: Option Description LAST CALIBRATION Set the date the instrument was last calibrated CALIBRATION INTERVAL Enable user notification by setting the number of days between the last calibration and the next scheduled calibration (default is 365 days) CALIBRATION DUE... - Page 253 Chapter 13. Instrument Calibration 13.8.3.1 Change LAST CALIBRATION Date Select LAST CALIBRATION from the External Sensor Calibration Status screen. Step 1 Select the required day, month, and year, as required (see Chapter 1.19.3 on page 25). To change the value, select the row of the variable.
- Page 254 EXTERNAL PRESSURE SENSOR CALIBRATION MENU 13.8.3.2 Change CALIBRATION INTERVAL Select CALIBRATION INTERVAL from the External Pressure Sensor Status screen. Step 1 Enter a calibration interval between 7 and 548 (days). Select to confirm. Step 2 Copyright 2022 Baker Hughes Company. English–DPI610E Instruction Manual | 255...
- Page 255 Chapter 13. Instrument Calibration 13.8.3.3 Change CALIBRATION DUE Date Select CALIBRATION DUE from the Date & Interval Instrument Calibration screen. Step 1 Select the required day, month and year, as required (see Chapter 1.19.3 on page 25). To change the value, select the row of the variable.
-
Page 256: External Rtd Sensor Calibration Menu
13.9 EXTERNAL RTD SENSOR CALIBRATION MENU Refer to Section 8 on page 142 for how to configure the DPI 610E to recognize and use an external RTD sensor. This is necessary to enable the DPI 610E user interface to show the RTD sensor calibration options. - Page 257 The top two sections cover: • The reference reading from external calibrated equipment. • The measured (or sourced) reading from the DPI 610E. The bottom section provides the following information: Function minimum range (or negative full-scale) value. Function maximum range (or...
- Page 258 Step 4 Repeat Steps 2 to 4, but this time begin by applying the nominal positive full- scale resistance or temperature value to the DPI 610E. This completes Calibration Point 2. Step 5 After pressing Next from the previous step, a message window will appear,...
- Page 259 Chapter 13. Instrument Calibration If OK is selected, the CALIBRATION COMPLETE message appears in the status box, to confirm the adjustment has been made. At this stage, there are three icons for three ways to proceed. These are: VERIFICATION softkey navigates to the Verification screen (see Step 8).
-
Page 260: Set Calibration Date & Interval
EXTERNAL RTD SENSOR CALIBRATION MENU 13.9.2 SET CALIBRATION DATE & INTERVAL The External Pressure Sensor Calibration Date & Interval screen provides the following options: Option Description LAST CALIBRATION Set the date the instrument was last calibrated CALIBRATION INTERVAL Enable user notification by setting the number of days between the last calibration and the next scheduled calibration (default is 365 days) CALIBRATION DUE... - Page 261 Chapter 13. Instrument Calibration 13.9.2.1 Change Last Calibration Date Select LAST CALIBRATION from the Instrument Calibration Date & Interval screen. Step 1 Select the required day, month, and year, as required (see Chapter 1.19.3 on page 25). To change the value, select the row of the variable.
- Page 262 EXTERNAL RTD SENSOR CALIBRATION MENU 13.9.2.2 Change Calibration Interval Select CALIBRATION INTERVAL from the Date & Interval Instrument Calibration screen. Step 1 Enter a calibration interval between 7 and 548 (days). Select to confirm. Step 2 Copyright 2022 Baker Hughes Company. English–DPI610E Instruction Manual | 263...
- Page 263 Chapter 13. Instrument Calibration 13.9.2.3 Change Calibration Due Date Select CALIBRATION DUE from the Date & Interval Instrument Calibration screen. Step 1 Select the required day, month and year, as required (see Chapter 1.19.3 on page 25). To change the value, select the row of the variable.
-
Page 264: File System
The Files system menu provides access to all user files stored in the internal storage of the DPI 610E. It is accessible from the Dashboard screen and displays a structure of directories used to organize the files for easy and reliable viewing. -
Page 265: The Files System Screen Options
Chapter 14. File System 14.1.1 The Files system screen options Option Description Calibration Export / View instrument calibration files Data Log View / Open / Delete data log files Procedures View / Delete test procedures, assets, and results files Leak Test View saved leak test result files Switch Test View saved switch test result files... -
Page 266: Data Log
Data Log 14.3 Data Log When the Data Log folder is selected, a list of log files saved on the instrument appears on its screen. The log files can be accessed, and their contents displayed from this menu. It is also possible to delete any unwanted log files, either using the Single Delete softkey which deletes single selected files, or the Delete All softkey which deletes all log files... -
Page 267: Leak Test
Chapter 14. File System 14.5 Leak Test The Leak Test Results folder displays a list of saved results files from completed leak tests. This is view only, details of the test results can be viewed by opening the file on a PC. There is the option to delete unwanted results files within the folder using either the Single Delete softkey to delete all files in the ... -
Page 268: Relief Valve
14.8 How to view the File System on a PC The contents of the internal storage of the DPI 610E can be accessed when connected to a PC. Connect the DPI 610E, using the micro-USB cable supplied (or any compatible mini-USB cable) to the USB port of the PC. -
Page 269: Favorites, Error Log And Event Log
Chapter 14. File System The contents of the DPI 610E storage are similarly structured to what can be viewed on the device in terms of the folder structure. The HART folder is the exception as its folder and contents can only be accessed on a PC. -
Page 270: Status Menu
15. Status Menu 15.1 Status Menu Options The Status menu is a read-only menu that provides important information about the DPI 610E instrument. It is accessible from the Dashboard and has the following view options: Table 15-1: Status Menu Options... -
Page 271: Software Build
Chapter 15. Status Menu 15.3 SOFTWARE BUILD In the Status menu screen select the SOFTWARE BUILD row, to show the Status - Software Build screen. Step 1 The Status - Software Build screen shows the MAIN APPLICATION (DK492) and the BOOTLOADER (DK491) build version information. -
Page 272: Calibration
CALIBRATION 15.4 CALIBRATION In the Status menu screen select the CALIBRATION row, to show the Status - Calibration screen. Step 1 The Status - Calibration screen shows the INSTRUMENT (or sensor) option. Note: For the EXTERNAL PRESSURE SENSOR option to be available in this screen, the EXT pressure (see Section 8.1.6 on page 145) or EXTERNAL RTD function (see Section 8.2.4 on... -
Page 273: Battery
Chapter 15. Status Menu 15.5 BATTERY In the Status menu screen select the BATTERY row, to show the Status - Battery screen. Step 1 The Status - Battery screen shows the current instrument battery level and if the battery is either Discharging or being Charged. -
Page 274: Memory
MEMORY 15.6 MEMORY In the Status menu screen select the MEMORY row, to show the Status - Memory screen. Step 1 The Status - Memory screen shows the current free and used space in the instrument’s internal memory. Step 2 Copyright 2022 Baker Hughes Company. -
Page 275: Sensor
Chapter 15. Status Menu 15.7 SENSOR In the Status menu screen select the SENSOR row, to show the Status - Sensor screen. Step 1 The Status - Sensor screen appears because the instrument has been configured to use an external sensor (see Section 8.1.6 on page 145.) Note: For the EXTERNAL SENSOR option to be available in this screen, the EXT... -
Page 276: Error Log
ERROR LOG 15.8 ERROR LOG The DPI 610E records detailed information whenever it encounters any operational software or firmware issues. Note: Each time the Error Log is selected, an export of the currently logged errors is automatically created as a CSV file. This export file(s) is displayed in the Error Log screen but can only be opened if transferred and accessed from a PC: (refer to Section 9.6.1 on page 168... -
Page 277: Event Log
Chapter 15. Status Menu 15.9 EVENT LOG The DPI 610E records detailed information about significant events that occur on the instrument during operation. These events can include errors, warnings, etc. Note: Each time the Event log is selected, an export of the currently logged system events is automatically created as a CSV file. -
Page 278: General Specification
16. General Specification Refer to www.druck.com/dpi610e for the Datasheet that gives the technical specifications for the DPI 610E. 16.1 Open Source Software Licenses Two files are available with the software installation: 1568-notices-report-08_08_2022_17_04.txt covers DK0491 DPI610E Bootloader. 1563-notices-report-08_08_2022_16_01.txt covers DK0492 DPI610E Main Application. -
Page 279: Manufacturer
Chapter 17. Manufacturer Manufacturer 17. Manufacturer 17.1 Contact details Druck Limited 2 Fir Tree Lane Groby Leicester LE6 0FH United Kingdom Tel: +44 (0)116 231 7100 www.Druck.com Copyright 2022 Baker Hughes Company. 280 | DPI610E Instruction Manual–English... - Page 280 Pune Tokyo +33 562 888 250 +91-2135-620421~425 +81 3 6894 1838 sensing.FR.cc@bakerhughes.com mcindia.inhouseservice@bakerhughes.com service.druck.jp@bakerhughes.com Abu Dhabi Leicester Billerica +971 2 4079381 +44 (0) 116 2317107 +1 (281) 542-3650 ...
Need help?
Do you have a question about the DPI 610E and is the answer not in the manual?
Questions and answers