Snap-On ZEUS User Manual
Hide thumbs
Also See for ZEUS:
- Getting started pack (10 pages) ,
- User manual (235 pages) ,
- Getting started pack (10 pages)
Table of Contents
Advertisement
Quick Links
Advertisement
Table of Contents
Troubleshooting

Related Manuals for Snap-On ZEUS


Summary of Contents for Snap-On ZEUS
- Page 1 User Manual ZEEMSGB342A Rev. B Start...
- Page 2 Contents Quick Links Click a Topic Using Page Controls OBD Direct Table of Contents (TOC) Guided Component Tests General Information Scope Multimeter Getting Started Information Quick Reference Information Vehicle History Maintenance Data Manager Scanner Help System Settings Intelligent Diagnostics Compact Scan Module...
-
Page 3: Table Of Contents
Contents Table of Contents Table of Contents Safety Information ..................1 Camera (Taking Pictures)................11 Using the Camera ................. 11 READ ALL INSTRUCTIONS................1 Viewing Pictures..................12 Safety Signal Words ..................1 Windows (Applicable Features / Operations) ..........12 Safety Message Conventions ................ 2 Wi-Fi Setup ................... - Page 4 Contents Table of Contents Connecting the CSM ................30 Section 5: Intelligent Diagnostics ............68 Pairing and Hardware Status Icons............31 Introduction....................68 Firmware Updates..................33 Main Topic Links..................68 Troubleshooting ................... 34 Accessing Intelligent Diagnostics ..............68 Error Messages ..................35 Main Menu and Basic Navigation ...............
- Page 5 Slope (Trigger) Icon................113 Getting Started ..................137 Scale (Vertical / Y-axis) ............... 113 Vehicle Identification ................137 Sweep Scale (X-axis) ................114 The Snap-on Information Application ............138 Min, Live and Max Display Panel ............115 Main Screen ..................138...
- Page 6 Contents Table of Contents Overview ....................142 Menu Bar .................... 165 Fault Code Search ................142 Display Toolbar ................... 167 Navigation Tools ................. 168 Maintenance ..................... 142 Repair Data....................144 Customizing the Display..............169 Electronics ....................147 Customizing the Parameter List ............169 Electronic Systems................
- Page 7 Contents Table of Contents Screen Protector Installation..............185 Stylus Tip Replacement (Touch Screen) ........... 186 Legal Information..................187 Trademarks....................187 Copyright Information................. 187 Software License Information ..............187 Patent Information ..................187 Disclaimer of Warranties and Limitation of Liabilities......... 187 ***IMPORTANT INFORMATION*** ............
-
Page 8: Safety Information
Safety Information READ ALL INSTRUCTIONS Read, understand and follow all safety messages and instructions in this manual, the accompanying Important Safety Instructions manual, and on the test For your own safety, the safety of others, and to prevent damage to the product and equipment. -
Page 9: Safety Message Conventions
Safety Information Safety Message Conventions Safety Message Conventions Safety messages are provided to help prevent personal injury and equipment damage. Safety messages communicate the hazard, hazard avoidance and possible consequences using three different type styles: Normal type states the hazard. •... -
Page 10: Using This Manual
Using This Manual Conventions This manual contains basic operating instructions and is structured in a manner to help you become familiar with your diagnostic tool features and perform basic operations. Hyperlinks The illustrations in this manual are intended as reference only and may not depict actual screen results, information, functions or standard equipment. -
Page 11: Symbols
Using This Manual Conventions Symbols Notes and Important Messages The “greater than” arrow (>) indicates an abbreviated set of selection instructions. The following messages are used. Example: Note Select Utilities > Tool Setup > Date. • A note provides helpful information such as additional explanations, tips, and The above statement abbreviates the following procedure: comments. -
Page 12: Quick Reference
Information Service Click on an icon below to go to that section. The following integrated services provide up-to-date service/repair information directly to your diagnostic tool, via wireless network connection to our Snap-on Web Services Network: Intelligent Diagnostics (within Scanner) •... -
Page 13: Product Training Videos
Quick Reference Product Training Videos Product Training Videos Product specific training videos and support is available on our website. Learn the basics of diagnostic tool operation with our free training videos, and watch our Quick Tips videos to see how to use your diagnostic tool to solve common vehicle problems. -
Page 14: Section 1: General Information
General Information Section 1 Introduction Main Topic Links Diagnostic Tool Feature Locations page 8 • This diagnostic tool is a specialized personal automotive diagnostic solution that Power (Battery Pack/Charging) page 9 combines information with test instrumentation to help you diagnose symptoms, •... -
Page 15: Diagnostic Tool Feature Locations
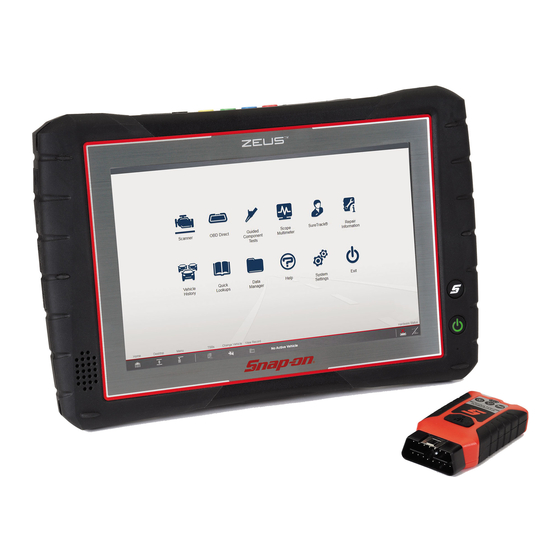
General Information Main Topic Links Diagnostic Tool Feature Locations Capacitive Touch Screen Shortcut (S) Button (special functions) Power Button (with backlit LED functions) Audio Speaker Stylus Storage Scope Module M4 (removable) Camera Lens Communication and Power Jacks Cover Head Phone Jack 10. -
Page 16: Internal Battery Pack
General Information Turning On/Off, and Emergency Shutdown Power (Battery Pack/Charging) Turning On/Off, and Emergency Shutdown 1.2.1 Internal Battery Pack The following sections describe how to turn the diagnostic tool on and off, and perform an emergency shutdown. The diagnostic tool (display unit) comes equipped with a rechargeable internal battery pack that can be charged using the supplied AC power adapter. -
Page 17: Emergency Shutdown
General Information Turning On/Off, and Emergency Shutdown 1.3.3 Emergency Shutdown Pressing the shortcut button (Figure 1-2) (when set to open the shortcut menu), opens a slide-out menu which provides the following selectable icon options: IMPORTANT Icon Description Screen Using the emergency shutdown procedure while communicating with Capture Saves a bitmap image (screenshot) of the visible screen. -
Page 18: Configure Shortcut (S) Button
The Advanced selection has no functionality under normal operating conditions, Next and should ONLY be selected when directed to do so, by Snap-on customer Displays in Gallery mode. Selecting opens the picture after the current service. -
Page 19: Viewing Pictures
General Information Windows (Applicable Features / Operations) 1.6.1 Wi-Fi Setup Taking pictures: 1. Press the Shortcut (S) Button and choose Camera from the menu. ® The diagnostic tool uses Windows 7 embedded system software. Wi-Fi connection 2. Focus the image to be captured in the view finder. is controlled through the Windows operating system. -
Page 20: Windows Taskbar
General Information Windows (Applicable Features / Operations) 1.6.2 Windows Taskbar The wireless network connection window opens (shown below). The standard Windows taskbar displays program icons that are currently running or that you have pinned to the taskbar for quick access. 1.6.3 Windows Taskbar Notification Area My wireless connection 1 My wireless connection 1... -
Page 21: Virtual Keyboard (Entering Text)
General Information Windows (Applicable Features / Operations) 1.6.5 Virtual Keyboard (Entering Text) Touch Screen Gestures This device uses common touch screen gesture motions (e.g. pinch-to-zoom, press The Windows Touch Keyboard (Virtual Keyboard) allows you to type characters and tap, pan and swipe). The terms used to describe the various gestures may vary and key in information to complete form and data entry fields, similar to a physical (industry wide), however the general procedures and usage are similar for specific keyboard. -
Page 22: Sleep Mode (Auto Off Display)
General Information Windows (Applicable Features / Operations) To learn more about the virtual keyboard, select Help Topics from the Tools menu IMPORTANT to open the Windows Touch Keyboard help and support (Figure 1-6). If Sleep Mode is accidentally activated during active vehicle communication, vehicle communication will stop, vehicle selection will be reset to “no active vehicle”... -
Page 23: E-Mail Client Setup
General Information Windows (Applicable Features / Operations) 1.6.7 E-Mail Client Setup The Data Manager function features an e-mail option that allows you to send a saved data or image files as an e-mail attachment. To use this feature, you must install an e-mail client, and then link your existing e-mail address to the client. - Page 24 General Information Windows (Applicable Features / Operations) NOTE E-mail client configuration settings should automatically be set during installation. If problems arise with the setup and manual configuration is needed, refer to the e-mail client help information and the Windows help information.
-
Page 25: Calibrating The Touch Screen
General Information Windows (Applicable Features / Operations) 1.6.8 Calibrating the Touch Screen NOTE The touch screen can be calibrated for accuracy using the Windows Tablet PC If you are using an optional touch screen (e.g. using an external touch screen Settings. -
Page 26: Printing / Printer Setup
General Information Windows (Applicable Features / Operations) 1.6.9 Printing / Printer Setup USB Printer Setup 1. Turn the printer on. Selecting Print opens a standard Windows Print dialog box. 2. Connect the USB cable from the printer to the diagnostic tool. To print, a printer must installed and set as the system default printer. - Page 27 General Information Windows (Applicable Features / Operations) 7. Follow the onscreen instructions to search, locate and install your printer. 2. From the diagnostic tool, click the Wi-Fi icon in the System Tray (Figure 1-16). Windows automatically searches for available printers on the network (Figure 1-15).
-
Page 28: Default Printer Setting
General Information Windows (Applicable Features / Operations) ® 1.6.11 Checking/Installing Adobe Reader It is important that you install the printer driver files when prompted, during setup. Printer driver files may be supplied with the printer (e.g. CD or memory stick), or To print the Vehicle System Report, Adobe Reader must be installed. -
Page 29: Operating System Restore
To restore the operating system 1. Turn on the diagnostic tool. 2. During boot-up wait for the “Press the “S” button to run Snap-on System Restore.” message to display, then Press the Shortcut (S) button. A progress indicator displays while the program loads. -
Page 30: Diagnostic Tool Technical Specifications
General Information Diagnostic Tool Technical Specifications Diagnostic Tool Technical Specifications Item Description / Specification Touch Screen Capacitive Touch Panel 10.1 inch diagonal, TFT Color LCD Display 1280 x 800 resolution (WXGA) Processor Intel Quad Core N2930, 1.8GHz ® ® Operating System Microsoft Windows Embedded 7... -
Page 31: Section 2: Getting Started - Diagnostic Suite Program
Getting Started - Diagnostic Suite Program Section 2 Introduction NOTE This section describes the basic operation, and navigation of the ShopStream The ShopStream Diagnostic Suite can also be started from the Windows Start Diagnostic Suite program Home screen and icons. menu. -
Page 32: Function Icons
Getting Started - Diagnostic Suite Program Function Icons 2.12 Function Icons Icon Description Data Manager The Function Icons configure the diagnostic tool for the type of test to be performed. The following table gives brief descriptions of the available icons, which operations Opens the organization system for saved data files. -
Page 33: Menu Icon
Getting Started - Diagnostic Suite Program Menu Icon 2.13 Toolbar Icons 2.14 Menu Icon Operation of the icons located on the toolbar are described in the table below: The Menu icon on the Toolbar at the base of the display screen opens a list of basic operations and features. -
Page 34: Changing The Units Of Measurement
Getting Started - Diagnostic Suite Program Changing the Units of Measurement 2.15 Changing the Units of Measurement The Diagnostic Suite units of measurement can be changed for temperature, vehicle speed, air pressure and other pressure readings. Choose between US customary or metric units of measure. To change the units of measurement: 1. -
Page 35: Section 3: Compact Scan Module (Csm)
Compact Scan Module (CSM) Section 3 Introduction 3.16 Feature Locations This section describes the connection, and basic operation of the Compact Scan Module (CSM). The CSM is a wireless device that is connected directly to the vehicle data link connector (DLC), and wirelessly transmits vehicle data to the diagnostic tool. Main Topic Links Feature Locations page 28... -
Page 36: Led Indicators
Compact Scan Module (CSM) LED Indicators 3.18 LED Indicators 3.19 Audible Alerts The three light emitting diodes (LEDs) on the CSM indicate communication status. In addition to onscreen messages, the CSM uses audible tones to alert you of The following LED descriptions apply only when the CSM is powered by the vehicle connection status. -
Page 37: Basic Operation
Compact Scan Module (CSM) Basic Operation 3.21 Basic Operation 3.21.1 Connecting the CSM To use the Compact Scan Module (CSM), it must be powered, paired to the diagnostic tool and connected to the vehicle DLC. To pair the CSM, see Pairing and on page 31. -
Page 38: Pairing And Hardware Status Icons
Compact Scan Module (CSM) Basic Operation 3.21.2 Pairing and Hardware Status Icons To use the CSM, it must be paired with the diagnostic tool. Pairing is the wireless connection (identification) process used to connect the CSM to your diagnostic tool. The CSM only needs to be paired once before its initial use. - Page 39 Compact Scan Module (CSM) Basic Operation 3. For additional CSM connection status information, see Hardware Status Icons NOTE on page 32. If a CSM firmware update is available, the CSM will automatically be updated, Firmware Updates on page 33 for additional information. Hardware Status Icons The hardware status indicators (Home screen lower-right corner) provide a quick When pairing is successful the CSM hardware status indicator displays on the...
-
Page 40: Firmware Updates
Compact Scan Module (CSM) Firmware Updates Status/Icon Action Paired but Not Indicates the CSM is wirelessly connected but not communicating. Communicating You may have moved out of range. Move the diagnostic tool closer to the CSM to reestablish communications. If connectivity is not restored, see Pairing and Hardware Status Icons on page 31... -
Page 41: Troubleshooting
Compact Scan Module (CSM) Troubleshooting A “Successfully Updated” message displays once the installation process is NOTE complete (Figure 3-11). When performing a firmware update it is recommended to disconnect the CSM from the vehicle (if connected) and use the supplied USB cable to connect the CSM to the diagnostic tool. -
Page 42: Error Messages
Compact Scan Module (CSM) Troubleshooting 3.23.1 Error Messages To recover wireless connectivity: 1. Disconnect the CSM from the vehicle. If the CSM is paired to the diagnostic tool and tries to communicate with the vehicle 2. Navigate to the Home Screen on the diagnostic tool. and the CSM is not connected to the vehicle, a “no communication”... -
Page 43: Technical Specifications
Compact Scan Module (CSM) Technical Specifications 3.24 Technical Specifications Software Restart Procedure This method, which closes and restarts the ShopStream Diagnostic Suite software, takes about two minutes to complete. Item Description / Specification ® Communications Wireless Bluetooth 2.1 Technology To restart the ShopStream Diagnostic Suite: Operating Range Approx. -
Page 44: Section 4: Scanner
Scanner Section 4 Introduction 4.25 Basic Operation This section includes a basic overview of the Scanner function and basic operation The Scanner function allows your diagnostic tool to communicate information. with the electronic control modules (ECMs) of the vehicle being serviced. -
Page 45: Basic Scanner Operation (Quick Start)
Scanner Main Topic Links 4.25.2 Basic Scanner Operation (Quick Start) NOTE This section lists the basic scanner operation steps, and is only intended as a If the CSM is not connected, an onscreen message may appear providing quick-start reference. Refer to the supporting topics in this section for detailed connection instructions. -
Page 46: Selecting A Vehicle System
Scanner Main Topic Links Manual ID A list of vehicle types or models will display. Several selections may be required to identify the vehicle type and model, follow the screen prompts and Using Manual ID, the vehicle identification must be manually entered. The vehicle enter the required information. -
Page 47: Selecting A Vehicle System Test/Function
Scanner Main Topic Links Body Control Module Special vehicle system options may include: • Instrument card Code Scan, see • • Code Scan (with Vehicle System Report) on page 45 Tire Pressure Monitor Clear All Codes Read by Code Scan, see •... -
Page 48: Exiting Scanner
Scanner Menu Options (lower toolbar icon) System Tests—provides specific subsystem testing. Performing these tests is The vehicle description on the lower toolbar will change to display “No Active • similar to functional tests. Vehicle”. 4. Select the Home icon on the lower toolbar, to return to the Home screen NOTE (Figure 4-7). -
Page 49: File
Scanner Menu Options (lower toolbar icon) 4.26.1 File Use to print or save a copy of the data currently being viewed. Menu options include: Save—opens a submenu with these options: • Screenshot—saves a graphic image of the current screen. – Collected Data—saves a recording of all the data currently in the buffer plus –... -
Page 50: Codes Menu (Viewing Codes)
Scanner Codes Menu (Viewing Codes) 4.27 Codes Menu (Viewing Codes) User’s Manuals This option opens a menu of additional support documentation, such as vehicle NOTE communication software manuals, available to assist in your diagnosis. These manuals provide connection information, detailed test procedures, and other The “Codes Menu”... -
Page 51: Clear Codes
Scanner Codes Menu (Viewing Codes) 4.27.3 Freeze Frame/Failure Record Data Typical submenu options may include (descriptive name may vary): (Variable Name) Codes—opens a list of diagnostic trouble codes in ECM • Selecting the Freeze Frame Data icon (Figure 4-12), displays a snapshot of the memory. -
Page 52: Code Scan (With Vehicle System Report)
Scanner Code Scan (with Vehicle System Report) 4.28 Code Scan (with Vehicle System Quick reference indicators are used to show system code status (Figure 4-13): - Green icon “a” mark - No Codes Report) - Yellow Triangle icon “!” mark - Codes are present Systems Code list with totals - A categorized system list with code totals is •... - Page 53 Scanner Code Scan (with Vehicle System Report) Figure 4-17 OBD-II code results NOTE Figure 4-15 Expand/Collapse Icon (expanded view) Some 2005 to 2008 vehicles may not display global OBD-II information in the Code Scan list. A message will be displayed to inform you the OBD-II - codes Diagnose Icon - (Figure 4-16) Selecting Diagnose opens Intelligent...
-
Page 54: Saving The Vehicle System Report
Scanner Code Scan (with Vehicle System Report) 4.28.4 Printing the Vehicle System Report Quick reference indicators are used to show monitor status. - Green icon “a” mark - Monitor test is complete Before you can print you must install a printer and have a current version of Adobe - Grey icon “—”... -
Page 55: Clear All Codes Read By Code Scan
Scanner Data (Viewing PIDs) Figure 4-19 3. Select and open the Vehicle System Report PDF file from the list. Figure 4-21 4. From the PDF viewer use the menu or toolbar print options to print the file 4. From the PDF viewer use the menu or toolbar print options to print the file (Figure 4-20). -
Page 56: Data Screen Overview
Scanner Data (Viewing PIDs) NOTE On some models, the engine must be started or cranked before data can be displayed. For these models, a “Waiting to Communicate” message displays if the engine was not cranked or started. Expand/Collapse Icon PID Name/Description - Descriptive name of the parameter ID 4.29.1 Data Screen Overview PID Current Value - The PID Current Value can display as a value or as a status. - Page 57 Scanner Data (Viewing PIDs) Use gesture scrolling (up/down) to quickly move through each data list Data Display Options (Figure 4-25). PIDs can be displayed in different views (Figure 4-26). Figure 4-25 Figure 4-26 List View Split View Full Screen Graph Multi-Graph View...
- Page 58 Scanner Data (Viewing PIDs) List View Split View List View is the default view mode and displays all PIDs in list (text) format To view one or more PIDs as a graph (Figure 4-28) from the list view, select the (Figure Expand/Collapse icon.
- Page 59 Scanner Data (Viewing PIDs) Multi-Graph View Full Screen Single Graph View To view more than one PID in a multi-graph display (Figure 4-29), select the PID To view a single PID graph in full screen (Figure 4-30), select the PID Expand/Collapse icon to open each PID in graph display you want to include, then Expand/Collapse icon to open the PID in graph display, then select Graph View select Graph View from the toolbar.
- Page 60 Scanner Data (Viewing PIDs) Data Toolbar Custom The Data toolbar contains a number of icons that allow you to configure the Custom is used to set which PIDs are displayed. Minimizing the displayed data and to exit: number of PIDs displayed allows you to focus on specific data and may increase the data transmission rate from the vehicle.
- Page 61 Scanner Data (Viewing PIDs) Keep the following in mind when configuring a custom data list: 3. Select Save. Gesture scroll if the list of parameters is longer than what is shown on the Alarm indicators now appear next to the selected parameters in the Data List –...
- Page 62 Scanner Data (Viewing PIDs) Properties Graph View Properties is used to configure (all) graph color, settings, samples Graph View allows you to display up to 16 graphs (Figure 4-34). To after trigger, and sweep (Figure view more than one PID in a multi-graph display, select the PID 4-33).
- Page 63 Scanner Data (Viewing PIDs) Save Print Save is used to record PID data. Saved files can be helpful when trying Printing / Printer Setup on page 19. to isolate an intermittent problem or to verify a repair during a road test. To save PID data: Scale Select Save.
- Page 64 Scanner Data (Viewing PIDs) Data Controls Toolbar Sweep Whenever communication is established with a vehicle, the Scanner continuously Sweep allows you to display/hide the graph sweep values, displayed collects data transmitted by the ECM in the data buffer. The Data Toolbar below the graphs (Figure 4-37).
-
Page 65: Using Triggers
Scanner Data (Viewing PIDs) 4.29.2 Using Triggers Icon Description Record/Play Trigger Description and Status Icons Starts or resumes data collection. Setting PID triggers allows you to configure the diagnostic tool to automatically save PID data to a file, when a PID value meets an upper/lower limit (trigger point). Clear When a PID value meets the trigger point it activates the trigger which captures a Erases the data buffer. - Page 66 Scanner Data (Viewing PIDs) To turn a trigger on, and set upper/lower trigger limits: PID Trigger Status Icons 1. Select the Menu icon on the PID you want to set a trigger on. The icons (below) are used to help you quickly identify the status of individual PID 2.
- Page 67 Scanner Data (Viewing PIDs) Upper and lower trigger limit lines (red) are displayed on the graph. 7. To arm the trigger, see Trigger Arming/Disarming on page 61. NOTE Minimum scale setting must be less than the maximum scale setting: Figure 4-43 Typical - Trigger upper/lower limit lines To use Autoscale or set the scale manually: Autoscale On - The graph scale (vertical axis range) is automatically adjusted based upon the minimum and maximum PID values.
- Page 68 Scanner Data (Viewing PIDs) About Activated Triggers Trigger Arming/Disarming A trigger is activated (displays red flag) when a PID value meets an upper/ Arming - arms all triggers to record data if a trigger is activated. lower limit (trigger point). Disarming - prevents all triggers from activating.
-
Page 69: Functional Tests
Scanner Functional Tests 4.30 Functional Tests Selecting a Functional Test opens the test. A typical test includes on-screen instructions (Figure 4-47) followed by a test screen (Figure 4-48) that provides a The Functional Tests selection is used to access vehicle-specific subsystem and changeable value or switch that is manually entered or actuated on-screen and a guided component tests. -
Page 70: Functional Resets And Procedures
Scanner Generic Functions Typical OBD-II/EOBD tests and functions include: Icon Description MIL Status - displays the ID and status of the Malfunction Indicator Lamp (MIL) • Change List ® Fast Track Troubleshooter - displays a menu of available experience-based • Allows you to switch data lists. -
Page 71: Troubleshooter
Scanner Troubleshooter 4.32 Troubleshooter 4.33 Demonstration Modes ® Fast-Track Troubleshooter is a database of experience-based information of Two training (demonstration) modes are provided to help you to become familiar validated real-world repair strategies that have been compiled by top-notch with Scanner functions: technicians. - Page 72 Scanner Scanner Demonstration (Introduction to Intelligent Diagnostics) Vehicle Identification Choosing a vehicle system opens the main menu for that system, which provides options for you to analyze and interact with that system. You can The first process in communicating with any vehicle is identifying the vehicle. The choose to scan for DTCs, clear DTCs, view parameter data (PIDs), perform following walk-through will guide you though this process using the Scanner functional tests and more.
- Page 73 Scanner Scanner Demonstration (Introduction to Intelligent Diagnostics) Figure 4-50 Intelligent Diagnostics Demo Welcome Figure 4-52 4. As the demo continues, navigational hints and code-specific features are 6. Select the code noted on previous screen to continue (Figure 4-53). described (Figure 4-51).
- Page 74 Scanner Scanner Demonstration (Introduction to Intelligent Diagnostics) 7. The Intelligent Diagnostics main menu opens (Figure 4-54). Descriptions are 8. Select any card (e.g. Technical Service Bulletins, Smart Data, Real Fixes, etc.) provided for the various options, select “GIVE IT A TRY” to continue. to learn more about the code-specific information that is provided.
-
Page 75: Section 5: Intelligent Diagnostics
Intelligent Diagnostics Section 5 Introduction 5.35 Main Topic Links Accessing Intelligent Diagnostics page 68 • NOTE Main Menu and Basic Navigation page 69 • Code Results Dropdown Menu page 70 Intelligent Diagnostics is not supported on U.S. (United States) and AU •... -
Page 76: Main Menu And Basic Navigation
Intelligent Diagnostics Main Menu and Basic Navigation 5.37 Main Menu and Basic Navigation Intelligent Diagnostics information modules are contained in one multi-card main menu. This allows you to easily select a card (e.g. Technical Bulletins, Smart Data, Real Fixes, etc), view the data and then quickly return to the main menu to open another card. -
Page 77: Code Results Dropdown Menu
Intelligent Diagnostics Code Results Dropdown Menu Intelligent Diagnostics Navigation Basic navigation is accomplished by selecting the desired menu card. Use the Back icon (shown in 5-4) to navigate back to the Figure 5-3 Figure previous screen. To expand a card to full size, select anywhere in the card (Figure 5-3). -
Page 78: Top Repairs Graph
Intelligent Diagnostics Top Repairs Graph 5.39 Top Repairs Graph 5.40 Technical Bulletins (OEM Information) The Top Repairs Graph (Figure 5-7) shows the most common verified fixes using The Technical Bulletins card (Figure 5-8) provides a quick link to OEM Recall, TSB the parts listed. -
Page 79: Smart Data
Intelligent Diagnostics Smart Data Figure 5-11 Selecting the Smart Data List (Figure 5-12) opens the custom code-specific PID list (Figure 5-13). Figure 5-10 TSB example 5.41 Smart Data Smart Data filters out all non-relevant PIDs and shows you a custom list of PIDs Figure 5-12 only related to the selected code. -
Page 80: About Prearmed Smart Data Pids
Intelligent Diagnostics Functional Tests and Reset Procedures 5.42 Functional Tests and Reset Procedures Selecting the Functional Tests and Reset Procedures card (Figure 5-14) opens the Tests main menu (Figure 5-15), which displays a list of bi-directional tests and procedures related to troubleshooting the selected codes. Functional tests and reset procedures allow you to manually control certain component operations (e.g. -
Page 81: Guided Component Tests (Gcts)
Intelligent Diagnostics Guided Component Tests (GCTs) 5.43 Guided Component Tests (GCTs) Selecting the Guided Component Tests card (Figure 5-16) opens the Components Tests main menu (Figure 5-17), which displays a menu list of tests related to the troubleshooting of the selected codes. Figure 5-18 Intelligent Diagnostics Guided Component Tests operation and navigation is similar Guided Component Tests are tests with step-by-step instructions... - Page 82 Intelligent Diagnostics Guided Component Tests (GCTs) Figure 5-21 Figure 5-20 For GCT upper toolbar control icon descriptions, see Scope/Meter (Upper) Toolbar on page 101. For Scope/Meter toolbar control descriptions, see Record/Playback Control Toolbar on page 123. Selecting Component Information (if available) provides details on specific vehicle components to provide a better understanding of the components prior to diagnosis.
-
Page 83: Real Fixes
Intelligent Diagnostics Real Fixes 5.44 Real Fixes 5.45 Tips Select the Real Fixes card (Figure 5-22) to view a list (Figure 5-23) of code-specific Select the Tips card (Figure 5-25) to view a list (Figure 5-26) of code-specific tips procedures and tests that have been gathered from actual shop repair orders. gathered from industry professionals. -
Page 84: Section 6: Obd Direct
OBD Direct Section 6 Introduction 6.47 Main Menu Selecting OBD Direct from the Home screen opens a menu with two options This section describes the basic operation, and navigation of the (Figure 6-1): OBD Direct function. OBD Diagnose - provides access to available OBD vehicle readiness •... - Page 85 OBD Direct OBD Diagnose The communication protocol being used Readiness Monitors – Which ECM is actively communicating – Selecting Readiness Monitors provides the following menu options: Vehicle Identification Number (VIN) – Monitors Complete Since DTC Cleared—displays the results of all monitor •...
- Page 86 OBD Direct OBD Diagnose OBD-II Modes Name Description ($09) OBD-II Modes include emission related data and tests supported by the vehicle In-use Displays the “In-use Performance Tracking” of monitored data (total manufacturer. Vehicle manufacturers are not required to support all modes. Performance number of times each monitored test has completed).
-
Page 87: Connector Information
OBD Direct OBD Health Check 6.49 OBD Health Check 6.48.2 Connector Information Selecting Connector Information provides you access to vehicle data link connector The OBD Health Check option is intended as a time-saver, allowing you to quickly (DLC) location information. access a few key global OBD-II services. -
Page 88: Global Obd Ii Clear Codes
OBD Direct OBD Health Check Pending Codes Pending Codes enables the scan tool to obtain “pending” or maturing diagnostic trouble codes. These are codes whose setting conditions were met during the last drive cycle, but need to be met on two or more consecutive drive cycles before the DTC actually sets. -
Page 89: Section 7: Guided Component Tests
Guided Component Tests Section 7 Introduction 7.50 Safety Information Selecting Guided Component Tests provides you with an extensive collection of vehicle specific component tests and reference information for engine, transmission, ABS, charging, transfer case, Risk of electrical shock. and suspension systems. It is like having access to a complete •... -
Page 90: General Information
Guided Component Tests General Information 7.51 General Information 7.51.1 Configuring the Favorites List Once a Guided Component Test database is loaded, a list of manufacturers displays. This list is often long and includes makes that are not frequently used. A toolbar at the top of the screen allows you to custom configure the manufacturer list to display only the makes you frequently service. -
Page 91: Menu Icon
Power User Tests: information. Current Probe Tests - provides common tests configured to use the Snap-on • Low Amp Current probes or generic Low Amp Current probes. Snap-on Low Amp Current Probe operation information is also provided within the Snap-on Low Amp Probe Reference Manual option. - Page 92 Menu • Parasitic Draw options may include: • Snap-on Low Amp Probe Reference Manual 10-minute Electronic Classes—provides basic electrical theory and testing • Two Channel Tests - provides common tests configured to measure or compare •...
-
Page 93: Vehicle Identification
20-minute Current Ramp Classes—provides an introduction to current ramp • testing using the Snap-on Low Amp Current Probes. Snap-on Low Amp Once the vehicle is identified, a menu displays available systems and components Current Probe operation information is also provided within the Snap-on Low to test. -
Page 94: Tests
Guided Component Tests Tests 7.53 Component Information 7.54 Tests Component Information provides specific operational information (if available) on Tests provide specific instructions (if available) to help you perform tests on the selected component, and may also include electrical connector and pin location components. -
Page 95: View Meter
Guided Component Tests Tests 7.54.1 View Meter View Meter opens a live meter set up to perform the test in the lower portion of the screen (Figure 7-7). Once the meter view is open, the Guided Component Test toolbar at the top of the screen is replaced by the Scope Multimeter toolbar, which allows you to make adjustments to the settings. -
Page 96: Section 8: Scope And Multimeter Operations
Scope and Multimeter Operations Section 8 Introduction Trigger Setup Menu page 102 • Safety page 89 • Saving and Reviewing Scope / Multimeter Data Files page 122 This section describes the basic operation and navigation of the • Scope Multimeter function. Setup Menu (Preferences) page 101 •... -
Page 97: Measurement Out Of Range Indicator
Scope and Multimeter Operations Getting Started 8.57 Getting Started 8.56.1 Measurement Out of Range Indicator A group of arrows display when a measurement is out of range for the scale Use the following procedure to open a scope multimeter function. selected: To start the scope multimeter: Arrows pointing UP—measurement over maximum range... -
Page 98: Technical Specifications (Scope Module)
Scope and Multimeter Operations Technical Specifications (Scope Module) 8.58 Technical Specifications 8.59 Component Locations (Scope Module) Item Description / Specification USB Power 5V @ 500mA (supplied by diagnostic tool) Agency Approval - Rating IEC 61010-1, UL Listed 61010-1 - Category 1 Width 6.3 in. -
Page 99: Tests And Capabilities (Quick Reference)
Scope and Multimeter Operations Technical Specifications (Scope Module) 8.60 Testing Capabilities Test Function Selecting Scope Multimeter provides the following options (select topic to link to Measures electrical resistance (opposition to current) 0 section): to 4 M Ohms. Scope supplied DC current is passed Digital Multimeter (DMM) Ohms •... -
Page 100: Digital Multimeter (Dmm)
Scope and Multimeter Operations Technical Specifications (Scope Module) 8.60.2 Digital Multimeter (DMM) Test Function The digital multimeter gives you the ability to quickly make precise common electrical measurements (e.g. DC and AC voltage, resistance and amperage) on Used to measure pressures for typical systems such as, circuits and components to verify operation. -
Page 101: Graphing Multimeter (Gmm)
Scope and Multimeter Operations Technical Specifications (Scope Module) 8.60.3 Graphing Multimeter (GMM) GMM Specifications Unlike the DMM, the graphing multimeter plots a visual graphing line of the signal Function Range Accuracy/Comments instead of displaying digital values. The GMM displays a signal’s measurements Ch. -
Page 102: Lab Scope
Scope and Multimeter Operations Technical Specifications (Scope Module) 8.60.4 Lab Scope Lab Scope Specifications Similar to the GMM, the lab scope (oscilloscope) plots a visual image line of a Function Range Accuracy/Comments signal’s measurements over time on a two-dimensional grid. The visual line that is Ch. -
Page 103: Ignition Scope (Secondary Ignition Tests)
Scope and Multimeter Operations Technical Specifications (Scope Module) 8.60.5 Ignition Scope (Secondary Ignition Tests) • VW/Audi (COP-3) • Acura/Honda/Isuzu (COP-4) The following options are available for secondary ignition testing: • Volvo/BMW (COP-5) Parade • • Mercedes-Benz (COP-6) Cylinder • • Mercedes-Benz Dual Type (COP-7) Raster •... -
Page 104: Presets
Scope and Multimeter Operations General Instructions 8.61 General Instructions 8.60.6 Presets Selecting Presets opens a menu of pre-configured tests (Figure 8-4). Presets are 8.61.1 Test Lead / Probe Connection tests set up with pre-configured control settings for common component tests. In addition to the built-in presets, you can create your own custom test Standard “safety type”... -
Page 105: Using The Scope Module Remotely
Scope and Multimeter Operations General Instructions 8.61.2 Using the Scope Module Remotely To setup the Scope Module for remote operation: 1. Depress the Scope Module release tab located on the top of the diagnostic tool If needed, the Scope Module can be removed from the diagnostic tool, then (Figure 8-6). -
Page 106: Pairing And Hardware Status Icons
Scope and Multimeter Operations General Instructions 8.61.3 Pairing and Hardware Status Icons Hardware Status Icons The hardware status indicators in the lower-right corner of the Home screen provide When the Scope Module is connected (docked or USB cable), it automatically pairs a quick reference to connection status. -
Page 107: Main Screen And Toolbars
Scope and Multimeter Operations Main Screen and Toolbars During an ohms test or a pressure test, a manual probe recalibration can be initiated by selecting the Calibration icon from the Control Panel (Figure 8-11). Icon Calibrated graphic of a balance scale Not Calibrated graphic of a balance scale with an “X”... -
Page 108: Scope/Meter (Upper) Toolbar
Scope and Multimeter Operations Setup Menu (Preferences) 8.62.1 Scope/Meter (Upper) Toolbar 8.62.2 Main Body of the Screen The Scope/Meter toolbar is used to set up the tool for testing and to configure the The main body of the screen varies depending on what display options have been settings for each trace. -
Page 109: Trigger Setup Menu
Scope and Multimeter Operations Setup Menu (Preferences) 8.63.2 Trigger Setup Menu Triggers on page 118.‘ 8.63.3 View Controls Use the view controls to set display attributes. To adjust view controls: 1. Select Setup from the Scope Multimeter toolbar. The Scope Multimeter Preferences dialog box opens. 2. - Page 110 Scope and Multimeter Operations Setup Menu (Preferences) Show Digital KV—available only in ignition scope, displays digital kilovolt Display Settings • readings, rather than waveforms, on the screen (Figure 8-16). Selecting Display from the View submenu opens the Display dialog box (Figure 8-14).
- Page 111 Scope and Multimeter Operations Setup Menu (Preferences) Layout Settings The selected radio knob on the Layout dialog box shows which setting is active. Use your finger or the stylus to switch between settings: 1 window—shows all traces on the same screen (Figure •...
- Page 112 Scope and Multimeter Operations Setup Menu (Preferences) Trace Setup Trace Per Division - changes the dropdown vertical scale menu selections to ##/div mode, which in turn changes the vertical scale to represent ## by division. The Trace Setup option allows you to change how the vertical scale menu selections are represented.
-
Page 113: Setup Controls
Scope and Multimeter Operations Setup Menu (Preferences) Display Settings The Display setting allows you to change the displayed value in the Vertical Scale icon to your preference. NOTE This setting ONLY changes the value displayed in the Vertical Scale icon. Display Full Scale - displays the value of the entire (full) scale Example (Figure... - Page 114 Scope and Multimeter Operations Setup Menu (Preferences) Units Snapshot Selecting Units opens the Setup dialog box. The units of measurement can be The Snapshot tab opens a menu (Figure 8-27) that allows you to select how much changed between US customary or metric. The selected radio knobs on the Setup data is captured after a snapshot is initiated.
-
Page 115: Control Panel And Settings
Scope and Multimeter Operations Control Panel and Settings On a Standard or Direct system, choose between Coil and Plug for the Ignition – Number 1 Trigger. The Ignition tab of the Setup dialog box is used to configure the scope for displaying On a waste Spark system, select the polarity of the firings using the +, –, and –... -
Page 116: Display Modes
Scope and Multimeter Operations Control Panel and Settings 8.64.1 Display Modes Control Panel Off— the control panel is not displayed, only the meter screen • is shown (Figure 8-31) The control panel has three display modes, and can be be changed by repeatedly selecting the Expand/ Collapse icon from the Playback/Record toolbar, or the Data icon on the toolbar. -
Page 117: Control Panel (Trace Controls Quick Reference)
Scope and Multimeter Operations Control Panel and Settings 8.64.2 Control Panel (Trace Controls Quick Reference) Trace (channel) settings and controls can be accessed in the Control Panel and the Trace Setup menu. Graphic and value icons are used in the control panel to access the settings. -
Page 118: Channel Icon
Scope and Multimeter Operations Control Panel and Settings 8.64.4 Channel Icon Probe “test” Options The Channel icons (variable) identify the channel numbers (1 to 4). Menu Option Probe / Device Used Selecting an icon opens the trace setup menu. See Trace Controls Menu Standard Channels 1 to 4 test leads with on page 101. -
Page 119: Filter Icon
Scope and Multimeter Operations Control Panel and Settings 8.64.7 Filter Icon NOTES — Turning peak detect “off” is suitable for basic measurements, and viewing Depending on which function it is used with, Filter can minimize or smooth waveforms (e.g. oxygen (O2) or Cam sensor) when capturing fast events is out signal spikes and fast variations, when the signal is disrupted by noise not necessary. -
Page 120: Invert Icon
Scope and Multimeter Operations Control Panel and Settings 8.64.8 Invert Icon 8.64.10 Slope (Trigger) Icon on page 119 for additional information. Trigger Operation Invert is used to switch signal polarity, so the trace appears upside down (inverted) on the screen. This is typically used when measuring amperage 8.64.11 Scale (Vertical / Y-axis) using the low amp probe, or high-voltage signals like secondary ignition. -
Page 121: Sweep Scale (X-Axis)
Scope and Multimeter Operations Control Panel and Settings 8.64.12 Sweep Scale (X-axis) Example: Selecting 50 psi displays a 50 psi scale that is divided by 10, therefore each division is incremented by 5 psi. The Sweep Scale or horizontal scale (X-axis) represents time, and the unit of measurement it is being measured in. -
Page 122: Min, Live And Max Display Panel
Scope and Multimeter Operations Control Panel and Settings 8.64.13 Min, Live and Max Display Panel 8.64.14 Zero Baseline Adjustment When using Expanded mode the Min, Live and Max display panel (Figure To adjust the vertical position of the zero baseline (0 value) of a trace, either touch 8-30) shows each channel’s active signal minimum and maximum recorded and drag the baseline marker up/down on the screen... - Page 123 Scope and Multimeter Operations Control Panel and Settings (calculated from the Min and Max measurements) to be used as a reference point to calculate the measurement. The falling edge (slope) of the signal is used in determining the threshold level. Once selected, the Threshold function remains active until the test is exited.
- Page 124 Scope and Multimeter Operations Control Panel and Settings In some instances a signal with unequal spacing may display as a band or ragged signal, depending on the sweep setup or the measurement type being displayed. As example, a Cam sensor signal Hz graph (shown in 8-43) may look like Figure this with a lot of variation.
-
Page 125: Triggers
Scope and Multimeter Operations Triggers 8.65 Triggers 8.65.1 Trigger Setup Menu To access the trigger setup menu: Triggers are only available in the lab scope function. Select the Trigger Setup Menu icon from the control panel, or • A trigger can be used to stabilize a changing or erratic signal (a signal that may from the upper toolbar select Setup >... -
Page 126: Trigger Operation
Scope and Multimeter Operations Triggers 8.65.2 Trigger Operation Trigger Auto/Manual NOTE Trigger Slope Icons The Auto and Manual Trigger modes allow you to set the criteria used to Trigger slope icons are displayed in the control panel. display signals on the screen. To change the trigger mode, the trigger must be set on one of the channels. -
Page 127: Cursors
Scope and Multimeter Operations Triggers 8.65.3 Cursors Setting Trigger Position To set trigger position: Cursors are only available in Lab Scope and Graphing Multimeter functions. The trigger marker is indicated by a plus graphic (+) on the display (Figure 8-46). The trigger marker represents the trigger point and is displayed on the screen when Two vertical cursors are provided that allow you to make precise signal the trigger is turned on. - Page 128 Scope and Multimeter Operations Triggers To turn the cursors on/off: Difference (delta) in time between the cursors • 1. Select Cursors (upper toolbar to open the Cursors dialog box (Figure Frequency - frequency of the signal for the time period between cursor 1 and 2 8-48).
-
Page 129: Saving And Reviewing Scope / Multimeter Data Files
Scope and Multimeter Operations Saving and Reviewing Scope / Multimeter Data Files 8.66 Saving and Reviewing Scope / The most recent data is always available for review when the scope is stopped, and can be reviewed using the toolbar controls. Multimeter Data Files 8.66.2 Saving Data Files / Configurations The following sections describe how the Data Buffer operates and the procedures... -
Page 130: Record/Playback Control Toolbar
Scope and Multimeter Operations Saving and Reviewing Scope / Multimeter Data Files 3. Enter the name of the file and location where it is to be saved, then select Name Icon Description Save. A configuration description dialog box will open. Plays the data recording in a continuous loop at Play Recording actual speed... -
Page 131: Snapshot Icon
Scope and Multimeter Operations Saving and Reviewing Scope / Multimeter Data Files To stop and review a data file: Snapshot (% after trigger options) Playback control icons are described in To set the amount of data captured after a snapshot is initiated: Record/Playback Control Toolbar page 123. -
Page 132: Using The Zoom Function
Scope and Multimeter Operations Saving and Reviewing Scope / Multimeter Data Files 8.66.6 Using the Zoom Function When the Zoom icon is selected (Figure 8-53) the display defaults to the "Max" magnification level and a dropdown scroll menu will display. The zoom function allows you to change the magnification level of the signal sweep during data review. -
Page 133: Test Leads And Accessories
Scope and Multimeter Operations Test Leads and Accessories NOTE To quickly identify a glitch in a pattern, it may be easier to initially view the waveform at a higher magnification level (e.g. 256X or "Max") to display the entire captured waveform, then lower the zoom level to 8X or 2X to review in detail. -
Page 134: Channel 1 Lead
Scope and Multimeter Operations Test Leads and Accessories 8.67.1 Channel 1 Lead 8.67.3 Channel 3 Lead The shielded yellow lead is used with channel 1, and is color matched with the channel 1 jack on the diagnostic tool. Figure 8-59 Blue Channel 3 lead The non-shielded blue lead (Figure 8-59) is used for either Channel 3 or Digital... -
Page 135: Secondary Ignition Coil Adapter Lead And Clip-On Adapter (Optional)
Scope and Multimeter Operations Test Leads and Accessories 8.67.6 Secondary Ignition Coil Adapter Lead and Clip- a waveform or display RPM. With the Ignition Scope, the RPM Pickup connects to cylinder number one to establish the firing order. on Adapter (optional) The secondary ignition adapter lead can be used with the secondary ignition clip-on 8.67.8 Low Amp Current Probe (optional) wire adapter, coil-in-cap (CIC), or coil-on-plug (COP) secondary ignition adapters to... -
Page 136: Pressure Transducers And Adapters (Optional)
Scope and Multimeter Operations Test Leads and Accessories 8.67.10 Pressure Transducers and Adapters (optional) 8.67.11 Waveform Demonstration Tools (optional) Different pressure transducers and adapters are available for measuring positive To help you sharpen your lab scope and graphing multimeter skills, optional and negative gas and liquid pressures. -
Page 137: General Reference
Scope and Multimeter Operations General Reference 8.68 General Reference After answering the previous questions (at a minimum), you need to determine which Scope / Multimeter test function you are going to use (e.g. Lab Scope, DMM or GMM). See Tests and Capabilities (Quick Reference) on page 92. -
Page 138: Using Known Good Waveforms
• Control Panel and Settings on page 108. Try different test leads, to verify the issue. Use the recommended snap-on • leads or probes available for the diagnostic tool or equivalent. Shielded test At this point you should have a signal displayed that will allow you to see the overall leads are recommended. -
Page 139: Units Of Measurement / Conversions
Scope and Multimeter Operations General Reference 8.68.4 Units of Measurement / Conversions Pressure Units (Symbol) / Description Equivalents Base Units 1 psi = 6894.757 Pa (Symbol) / Unit Prefix Typical Expressions (psi) pounds per square inch 1 psi = 0.06894757 bar 1 psi = 2.036021 inHg (µ) micro 0.000001 or 10... - Page 140 Scope and Multimeter Operations General Reference Temperature Units (Symbol) / Description Conversions (°C) degree Celsius °C = 0.556 x (°F - 32) (°F) degree Fahrenheit °F = (1.8 x °C) + 32 Time Units (Symbol) / Description Equivalents (µs) microsecond 1 µs = 0.000001 of a second (ms) millisecond 1 ms = 0.001 of a second...
-
Page 141: Glossary Of Common Terms
Scope and Multimeter Operations General Reference 8.68.5 Glossary of Common Terms Term / Abbreviation Description The number of times a signal repeats in one Frequency Term / Abbreviation Description second. Measured in Hertz (cycles per second). Alternating Current - electrical current that An intermittent or unwanted, error in a signal that Glitch switches polarity at regular intervals. - Page 142 Scope and Multimeter Operations General Reference Term / Abbreviation Description Term / Abbreviation Description The RMS (root mean square) value of The vertical scale on the grid or (y-axis) alternating currents and voltages is the effective represents what is being measured (voltage, Vertical Scale current or voltage applied, rather than the peak amperage, pressure etc.), and the unit of...
-
Page 143: Section 9: Information
(Figure 9-1) will be displayed Battery connection and initialization information • as a reminder to keep your software current and retain your Snap-on Information Component specifications • access. Selecting OK will close the message and selecting Snooze 1 Week will Component operation/theory information •... -
Page 144: Connection
Getting Started Getting Started 9.1.1 Connection To use the Snap-on Information service, you must have a strong Wi-Fi connection 9.2.1 Vehicle Identification and access to the Internet. Internet access is required to connect to the exclusive online Snap-on Information site. To set up your Wi-Fi connection, see... -
Page 145: The Snap-On Information Application
Engine Details – A vehicle confirmation screen is displayed. 3. Select OK or Cancel to continue. Selecting OK from the confirmation screen, opens the Snap-on Information application. Vehicle Section Toolbar Functions Toolbar functions from the vehicle selection screen, are as follows: Back—allows you to return to the previous screen... - Page 146 Tax (VAT) rates to your preferences (used with cost estimating feature). About—Displays the Snap-on Information service license expiration date. • Terms of Service (“TOS”) —Displays the Snap-on Information service end - • user license agreement. Converter The Converter function...
- Page 147 Information The Snap-on Information Application After selecting the vehicle make, the Vehicle Base Model screen displays (Figure 9-7). 2. Select the vehicle base model from the list. Figure 9-8 Vehicle Model Option Screen Show ID Location icon—select to view the location of the vehicle ID Base Model Selection (specific)—select the specific base model by engine type,...
- Page 148 Information The Snap-on Information Application 4. If needed, select the Show ID Location icon, to access visual help information A list of the last ten vehicles selected is displayed. Vehicle records that include to find the location of vehicle identification numbers (Figure work orders are displayed with the work order number.
-
Page 149: Overview
Information Overview Overview 9.4.1 Fault Code Search A search feature, is provided to help you quickly find vehicle specific DTC reference The Overview screen is a summary display of all available vehicle information, and and related diagnostic information. includes multiple tab panels and functions (Figure 9-12). - Page 150 Information Maintenance Schedule Guidance - (Figure 9-14) Important notes and guidelines about the Maintenance Procedures - (Figure 9-16) Instructions for common • • available schedules. maintenance procedures. Figure 9-14 Figure 9-16 Service Indicator Reset - (Figure 9-15) Indicator reset procedures. •...
-
Page 151: Repair Data
Information Repair Data Repair Data Adjustment Data - (Figure 9-19) General information and common vehicle • maintenance and repair specifications Selecting Repair Data, displays a submenu of all available vehicle repair information by system. Submenu options may include the following systems (Figure 9-18): Engine... - Page 152 Information Repair Data Create a custom cost estimate: The selected job is added to the summary at the top of the page (Figure 9-22). 1. Choose the applicable system (Figure 9-20) from the menu to display job options. Figure 9-22 Figure 9-20 3.
- Page 153 Information Repair Data The Cost Estimate form displays (Figure 9-24). NOTE To remove a job select the X mark. 4. Enter the “Parts Required” unit price and “Quantity” as needed (Figure 9-23). Select the + mark when finished. 5. When completed, select Add to Cost Estimate or Add to Work Order Enter vehicle and (Figure 9-23).
-
Page 154: Electronics
Information Electronics 6. Fill in all customer and vehicle information fields as required (Figure 9-24). 7. In the Jobs section of the form, select the applicable shop labour rate from the dropdown box (Figure 9-24). NOTE You may set up to three custom labour rates. To setup shop labour rates, select the Settings dropdown box from the main screen and then select Preferences. -
Page 155: Electronic Systems
Information Electronics 9.7.1 Electronic Systems The Electronics main screen feature locations are shown in the following illustration (Figure 9-26). Electronic Systems can provide you with a summary of vehicle specific electronic systems diagnostic and reference data, by using selected filtering based on vehicle features and components. - Page 156 Information Electronics The Electronic Systems screen is displayed (Figure 9-28). This screen includes the Components following function tabs: The Components screen (Figure 9-29) provides detailed component diagnostic Components • and reference information. CAN-Bus Overview • Selecting the Components tab displays: Fault Code Diagnosis •...
- Page 157 Information Electronics CAN-Bus Overview The CAN-Bus Overview screen (Figure 9-30) provides detailed information about the components used on each Bus. A basic diagram of each Bus is provided to display the connected components/circuits contained within each Bus. Each ECU pin and connec Initialisation procedures component on the Bus diagram is selectable and linked to its own individual component information diagnostic screen.
- Page 158 Information Electronics Fault Code Diagnosis Locations Fault Code Diagnosis allows you to search (Figure 9-31) for a specific DTC, and Locations allows you to quickly pick or search for specific component location. view related component information for diagnostic purposes. Components are categorized in the left menu panel and results are shown in the main screen (Figure 9-32).
-
Page 159: Fuses And Relays
Information Electronics 9.7.2 Fuses and Relays 9.7.3 Locations This feature provides vehicle specific fuse, relay and related power distribution The Locations features provides vehicle specific electrical component location component location information (Figure 9-33). Descriptive and visual (e.g. information. Descriptive and visual (e.g. diagrams and schematics) reference may diagrams and schematics) reference may be provided. -
Page 160: Electronic Procedures
Information SmartPACK™ SmartPACK™ 9.7.4 Electronic Procedures Electronic Procedures provides vehicle specific procedures for battery Selecting the SmartPACK tab, displays a tab summary view of all available vehicle disconnection/connection, and reinitialization of electrical components or systems TSB’s, Recalls and SmartCASE™ diagnostic and testing information. Each after battery connection. -
Page 161: Smartcase
Information SmartPACK™ 9.8.1 SmartCASE SmartCASE is OEM-based technical (troubleshooting and repair) data for most European and Asian vehicles, sourced from industry experts. The data provided clearly describes technical problems, their causes and suggested solutions including verified fixes and tips. Select a SmartCASE topic from the list of available topics to view detailed information about the problem including symptoms, causes, and solutions (Figure 9-37). -
Page 162: Recall Data
Information SmartPACK™ 9.8.2 Recall Data 9.8.3 Technical Service Bulletins Recall Data is OEM provided vehicle specific safety recall information. Each recall Technical Service Bulletins (TSB’s) are OEM provided vehicle specific service record includes a description of the defect and the required solution. information. -
Page 163: Section 10: Vehicle History
Vehicle History Section 10 Introduction 10.9 Vehicle Records List The Vehicle Records List screen (Figure 10-1) lists all of the available vehicle Selecting Vehicle History allows you to manage and retrieve records. vehicle records, for vehicles that have been previously identified. You can also reactivate a vehicle, eliminating the need identify a vehicle again when performing a retest after repairs have been made. -
Page 164: Toolbar Icon Functions
Vehicle History Toolbar Icon Functions 10.10.1 Activate To resize a column: 1. Select the line separating two columns. Select Activate to activate a vehicle for use in other functions (e.g. Scanner, A line with arrowheads appears to show the column is ready for resizing. Guided Component Tests, etc.). -
Page 165: Delete
Vehicle History Toolbar Icon Functions 10.10.4 Manage Select Manage to quickly remove individual records, or all the vehicle records from the vehicle records list. Highlight the record to remove, then select Delete, or use the Select All or Deselect All options to remove all records (Figure 10-3). -
Page 166: Settings
Vehicle History Toolbar Icon Functions 10.10.6 Settings Use Settings to determine which categories display on the vehicle records list. To change vehicle record list settings: 1. Select Settings to open the menu (Figure 10-4). Figure 10-4 2. Select or deselect the desired categories: Highlighted items - display –... -
Page 167: Section 11: Data Manager
Data Manager Section 11 Introduction 11.11 Data Manager Screen Layout Selecting Data Manager opens the Data Manager screen displaying available file This section describes the basic operation, and navigation of the folders and a file viewer. This screen displays the contents of the Windows Data Manager function. -
Page 168: General Information
Data Manager General Information 11.12.3 Printing Files The folders panel may includes these folders: Camera Folder—contains photos taken with the built-in camera. See • Image Printing / Printer Setup on page 19. Viewer on page 164. CTM Data Folder—contains saved Guided Component Test data files. See •... -
Page 169: About Saved Folder/File Structure
Data Manager Toolbar Icon Functions 11.13 Toolbar Icon Functions 11.12.5 About Saved Folder/File Structure The Diagnostic Suite automatically creates folders to manage saved files. The table below describes the toolbar icons. Whenever 60 files are saved into any of the Data Manager folders, a new folder is created. -
Page 170: Email
Data Manager Toolbar Icon Functions 11.13.1 Email 3. A new e-mail message window will display onscreen (Figure 11-4). Selecting the Email icon from the Data Manager toolbar allows you to send a saved data or image file as an attachment using e-mail. To use this feature, you must install an e-mail client, and then either link your existing e-mail address to the client, or create a new address. -
Page 171: Vehicle System Report Viewer
Data Manager Vehicle System Report Viewer 11.14 Vehicle System Report Viewer 11.15 Image Viewer Code Scan (trouble code reports) are saved in .pdf format and are viewable by Screenshots and photos taken using the built-in camera are saved in .jpg format opening them from the Vehicle System Report Data Folder in the Data Manager and are viewable by opening them from the Screenshots and Images folders in the folder panel, or from within the Vehicle System Report Data folder in the Windows My... -
Page 172: Scanner Dataviewer
Data Manager Scanner DataViewer 11.16 Scanner DataViewer 11.16.1 Menu Bar The menu bar at the top of the screen contains the File, View, Tools, and Help Scanner data files are saved in a proprietary file format and are viewable by menus. - Page 173 Data Manager Scanner DataViewer b. Select OK to close the font dialog box. View Menu 3. Once all selections are made, select OK. The View menu allows you to change how data is displayed on the screen A print dialog box opens. (Figure 11-10).
-
Page 174: Display Toolbar
Data Manager Scanner DataViewer 11.16.2 Display Toolbar Properties dialog box selections include: Grid Lines—when selected, a line displays at each major division of the • The Display toolbar provides the following controls (Figure 11-12). graphs. Exit—closes Scanner DataViewer. • Display Item—use to view the display color of the listed items. Highlight an •... -
Page 175: Navigation Tools
Data Manager Scanner DataViewer 11.16.3 Navigation Tools Slider / Scroll Bars and Cursor Use the slider bar to quickly navigate through the data (Figure 11-15). During playback the number displayed on the left side of the slider bar indicates the current Playback Controls position of the cursor in the data file. -
Page 176: Customizing The Display
Data Manager Scanner DataViewer 11.16.4 Customizing the Display 11.16.5 Customizing the Parameter List The parameter text list (left side) displays parameter names and current values. The parameter configuration tabs allow you to choose between displaying all available parameters (Complete List), or only those from a (Custom List) The display can be customized by selecting and dragging parameters from the text (Figure 11-17). - Page 177 Data Manager Scanner DataViewer Toolbar - contains control icons Figure 11-18 Creating a custom parameter list Main Body - displays recorded trace results Controls Panel - contains the channel/trace settings 4. Select Save & Exit to close the window. Playback Control Toolbar - contains playback and display controls Only the parameters selected in your custom list are displayed.
-
Page 178: Section 12: Help
Help Section 12 Introduction 12.19 Toolbar Icons This section describes the basic navigation of the Help function. Icon Description Selecting Help from the Home screen opens this manual in a Back - Closes the manual and returns you to the previously dedicated viewer (Figure 12-1). -
Page 179: Page Navigation Controls
Help Page Navigation Controls 12.20 Page Navigation Controls The following navigation controls are provided on the top of each page of the user manual. They can be used in addition to the viewer controls in the toolbar. Icon Description Table of Contents Opens the Quick Links menu within the Table of Contents (TOC) section. -
Page 180: Section 13: System Settings
System Settings Section 13 Introduction 13.21 Paired Devices Selecting Paired Devices displays the active devices that are paired to the This section describes the basic operations of System Settings. diagnostic tool. To use the Compact Scan Module, and the Scope Module with the Selecting System Settings from the Home screen opens a menu diagnostic tool they must be paired to the diagnostic tool. -
Page 181: Shop Information
System Settings Shop Information 13.22 Shop Information 13.23 Data Backup Selecting Shop Information allows you to add personalized shop information that Selecting Data Backup from the Systems Settings main menu provides the can be included on printed data files. following menu options: Backup Settings (message) •... -
Page 182: Restore
System Settings Code Scan (Timestamp) NOTE Drive designations (e.g. E:, F: etc.), are only visible when external drives are connected to the diagnostic tool. Figure 13-4 The Windows restore backup file path dialog box opens. 4. Select the backup file (file extension .sna) from your backup file location. 5. -
Page 183: Section 14: Shopstream Update Tool (Sst)
ShopStream Update Tool (SST) Section 14 Introduction 14.1 Terminology This section describes the ShopStream Update Tool (SST), a maintenance The following terms are used in this section and throughout this manual as program that automatically keeps your diagnostic software up-to-date. described below: Software Upgrade - a new diagnostic software version. -
Page 184: Basic Operation
End User License Agreement is read. Use of the device acknowledges your acceptance of the End User License Agreement. The If necessary, select the expand arrow to see the SST icon in the Snap-on Incorporated Software End User License Agreement is available at: https://eula.snapon.com/diagnostics notification area. -
Page 185: Manual Download
ShopStream Update Tool (SST) Manual Download To Decline: at the screen prompt (Figure 14-2) select I Decline. A confirmation To manually download software: message is displayed providing options to Go Back or Exit the software installation 1. Select the SST icon in the Windows taskbar notification area to open the menu (Figure (Figure 14-3). -
Page 186: Installing Software Updates
ShopStream Update Tool (SST) Installing Software Updates To view the update status window (Figure 14-6), select Show Progress from the For SST program updates (only) - if you have the Automatic Update setting ”on”, the update will be installed automatically. See Automatic Update setting SST icon menu (Figure 14-4). -
Page 187: Installing Software Upgrades
The installation will take approximately 30 minutes. If the installation is interrupted, Contact Snap-on Diagnostics Customer Care for assistance. See the Snap-on contact information at the front of this manual. NOTE Figure 14-8 Typical update installation window Before installing a software upgrade, have your Scan Module and USB cable 2. - Page 188 ShopStream Update Tool (SST) Installing Software Upgrades An upgrade installation window will display (Figure 5. After the installation is complete, open the ShopStream Diagnostic Suite 14-10). application. 6. Select Scanner from the Home Screen, if a Scan Module firmware update has The following update has been downloaded sucessfully.
-
Page 189: Section 15: Maintenance
Maintenance Section 15 Introduction 15.7 Cleaning This section describes typical maintenance and care procedures for your diagnostic 15.7.1 Cleaning the Diagnostic Tool tool and components. Periodically perform the following tasks to keep your diagnostic tool in proper Main Topic Links working order: Check the housing, cables and connectors for dirt and damage before and after •... -
Page 190: Battery Pack
Maintenance Battery Pack Keep the following in mind when using and handling the battery pack: IMPORTANT Do not short circuit battery pack terminals. • Do not use any abrasive cleansers or automotive chemicals on the CSM. Do not immerse the diagnostic tool or battery pack in water, or allow water to •... -
Page 191: Battery Pack Replacement
4. Tighten the two battery pack screws. IMPORTANT 15.8.3 Battery Pack Disposal Replace the battery pack with a Snap-on replacement battery pack only. Always dispose of a lithium-ion battery pack according to local regulations, which vary for different countries and regions. The battery pack, while non-hazardous To replace the battery pack: waste, does contain recyclable materials. -
Page 192: Screen Protector Installation
Maintenance Screen Protector Installation 15.9 Screen Protector Installation Touch screen protectors are available as optional equipment (contact your sales representative to order). The following procedure describes typical installation procedures. Items recommended for installation: Microfiber type cloth (lint-free) • Flexible straight edged tool (e.g. small squeegee, plastic card) •... -
Page 193: Stylus Tip Replacement (Touch Screen)
Maintenance Stylus Tip Replacement (Touch Screen) 15.10 Stylus Tip Replacement (Touch Screen) Periodically the capacitive stylus tip may need to be replaced. There are two styles of removable stylus tips. Style “A” (Figure 15-5) - To remove, unthread the tip counterclockwise. To install a new stylus tip, thread it on clockwise until seated. -
Page 194: Legal Information
Snap-on Diagnostics website. Patent Information ***IMPORTANT INFORMATION*** For a listing of Snap-on products that are protected by patents in the United States and elsewhere, visit: https://patents.snapon.com Operating System (OS) Your ZEUS™ delivers exclusive coverage, more capabilities, superior performance ®...
Need help?
Do you have a question about the ZEUS and is the answer not in the manual?
Questions and answers