
Related Manuals for Snap-On P1000


Summary of Contents for Snap-On P1000
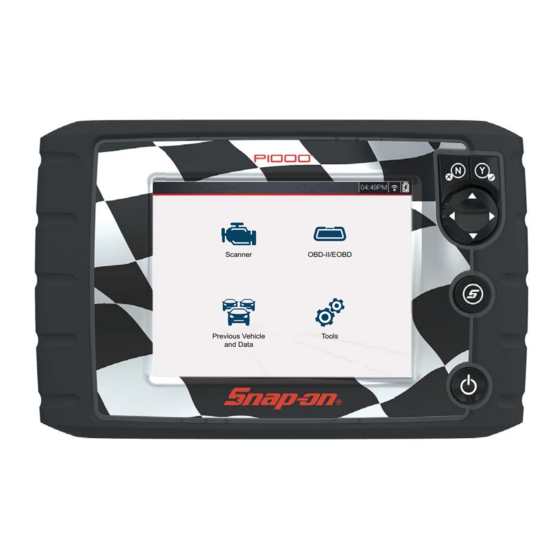
- Page 1 User Manual Scanner Scanner OBD-II/EOBD OBD-II/EOBD Previous Vehicle Previous Vehicle Tools Tools and Data and Data ZEESC334A Rev. A Start...
- Page 2 Contents Quick Links Scanner Using Page Controls Previous Vehicles & Data Table of Contents (TOC) General Information Tools Basic Operation & Navigation Quick Reference Information Maintenance ShopStream Connect™ Wi-Fi Connection...
-
Page 3: Table Of Contents
Viewing Codes and Code Scan Results ..........33 Scroll Bar....................8 Delete Saved Data ................35 Screen Messages ..................9 Snap-on Messages ................. 9 Section 6: Tools..................36 General System Messages ..............9 Tools Menu....................36 Vehicle Communication Messages ............9 Connect-to-PC (File Transfer)............... - Page 4 Table of Contents Add Network Advanced (Connecting to a hidden network) ......46 Wi-Fi Testing....................46 Wi-Fi Troubleshooting and Status Messages ..........47 Section 8: ShopStream Connect ™............50 Using SSC (Connecting to your PC)............50 SSC Main Screen ..................51 Scanner DataViewer ..................
-
Page 5: Safety Information
Safety Information READ ALL INSTRUCTIONS Read, understand and follow all safety messages and instructions in this manual, the accompanying Important Safety Instructions manual, and on the test For your own safety, the safety of others, and to prevent damage to the product and equipment. - Page 6 Safety Information Safety Message Conventions Safety Message Conventions Safety messages are provided to help prevent personal injury and equipment damage. Safety messages communicate the hazard, hazard avoidance and possible consequences using three different type styles: Normal type states the hazard. •...
-
Page 7: Using This Manual
IMPORTANT related topics, procedures, and websites. Hyperlinks are identified by Blue colored text. This manual is intended to be used for P1000 motorcycle scanner operations. For automotive operations, see the Ethos Edge user manual http://diagnostics.snapon.com Text Hyperlink Example: http://diagnostics.snapon.com/usermanuals Page Navigation Controls... - Page 8 Using This Manual Notes and Important Messages Important Abbreviated example for the following procedure: “Select Brightness” 1. Navigate to and highlight the Brightness selection. IMPORTANT indicates a situation which, if not avoided, may result in damage to the 2. Select OK, or similar, button. test equipment or vehicle.
-
Page 9: Section 1: Quick Reference
Download ShopStream Connect our free PC-based companion software used to print, transfer, save, manage, review, annotate, e-mail the saved or recorded files on The diagnostic tool serial number is located on the back of the diagnostic tool your Snap-on diagnostic tool. See ShopStream Connect ™ on page 50 housing. -
Page 10: Section 2: General Information
IMPORTANT This manual is intended to be used for P1000 motorcycle scanner operations. For automotive operations, see the Ethos Edge user manual http://diagnostics.snapon.com/usermanuals This section describes basic feature locations, how the diagnostic tool is powered... -
Page 11: Powering The Diagnostic Tool
General Information Powering the Diagnostic Tool Connectors and jacks for data communication cables and the AC power supply are motorcycle diagnostic connector power circuit. See Data Cable Connection located on the top of the diagnostic tool. page 13 for additional data cable information. Use the supplied power accessory cable when testing models that do not have battery power (B+) available on the motorcycle diagnostic connector. -
Page 12: Ac Power Supply
General Information Technical Specifications Technical Specifications The Battery Status Indicator LED (located next to the power supply jack) indicates battery status. Item Description / Specification Battery Status LED Description Touch Screen Resistive Touch Panel 5.6 inch diagonal, LCD TFT Display 640 x 480 resolution Green - battery is fully charged, or the diagnostic tool is being 24 bit color... -
Page 13: Section 3: Basic Operation And Navigation
A warning message displays if you attempt to turn the diagnostic tool off while communicating with the vehicle. Forcing a shut This manual is intended to be used for P1000 motorcycle scanner down while communicating may lead to control module problems on operations. -
Page 14: Control Buttons
Basic Operation and Navigation Control Buttons Control Buttons Item Button Description Buttons move the cursor or highlight in their There are four “push type” control buttons and one “thumb pad rocker type” multi- respective direction: Directional - directional button located on the right side of the diagnostic tool. All other diagnostic Up (b) •... -
Page 15: Home Screen Icons
Basic Operation and Navigation Basic Navigation 3.3.2 Home Screen Icons 3.3.3 Title Bar Each available diagnostic tool function is represented by a icon on the Home The title bar (Figure 3-2) at the top of the screen provides basic information about screen. -
Page 16: Common Toolbar Control Icons
Basic Operation and Navigation Basic Navigation 3.3.4 Common Toolbar Control Icons 3.3.5 Scroll Bar Common control icon functions are described in the following table. Specific A vertical scroll bar appears along the right-hand edge of the screen when function control icons are described in their applicable sections. Displayed control additional data expands above or below what is currently on the screen icons vary depending on the active function or test. -
Page 17: Screen Messages
The motorcycle is not equipped with the system that was selected. • OK to resume operation. There is a loose connection. • To receive messages from Snap-on, turn WiFi on, see Wi-Fi Connection / There is a blown fuse. • Troubleshooting on page 44. -
Page 18: Section 4: Scanner
Screen messages appear when additional input is needed before proceeding. There IMPORTANT are three types of on-screen messages; confirmations, warnings, and errors. This manual is intended to be used for P1000 motorcycle scanner Confirmation Messages - Confirmation messages inform you when you are •... -
Page 19: Scanner Demonstration Mode
Scanner Basic Operation 4.1.2 Scanner Demonstration Mode 4.1.3 Scanner - Starting / Stopping The Scanner demonstration mode allows you to interact with and explore Scanner To start the Scanner function: functions without connecting to a motorcycle. 1. From the Home screen, select the Scanner icon. The vehicle identification process starts. -
Page 20: Features And Icons
Scanner Features and Icons Features and Icons 4.2.2 Scanner Control Icons The scanner toolbar contains control icons. Control icons may vary depending on the 4.2.1 Scanner Features active function or test. An inverted (highlighted) icon indicates it is selected. Other control icons (not shown) are described in Common Toolbar Control Icons on page 8. -
Page 21: Basic Scanner Operation (Quick Start)
Scanner Features and Icons 4.2.3 Basic Scanner Operation (Quick Start) 4.2.4 Data Cable Connection This section lists the basic scanner operation steps, and is only intended as a NOTE quick-start reference. Refer to the supporting topics in this section for detailed operation information. -
Page 22: Vehicle Identification / System Selection
Scanner Features and Icons A menu option may be displayed to choose either Automatic ID or Manual ID. NOTE - Selecting Automatic ID (If supported) will briefly display a The SVI requires 12VDC power to communicate. Power is normally supplied communications screen informing you that the diagnostic tool is through the motorcycle diagnostic connector, however the supplied 12VDC attempting to establish communication and determine vehicle... - Page 23 Scanner Features and Icons Depending on the motorcycle, a menu option to select a system list display 3. A menu of available systems and/or options is displayed. Select a system or type may be provided (Figure option (Figure 4-5) to continue. 4-4).
-
Page 24: System Main Menu Options
Scanner System Main Menu Options System Main Menu Options Once a System is selected (e.g. Engine, Antilock Brakes, etc) is selected, the diagnostic tool will attempt to establish communication with the motorcycle, then (once connected) will display (Figure 4-7) the system main menu (available tests). Figure 4-6 Typical systems menu (non-categorized list view) Figure 4-7 Typical (Engine) main menu Menus and navigation will vary by motorcycle make and model. -
Page 25: Codes - View / Scan / Save
Scanner Codes - View / Scan / Save Codes - View / Scan / Save 4.4.2 Clear Codes The diagnostic tool can clear codes from the electronic control module(s). This 4.4.1 Viewing Codes selection only displays if the motorcycle supports this feature. After selecting a System, “Codes”... - Page 26 Scanner Codes - View / Scan / Save Code Scan Toolbar NOTES The following Code Scan related control icons are used: The Code Scan function and results are dependent upon the vehicle. Not all vehicles may support this function. Icon Function Selecting Code Scan from the Vehicle System menu (Figure...
- Page 27 Scanner Codes - View / Scan / Save List of All the Systems Analyzed with DTCs Totals Saving Codes and Code Scan Results A categorized system list with DTC totals is displayed in the order they are scanned. Icon Function To view the main menu for a system in the list, select the system, then select the System icon (Figure...
-
Page 28: Viewing And Saving Data
Scanner Viewing and Saving Data Viewing and Saving Data 4.5.1 About the Data Buffer The diagnostic tool has the capability to collect, store and save PID data utilizing Selecting Data or other similar data menu option (depending on the vehicle internal storage memory and buffer memory. -
Page 29: About Cursors
Scanner Viewing and Saving Data 4.5.2 About Cursors 4.5.3 Pausing and Reviewing Active Data Vertical cursors are automatically displayed (in graphical PID views) to mark specific During normal operation, data from the vehicle’s ECM is continuously being stored in data reference points. buffer memory as it is displayed onscreen. - Page 30 Scanner Viewing and Saving Data Toolbar control icons are described in on page 12 and To resume data collection (after pausing): Scanner Control Icons Common Toolbar Control Icons on page 8. Select the Record icon • The screen changes back to display data (Figure After Pause is pressed: 4-17).
-
Page 31: Saving Data Files
Scanner Viewing and Saving Data 4.5.4 Saving Data Files Depending on the amount of data saved the cursor may be initially located on the far left next to the description, or the far right next to the scroll bar making Saving data is useful when trying to isolate an intermittent problem or to verify a it difficult to see. -
Page 32: Using Zoom
Scanner Viewing and Saving Data 4.5.5 Using Zoom Pressing the Save icon more than once in the same data collection session will create multiple (.SCM) files. Each file will contain gray (vertical cursors) (Figure 4-19) indicating where the data was paused. The zoom function allows you to change the magnification level of the graphed data during data collection and review. -
Page 33: Changing Data Views - Pid List / Graphs
Scanner Viewing and Saving Data 4.5.6 Changing Data Views - PID List / Graphs The 1, 2, and 4 Graph views divide the screen horizontally to simultaneously display data graphs for the indicated number of parameters (Figure 4-23). Selecting the View icon (Figure 4-22) opens a drop-down menu of viewing options:... -
Page 34: Selecting Pids To Display (Custom Display)
Scanner Viewing and Saving Data 4.5.7 Selecting PIDs to Display (custom display) The toolbar icons provide options for selecting and deselecting parameters to include or remove from the custom data list: The Custom Data List icon on the toolbar is used to select which PIDs Icon Description to display. -
Page 35: Using Triggers
Scanner Viewing and Saving Data 4.5.9 Using Triggers Up to three parameters can be locked at a time. Once locked, a parameter remains locked until it is manually unlocked, or communication with the vehicle is stopped. Trigger Description and Features Setting PID triggers allows you to configure the diagnostic tool to automatically save PID data to a file, when a PID value meets an upper/ lower limit (trigger point). - Page 36 Scanner Viewing and Saving Data Setting triggers: To use triggers, they must be turned on (set/configured), and then armed. Use the following procedures to setup PID triggers. 1. Highlight the PID to setup with a trigger. 2. Select the Trigger icon. Selecting the Trigger icon (Figure 4-28) displays trigger menu options:...
- Page 37 Scanner Viewing and Saving Data The display returns to the PID data view and the trigger points appear as horizontal lines across the designated graph (Figure 4-31). Repeat this procedure to establish trigger points for other parameters (up to three) if desired. NOTE Only three parameters can have trigger levels set at one time, but only one of the conditions needs to be satisfied for triggering to occur.
-
Page 38: Functional Tests
Scanner Functional Tests Functional Tests About Activated Triggers A trigger is activated when a PID value meets an upper/lower limit (trigger point). The Functional Tests selection is used to access OEM model specific subsystem tests. Available tests vary by manufacturer, year, and model. Only the tests supported When a trigger is activated: by the motorcycle are displayed in the menu. - Page 39 Scanner Functional Tests Figure 4-35 Functional test example A Test icon on the toolbar activates the test, and a Return, or similarly named, icon cancels the test. For variable control tests, the variable value displays between the main body and the toolbar. Plus and Minus icons on the toolbar increase and decrease the variable value.
-
Page 40: Section 5: Previous Vehicles And Data
Previous Vehicles and Data Section 5 This section describes the basic operation of the Previous Vehicles and Data function. The Previous Vehicles and Data icon is located on the Home screen. This function allows you to select recently tested motorcycles and access saved data files. Main Topic Links Vehicle History page 32... -
Page 41: View Saved Data
Previous Vehicles and Data Previous Vehicles and Data Menu 5.1.2 View Saved Data To review a saved data file or image: 1. Select Previous Vehicles and Data from the Home screen. Selecting the View Saved Data menu option opens a list of all the saved data 2. - Page 42 Previous Vehicles and Data Previous Vehicles and Data Menu Selecting a system code or a code scan .XML file from the saved file list, opens that Viewing / Printing the Code Scan Report file onscreen (Figure 5-4). Once saved, the code scan report can be viewed and printed using ShopStream Connect, see Printing the Code Scan Report on page 53.
-
Page 43: Delete Saved Data
Previous Vehicles and Data Previous Vehicles and Data Menu 5.1.4 Delete Saved Data This menu option is used to permanently erase saved files from memory. To delete a saved file: 1. Select Previous Vehicles and Data > Delete Saved Data. The list of saved files displays. -
Page 44: Section 6: Tools
Tools Section 6 Tools Menu This section describes the basic operation of the Tools function. The Tools icon is located on the Home screen. This function allows The following options are available from the Tools menu: you to configure diagnostic tool settings to your preferences. Connect-to-PC (File Transfer)—use to transfer and share files with a personal •... -
Page 45: Connect-To-Pc (File Transfer)
3. Connect the supplied USB cable to the diagnostic tool and then to the PC. 3/15/2019 11:01PM The diagnostic tool, displays as an external drive. Using Windows File P1000 Bundle: 19.2 Version: 1.5.0.16300 NA Explorer locate the “USERDATA” folder to find saved screenshots (.BMP), RUNTIME: 5.3.2.5... -
Page 46: Settings
Tools Tools Menu 6.1.4 Settings DISPLAY (settings) This Tools selection allows you to adjust certain basic diagnostic tool functions to Brightness your personal preferences. Selecting opens an additional menu that offers the Selecting this option opens the brightness setting screen for adjusting the back following: lighting of the display (Figure... -
Page 47: High Contrast Toolbar
Tools Tools Menu Color Theme High Contrast Toolbar This option allows you to select between a white and black background for the This option allows you to switch to a high contrast toolbar. This toolbar features screen. The black background can be beneficial when working under poor lighting black and white icons with crisp graphics that are easier to see in poor lighting conditions. -
Page 48: Font Type
Tools Tools Menu Font Type Touch Screen Calibration This option allows you to select between standard and bold faced type for the Calibrating the touch screen maintains the accuracy of the touch-sensitive display. display screen. Bold type makes screen writing more legible under poor lighting or IMPORTANT bright sunlight conditions. -
Page 49: Time Zone
Tools Tools Menu If the calibration is successful, the “Touch Calibration Results - Passed” To set the clock: – screen is displayed (Figure 6-8). Press the Y button to complete the process 1. Select Tools from the Home screen to open the menu. and return to the Display menu. -
Page 50: Configure Wi-Fi
Tools Tools Menu Daylight Savings Time Configuring Scanner This option opens a menu to configure the internal clock for Daylight Savings Time. This option allows you to change the scanner display to toggle scales on and off. Choose from: Scales are the graduations and values that display on the horizontal axis at the base of the parameter graphs. -
Page 51: Configure Units
Tools Tools Menu Configure Units Selecting opens a dialog box that allows you to choose between US customary or metric units of measure for various units. Figure 6-11 Configure units menu To change the units setup: 1. Select Tools from the Home screen to open the menu. 2. -
Page 52: Section 7: Wi-Fi Connection / Troubleshooting
Snap-on Web Services Network. If the Wi-Fi indicator is displayed in the title bar, Wi-Fi is on. If Wi-Fi is off, see Connecting to Wi-Fi allows the tool to periodically receive messages from Snap-on. on page 45 to turn it on and... -
Page 53: Wi-Fi Icons (Setup)
Wi-Fi Connection / Troubleshooting Wi-Fi Icons (Setup) Wi-Fi Icons (Setup) Familiarize yourself with the following Wi-Fi icons and indicators from the Wi-Fi configuration screen. Wi-Fi Icon (toggle type) Wi-Fi Test Icon Wi-Fi Signal Strength Indicator Select to open Zero bars Three bars Select to turn Select to turn... -
Page 54: Add Network Advanced (Connecting To A Hidden Network)
Wi-Fi Connection / Troubleshooting Add Network Advanced (Connecting to a hidden network) Add Network Advanced (Connecting Wi-Fi Testing to a hidden network) If you are experiencing network connection issues, an automated testing feature is available to quickly test your network connection. The Add Network selection allows you to connect to a network that is not broadcasting its name (not visible in the displayed network list). -
Page 55: Wi-Fi Troubleshooting And Status Messages
4. If a connection issue(s) is present, select View Summary to review the results. equipment. There may be some situations that require your time for router The summary information is helpful if you are experiencing difficulties with connection troubleshooting and/or additional consultation and equipment. Snap-on your connection (Figure 7-5). - Page 56 Wi-Fi Connection / Troubleshooting Wi-Fi Troubleshooting and Status Messages Check Router Settings Verify the following router settings BEFORE you begin troubleshooting a non- General -Troubleshooting connectivity or “No Connection” problem. After each check, make any corrections Problem Possible Cause Corrective Action as necessary then retest for connectivity.
- Page 57 Wi-Fi Connection / Troubleshooting Wi-Fi Troubleshooting and Status Messages Connection Tests - Troubleshooting Possible Cause Failed Test (Displayed Tip Corrective Action / Checks Message*) Wi-Fi radio not responding and/or will not turn off Wi-Fi radio not Hardware Contact Customer Support for assistance. responding and/or will not initialize Missing or corrupt...
-
Page 58: Section 8: Shopstream Connect
ShopStream Connect ™ Section 8 Introduction 8.1 Using SSC (Connecting to your PC) This section provides a brief introduction to the features and operation of To connect and use SSC with your diagnostic tool: ShopStream Connect (SSC). 1. Download and install SSC on your PC from: SSC is a companion PC application (provided at no charge) that extends the http://diagnostics.snapon.com/ssc capabilities of your diagnostic tool, by connecting to your PC. -
Page 59: Ssc Main Screen
The following shows the main screen layout for ShopStream Connect software. ShopStream Connect program is closed. 7— Preview—displays a sample of the file if the selected file is a image file. P1000 Figure 8-2 1— Notes Window—allows you add notes to select data files. Select Save from the menu bar to save your notes. -
Page 60: Scanner Dataviewer
ShopStream Connect ™ Scanner DataViewer 8.3 Scanner DataViewer 8.4 Image Viewer SSC allows you to view and print .bmp, .jpg and .sps image files (screenshots) saved SSC allows you to view data files recorded with your diagnostic tool, on your PC. on your diagnostic tool, with your PC. -
Page 61: Printing The Code Scan Report
1. Double-click the code scan .XML file from the file list to open the Code Scan Report (Figure 8-5) in the Code Scan Viewer (Figure 8-6). P1000 Figure 8-6 3. Selecting Print opens the Windows print dialog window (Figure 8-7). Select your printer from the list, then select Print to print the report. -
Page 62: Customizing The Code Scan Report
To edit the Shop Information (header) of the Code Scan Report: 1. From ShopStream Connect, select Tools > Options > Edit Shop Info (Figure 8-8). P1000 Figure 8-8 2. The Shop Info dialog box opens (Figure 8-9) allowing you to enter the name address, and phone number for your shop. -
Page 63: Software Upgrades And Updates
Internet. Figure 8-11 NOTE Example - Updating diagnostic tool software: 1. Select Tools > Update Software > (diagnostic tool type - e.g. P1000) from For additional information on ShopStream Connect software updates and the Menu bar (Figure upgrades, download the ShopStream Connect User Manual from our website: 8-10). -
Page 64: End User License Agreement
License Agreement. The diagnostic tool should not be initially operated until the End User License Agreement is read. Use of the device acknowledges your acceptance of the End User License Agreement. The Snap-on Incorporated Software End User License Agreement is available at: https://eula.snapon.com/diagnostics... -
Page 65: Section 9: Maintenance
Maintenance Section 9 9.1.1 Cleaning the Touch Screen This section describes basic cleaning and battery replacement procedures for your diagnostic tool. The touch screen can be cleaned with a soft cloth and a mild window cleaner. Main Topic Links IMPORTANT Cleaning and Inspecting the Diagnostic Tool page 57 •... -
Page 66: Ordering A New Battery Pack
IMPORTANT Keep the following in mind when using and handling the battery pack: If replacing the battery pack, only use the recommended Snap-on replacement battery pack. Do not short circuit battery pack terminals. -
Page 67: Disposing Of The Battery Pack
Maintenance Battery Pack Service 9.2.4 Disposing of the Battery Pack This side up. Always dispose of the battery pack according to local regulations, which vary for different countries and regions. The battery pack, while non-hazardous waste, does contain recyclable materials. If shipping is required, ship the battery pack to a recycling facility in accordance with local, national, and international regulations. -
Page 68: Legal Information
Download the latest version of this manual and other related technical documentation from the For a listing of Snap-on products that are protected by patents in the United States Snap-on Diagnostics website. - Page 69 Legal Information FCC Compliance Statement FCC Compliance Statement This equipment has been tested and found to comply with the limits for a Class B digital device, pursuant to part 15 of the FCC rules. These limits are designed to provide reasonable protection against harmful interference in a residential installation.
Need help?
Do you have a question about the P1000 and is the answer not in the manual?
Questions and answers