Advertisement
TI-GRAPH LINK, Calculator-Based Laboratory, CBL, CBL 2, Calculator-Based Ranger, CBR,
Constant Memory, Automatic Power Down, APD, and EOS are trademarks of Texas
Instruments Incorporated.
Windows is a registered trademark of Microsoft Corporation.
Macintosh is a registered trademark of Apple Computer, Inc.
© 1995–1997, 2001 by Texas Instruments Incorporated.
Advertisement

Related Manuals for Texas Instruments TI-80


Summary of Contents for Texas Instruments TI-80
- Page 1 TI-GRAPH LINK, Calculator-Based Laboratory, CBL, CBL 2, Calculator-Based Ranger, CBR, Constant Memory, Automatic Power Down, APD, and EOS are trademarks of Texas Instruments Incorporated. Windows is a registered trademark of Microsoft Corporation. Macintosh is a registered trademark of Apple Computer, Inc.
- Page 2 Texas Instruments, regardless of the form of action, shall not exceed the purchase price of this calculator. Moreover, Texas Instruments shall not be liable for any claim of any kind whatsoever against the use of these materials by any other party.
-
Page 3: Table Of Contents
Table of Contents This manual describes how to use the TI.80 Graphing Calculator. Getting Started gives a quick overview of its features. The first chapter gives general instructions on operating the TI.80. Other chapters describe its interactive features. The applications in Chapter 11 show how to use these features together. - Page 4 Chapter 2: Getting Started: Lottery Chances Using the TI-80 Functions Math, Angle, and Keyboard Math Operations Test Operations MATH MATH MATH NUM MATH PRB ANGLE TEST Getting Started: Working with Fractions Chapter 3: Fractions Setting Modes for Fraction Results Entering and Using Fractions in Calculations...
- Page 5 Chapter 6: Getting Started: Roots of a Function Defining the Independent Variable Tables Defining the Dependent Variable Displaying the Table Getting Started: Shading a Graph Chapter 7: Draw Operations DRAW DRAW Drawing Lines Drawing Horizontal and Vertical Lines Drawing a Function Shading Areas on a Graph Drawing Points Clearing a Drawing...
- Page 6 Chapter 10: Getting Started: Rolling a Die About TI-80 Programs Programming Creating and Executing Programs Editing Programs PRGM CTL PRGM I/O Calling Other Programs Probability Experiments: Coins, Dice, and Spinners Chapter 11: Applications The Unit Circle and Trigonometric Curves Program: Newton’s Numerical Solve Routine...
- Page 7 Appendix A: Table of TI-80 Functions and Instructions Menu Map Tables and TI-80 Variables Reference Information Appendix B: Battery Information Accuracy Information Service and In Case of Difficulty Warranty Information Service and Support Information Warranty Information Index A-20 A-26 B-10...
-
Page 8: Using This Guidebook Effectively
Using this Guidebook Effectively The structure of the TI-80 guidebook and the design of its pages can help you find the information you need quickly. Consistent presentation techniques are used throughout to make the guidebook easy to use. The guidebook is designed to teach you how to use the Structure of the calculator. - Page 9 ¦ Specific text—The text to the right of a subheading presents detailed information about that specific topic or task. The information may be presented as paragraphs, numbered procedures, bulleted lists, or illustrations. ¦ Page “footers”—The bottom of each page shows the chapter name, chapter number, and page number.
- Page 10 Reference Aids Several techniques have been used to help you look up specific information when you need it. These include: ¦ ¦ ¦ ¦ ¦ ¦ x Introduction A chapter table of contents on the first page of each chapter, as well as the full table of contents at the front of the guidebook.
-
Page 11: Glossary
Instruction Instructions are not valid in expressions. An instruction does not return a value to A list is a set of values that the TI-80 can use for activities List such as evaluating a function at multiple values and entering statistical data. - Page 12 Pixel A pixel (picture element) is a square dot on the TI-80 display. The TI-80 display is 64 pixels wide and 48 pixels high. Real Number On the TI-80, real numbers are individual decimal or fraction values. Value A value is a single decimal or fraction number or a list of decimals or fractions.
- Page 13 Getting Started contains two keystroke-by-keystroke examples an interest rate problem and a volume problem which introduce you to some principal operating and graphing features of the TI.80. You will learn to use the TI.80 more quickly by completing both of these examples first.
-
Page 14: Getting Started
TI-80 Keyboard The keys on the TI.80 are grouped by color and physical layout to allow easy location of the key you need. The keys are divided into zones: graphing keys, editing keys, advanced function keys, and scientific calculator keys. -
Page 15: First Steps
First Steps Before beginning the two sample problems, follow the steps on this page to reset the TI-80 to its factory settings. (Resetting the TI-80 erases all previously entered data.) This ensures that following the keystrokes in this section produces the same actions. -
Page 16: Ti-80 Menus
TI-80 Menus To leave the keyboard uncluttered, the TI.80 uses full-screen menus to display many additional operations. The use of specific menus is described in the appropriate chapters. Displaying a Menu When you press a key that displays a menu, such as I, that menu screen temporarily replaces the screen where you are working. -
Page 17: Entering A Calculation: Compound Interest
Entering a Calculation: Compound Interest The TI.80 displays up to 8 16-characters lines so that you see an expression and its solution together. You can store values to variables, enter multiple instructions on one line, and recall previous entries. Using trial and error, determine when an amount invested at 6% annual compounded interest will double in value. -
Page 18: Continuing A Calculation
Continuing a Calculation To save keystrokes, you can use the Last Entry feature to recall the last expression entered and then edit it for a new calculation. In addition, the next expression can be continued from the previous result. 1. The next guess should be less than, but close to, 12 years. -
Page 19: Defining A Function: Box With Lid
Defining a Function: Box with Lid Take an 8½"×11" sheet of paper and cut X by X squares from two corners and X by (X+B) rectangles from the other two corners. Now fold the paper into a box with lid. What X would give the maximum volume V of a box made in this way? Use tables and graphs to determine the solution. -
Page 20: Defining A Table Of Values
Defining a Table of Values The table feature of the TI.80 provides numeric information about a function. Use a table of values from the previously defined function to estimate an answer to the problem. 1. Press y # (above p) to display the TABLE SETUP screen. -
Page 21: Zooming In On The Table
Zooming In on the Table You can adjust the way a table is displayed to get more detailed information about any defined function. By varying the value of @TBL, you can “zoom in” on the table. 1. Adjust the table setup to get a more accurate estimate of the maximum size of the cutout. - Page 22 4. Press y #. Press Í to set Press 5. Press y & and use † and } to scroll the table. Two “equal” maximum values are shown, X=1.58 X=1.59 6. Press † or } to move the cursor to move the cursor into the of the display shows the value of precision,...
-
Page 23: Changing The Viewing Window
Changing the Viewing Window The viewing window defines the portion of the coordinate plane that appears in the display. The values of the Window variables determine the size of the viewing window. You can view and change these values. 1. Press p to display the Window variables edit screen. -
Page 24: Displaying And Tracing The Graph
Displaying and Tracing the Graph Now that you have defined the function to be graphed and the window in which to graph it, you can display and explore the graph. You can trace along a function with TRACE. 1. Press s to graph the selected function in the viewing window. -
Page 25: Zooming In On The Graph
1. Press q to display the This menu is typical of TI-80 menus. To select an item, you may either press the number to the left of the item, or you may press † until the item number is highlighted and then press Í. - Page 26 Other TI.80 Features Getting Started has introduced you to basic calculator operation and the table and function graphing features of the TI-80. The remainder of this Guidebook describes these features in more detail and also covers other capabilities of the TI-80.
- Page 27 Chapter 1: Operating the TI-80 This chapter describes the TI.80 and provides general information about its operation. Turning the TI.80 On and Off Chapter Contents Setting the Display Contrast The Display Entering Expressions and Instructions The Edit Keys Setting Modes TI.80 Modes...
-
Page 28: Turning The Ti-80 On And Off
Turning the TI-80 On and Off To turn the TI.80 on, press the ´ key. To turn it off, press and release y, and then press ®. After about five minutes without any activity, the APD™ (Automatic Power Down™) feature turns the TI.80 off automatically. -
Page 29: Setting The Display Contrast
The brightness and contrast of the display depend on room lighting, battery freshness, viewing angle, and the adjustment of the display contrast. The contrast setting is retained in memory when the TI.80 is turned off. You can adjust the display contrast to suit your viewing angle Adjusting the and lighting conditions. -
Page 30: The Display
The Display The TI.80 displays both text and graphs. Graphs are described in Chapters 4 and 5. The primary screen of the TI-80 is the Home screen. You enter Home Screen instructions to be executed, expressions to be evaluated, and see the results on the Home screen. - Page 31 Graphs and the screens for viewing and editing tables and lists have different cursors, which are described in the appropriate chapters. When the TI-80 is calculating or graphing, a vertical line Busy Indicator shows in the upper right of the display as a busy indicator.
-
Page 32: Entering Expressions And Instructions
Note: EOS rules determine the order in which operations are completed (page 1-20). Most TI-80 functions and operations are symbols with several characters in them. You must enter the symbol from the keyboard or menu. You cannot spell it out. For example, to... - Page 33 (There may be a delay.) í is displayed. at the end of the name. MIN(5,8) LINE( requires four arguments in this LINE(1,1,3,3) , , , ‡ , and ÷ MIN( requires CLRDRAW at the Operating the TI-80 1-7...
-
Page 34: The Edit Keys
ALPHA-LOCK Allows you to enter an mode without pressing ? first. 1-8 Operating the TI-80 On the top line of an expression on the Home screen, 7 moves the cursor to the beginning of the expression. On the bottom line of an expression on the Home screen, 8 moves the cursor to the end of the expression. -
Page 35: Setting Modes
Setting Modes Modes control how numbers and graphs are displayed and interpreted by the calculator. Mode settings are retained by the Constant Memory feature when the TI.80 is turned off. Press 3 to display the Checking MODE are highlighted. The settings are described on the following Settings pages. -
Page 36: Ti-80 Modes
TI-80 Modes The TI.80 has eight mode settings. They control how numeric entries are interpreted, how answers are calculated or displayed, and how graphs appear in the display. Modes are set on the MODE screen (page 1.9). Notation formats affect only how an answer is displayed on NORMAL the Home screen. - Page 37 (simultaneous) graphing evaluates and plots all are selected pairs. They are value at a time. SINê COSê is displayed as 1À2º3. 5º3 2º6 + 2º6 (Chapter 5). , one at a time. In Operating the TI-80 1-11...
-
Page 38: Variable Names
Variable Names On the TI.80 you can enter, name, and use several types of data: numeric values (including fractions), lists, functions, and statistical plots. Variables and The TI-80 uses both user-assigned and pre-assigned names for Defined Items variables and other items saved in memory. -
Page 39: Storing And Recalling Variable Values
Press 2 function. To use the current value of a variable in an expression, just Using a Variable enter the variable name in the expression. in an Expression and select the type and name of the Operating the TI-80 1-13... -
Page 40: Last Entry
When you press ¸ on the Home screen to evaluate an expression or execute an instruction, the expression or instruction is stored in an area called Last Entry, which you can recall. When you turn the TI.80 off, Last Entry is retained in memory. - Page 41 Now try this. ¸ Continue until the answer is as accurate as you want. « § ? ). They are all stored together in , use trial and error to find the radius ° / .95 Operating the TI-80 1-15...
-
Page 42: Last Answer
When an expression is evaluated successfully from the Home screen or from a program, the TI.80 stores the answer to a variable, ANS (Last Answer). ANS may be a decimal number, a fraction, or a list. When you turn the TI.80 off, the value in ANS is retained in memory. -
Page 43: Ti-80 Menus
TI-80 Menus To leave the keyboard uncluttered, the TI.80 uses full.screen menus to give you access to many additional operations. The use of specific menus is described in the appropriate chapters. Some menu keys, such as I, display more than one menu. - Page 44 Selection ¦ ¦ ¦ ¦ 1-18 Operating the TI-80 To return to the Home screen, press 2 .. To return to the screen where you were, press M. To display a different menu, press the appropriate key, such as *.
-
Page 45: The Vars And Y-Vars Menus
Displays a menu of names of Yn functions. Displays a menu of names of XnTàYnT equations. Lets you select/deselect functions. VARS , and variables. variables. @TBL variables. SIMP function. menu. Then press 9 Y.VARS menu: VARS Y.VARS menu is Operating the TI-80 1-19... -
Page 46: Eos (Equation Operating System)
EOS (Equation Operating System) The Equation Operating System (EOS™) defines the order of operations for the calculator that is, the order in which the TI.80 evaluates functions in expressions. EOS lets you enter numbers and functions in a simple, straightforward sequence. - Page 47 Negation To enter a negative number, use the negation function. Press ·, and then enter the number. On the TI-80, negation is in the fourth group in the EOS hierarchy. Functions in the first group, such as squaring, are evaluated before negation.
-
Page 48: Error Conditions
Error Conditions The TI.80 detects any errors at the time it evaluates an expression, executes an instruction, plots a graph, or stores a value. Calculations stop and an error message with a menu is displayed immediately. Error codes and conditions are described in detail in Appendix B. - Page 49 Chapter 2: Math, Angle, and Test Operations This chapter describes the math, angle, and relational operations that are available on the TI.80. The most commonly used functions are accessed from the keyboard; others are accessed through menus. Getting Started: Lottery Chances...
-
Page 50: Getting Started: Lottery Chances
Getting Started: Lottery Chances Getting Started is a fast-paced introduction. Read the chapter for details. Suppose you want to enter a lottery where six numbers will be drawn out of 50. To win, you must pick all six numbers (in any order). What is the probability of winning if you buy one ticket? What is the probability of winning if you buy five tickets? 1. -
Page 51: Using The Ti-80 Functions
Using the TI-80 Functions This page contains some general information you should know about the TI.80 functions described in Chapter 1. Using Lists with Functions that are valid for lists return a list calculated on an Functions element-by-element basis. If two lists are used in the same expression, they must be the same length. -
Page 52: Keyboard Math Operations
Keyboard Math Operations The most commonly used math functions are on the keyboard. The keyboard math operations can be used with decimal numbers, fractions (except as noted), expressions, and lists. The basic arithmetic functions are: addition «, subtraction |, (Add) multiplication p, and division e. - Page 53 (power, Z), (Power) be used with decimal numbers, fractions, expressions, or lists. (Square) ‡ (Square Root) When used with a fraction, value Note: Raising a negative number to a noninteger power can result in a complex number, which returns an error. These functions find the logarithm l, power of ten 2 h, and natural log x of the specified value or list of values.
- Page 54 For example, is evaluated before negation. Use parentheses to square a negated number, number, expression, or list. Pi (2 T) is stored as a constant in the TI-80. Press 2 T (Pi) to copy the symbol 3.141592654 internally in calculations.
-
Page 55: Math Math Operations
MATH MATH Operations To display the MATH MATH menu, press I. When you select a menu item, the name is copied to the cursor location. Functions that are valid for lists return a list calculated on an element-by-element basis. MATH MATH MATH Menu 1: INT÷... - Page 56 8DEC answer in decimal form. 8 and at the end of an expression. value can be a list. value8 expression8 (cube, (Cube) expression, or list. value ‡ ‡ (Cube Root) number, expression, or list. ‡ ‡ ‡ (Root) number, expression, or list. 2-8 Math, Angle, and Test Operations (convert to decimal, , item 3) returns the cube of a number,...
- Page 57 NDERIV( NDERIV( an approximate derivative of an expression with respect to a specified variable, given the value at which to calculate the derivative, and H (optional; if none is specified, 1 NDERIV( NDERIV( NDERIV( shown in the formula below), which approximates the numerical derivative value as the slope of the secant line through the points: f¢(...
-
Page 58: Math Num (Number) Operations
MATH NUM (Number) Operations To display the MATH NUM menu, press I 9. When you select a menu item, the name is copied to the cursor location. Functions that are valid for lists return a list calculated on an element-by-element basis. MATH NUM MATH NUM PRB Menu... - Page 59 MIN( MIN( of two values or the smallest element in a list. If two lists are MAX( compared, it returns a list of the smaller of each pair of elements. If a list and a value are compared, it compares each element in the list to the value.
-
Page 60: Math Prb (Probability) Operations
Number of combinations. Factorial. Random integer generator. (random number, MATH PRB RAND is stored to RAND so that the TI-80 uses 1 as the seed , item 1) generates and . In the second example RAND is set to the factory... - Page 61 number of permutations of items taken number at a time. items and number must be nonnegative integers. Both items and number can be lists. number of combinations of items taken number at a time. items and number must be nonnegative integers. Both items and number can be lists.
-
Page 62: Angle Operations
ANGLE Operations To display the ANGLE menu, press 2 E. The ANGLE menu displays angle indicators and instructions. When you select an item from the menu, the name is copied to the cursor location. ANGLE ANGLE Menu 1: ¡ 3: R8Pr( 4: R8Pq( 5: P8Rx( 6: P8Ry(... - Page 63 Note: When converting from one coordinate system to the R8Pr ( R8Pq( other, be sure that the angle mode setting, P8Rx( RADIAN 3 to check the current setting.) P8Ry( R8Pr( coordinates to polar coordinates and returns R8Pq( coordinates to polar coordinates and returns Both X and Y can be lists.
-
Page 64: Test (Relational) Operations
Less than. Less than or equal to. if the test is false. valueA and valueB can valueB ƒ valueB > valueB ‚ valueB < valueB valueB 2+2=2+3 returns returns 2+(2=2)+3 . The TI-80 does the . The TI-80 first... - Page 65 Chapter 3: Fractions This chapter describes how to use the fraction operations on the TI.80. Chapter Getting Started: Working with Fractions Setting Modes for Fraction Results Contents Entering and Using Fractions in Calculations FRACTION Menu Fractions 3-1...
-
Page 66: Getting Started: Working With Fractions
úSIMP ( is copied to the cursor location. 5. Press ¸ to simplify the fraction. MANSIMP mode, the TI-80 uses the lowest common factor for simplification. The simplification factor is displayed. The indicates that the fraction can be simplified further. - Page 67 The TI.80 uses the lowest common factor for simplification. If you want to choose the simplification factor yourself, you can enter it as part of the expression. 6. Press M to clear the screen. Reenter the expression, or press 2 ² until you see the expression 1À...
-
Page 68: Setting Modes For Fraction Results
Setting Modes for Fraction Results From the MODE screen, you can select simplification and display format options for fraction results. AUTOSIMP Mode AUTOSIMP with bºc and Simplification takes place before the expression is evaluated. aÀbºc Modes Then the result is simplified to its lowest terms. For example, 12à16 There are two formats for displaying fractions results. - Page 69 MANSIMP Mode MANSIMP MANSIMP with aÀbºc Mode concepts. In the results of expressions using fractions, step-by-step. When a fraction result is not expressed in its lowest terms, a down arrow ( simplify the result. Use simplify the fraction. You can then use change the display format of the fraction result.
-
Page 70: Entering And Using Fractions In Calculations
Entering and Using Fractions in Calculations The TI.80 lets you enter fractions directly from the keyboard. Entering Simple A simple fraction is a fraction with no whole-number part; for example, Fractions To enter a simple fraction: 1. Enter the numerator (up to six digits), and then press 2 2. - Page 71 The results of the expressions, however, may or may not be fractions. Using Fractions The absolute value of a fraction on the TI-80 cannot be 1000. in Expressions «, |, p, e, V, a, ·, and 2 P accept fraction entries and return fraction results.
-
Page 72: The Fraction Menu
úSIMP factor. Note: You have two options for simplifying fractions. ¦ You can let the calculator simplify the fraction, step-by- step, using the lowest common factor (LCF). fraction ¦ You can choose a factor (an integer) for simplifying the fraction. - Page 73 8bºc (convert to simple fraction, Converting value to a simple fraction. Simple and Mixed Fractions 8aÀbºc úbºc mixed fraction. 8aÀbºc 8bºc value 8aÀbºc value Both 8bºc expression. A FRACTION (convert to mixed fraction, item 3) converts value to a 8aÀbºc can be used only at the end of an §...
- Page 74 8FRAC Converting decimal value to its fraction equivalent and displays it. The Decimals and Fractions decimal may be a number, expression, or list. úFRAC MANSIMP 8DEC in terms of 10ths, 100ths, or 1000ths. If this is not possible, 8FRAC would in or if the denominator of the equivalent fraction is greater than 1000, the decimal equivalent is returned.
- Page 75 Chapter 4: Function Graphing This chapter describes function graphing on the TI.80 in detail. It also lays the foundation for using the parametric graphing features described in Chapter 5. Getting Started: Graphing a Circle Chapter Contents Defining a Graph Setting Graph Modes...
-
Page 76: Getting Started: Graphing A Circle
To graph a circle, you must enter separate formulas for the upper and lower portions of the circle. Then use ZSQUARE to adjust the display to make the functions appear as a circle. Make sure that your TI-80 is in are turned off. STAT PLOTS 1. -
Page 77: Defining A Graph
Exploring a Once you have defined a graph, you can display it and use Graph several tools on the TI-80 to explore the behavior of the function or functions. These tools are described later in this chapter. graphing (Chapter 1). -
Page 78: Graphing
¦ PARAM To graph functions, you must select graphing). The basics of graphing on the TI-80 are described in this chapter. Differences in parametric graphing are described in Chapter 5. The mode settings can affect how functions are graphed. ¦... -
Page 79: Defining Functions In The Y= List
Defining Functions in the Y= List Pressing ( displays the Y= edit screen. This is where you enter the functions to graph. You can store up to four functions in memory at one time. You can graph one or more of these functions at a time. Press ( to display the Displaying the Functions in the... - Page 80 2. Press §. 3. Press 2 G, and then select the name of the function 4. Press ¸ to complete the instruction. When the instruction is executed, the TI-80 stores the expression in the displays the message To leave the...
-
Page 81: Evaluating Y= Functions In Expressions
Evaluating Y= Functions in Expressions You can the calculate the value of a Y= function at a specified value of X. Entering the To display the Functions in the , and Y= List @ « 2 G 1 c 2 G 2 @ d d Evaluating To evaluate the functions, first specify the value of X. -
Page 82: Selecting Functions
Selecting Functions Only functions that are selected (turned on) are graphed. All four functions may be selected at one time. Turning a You can select and deselect (“turn on” and “turn off”) Function “On” or functions on the “Off” function is highlighted. To change the selection status of a function: 1. -
Page 83: Defining The Viewing Window
The Window variables determine the boundaries and other attributes of the viewing window. The Window variables are shared by all graphing modes. The Viewing The viewing window of the TI-80 is the portion of the Window coordinate plane defined by... - Page 84 Leaving the To leave the Window screen: Window Screen ¦ ¦ Storing to a To store to a Window variable from the Home screen or from Window Variable a program, begin on a blank line. from the Home 1. Enter the value (which can be an expression) that you Screen or a Program 2.
-
Page 85: Displaying A Graph
Cleared drawings by selecting ¦ Changed or turned off a Note: Overlaying The TI-80 lets you graph one function at a time without Functions on a replotting every function. For example, enter press ,. Then enter Graph The second function is graphed on top of the original function. -
Page 86: Exploring A Graph With The Free-Moving Cursor
Exploring a Graph with the Free-Moving Cursor While a graph is displayed, you can move the free-moving cursor anywhere on the graph and display the coordinates of any location on the graph. You can press 6, 9, 7, or 8 to move the cursor around the Free-Moving Cursor graph. -
Page 87: Exploring A Graph With Trace
Press + to begin a trace. If the graph is not displayed Beginning a Trace already, the TI-80 displays it. The cursor is on the first selected function in the screen. The number of the function appears at the upper right of the display. - Page 88 To trace another selected function on the graph, press 8 or 7 Moving from to move the cursor to that function. The cursor moves to the Function to new function at the same Function upper right corner of the display changes. The cursor movement is based on the order of the selected functions in the graphed on the screen.
-
Page 89: Exploring A Graph With Zoom
Exploring a Graph with ZOOM Pressing * displays a menu that allows you to adjust the viewing window of the graph quickly in a variety of ways. All of the Zoom instructions are accessible from programs. ZOOM ZOOM Menu 1: ZBOX 2: ZOOM IN 3: ZOOM OUT 4: ZDECIMAL... - Page 90 Notice the different cursor. It indicates that you are using a Zoom instruction. the new viewing window, and then press ¸. The TI-80 adjusts the viewing window by YFACT , updates the Window variables, and replots the selected functions centered on the cursor location.
- Page 91 ZDECIMAL ZDECIMAL Window variables to preset values that set , and defines the XMIN = L3 . 1 XMAX = 3.1 XSCL = 1 ZSQUARE ZSQUARE window based on the current Window variables, but adjusted in only one direction so that circle look like a circle.
-
Page 92: Setting The Zoom Factors
Setting the Zoom Factors The Zoom factors, XFACT and YFACT, determine the extent of the change for the viewing window created by ZOOM IN or ZOOM OUT on a graph. Zoom Factors Zoom factors are positive numbers (not necessarily integers) greater than or equal to 1. - Page 93 Chapter 5: Parametric Graphing This chapter describes how to graph parametric equations on the TI.80. Before doing parametric graphing, you should be familiar with Chapter 4, Function Graphing. Getting Started: Path of a Ball Chapter Contents Defining and Displaying a Parametric Graph...
-
Page 94: Getting Started: Path Of A Ball
Getting Started: Path of a Ball Getting Started is a fast-paced introduction. Read the chapter for details. Graph the parametric equation that describes the path of a ball kicked at an angle of 60¡ with an initial velocity of 15 meters per second. (Ignore air resistance.) What is the maximum height? When does the ball strike the ground? 1. -
Page 95: Parametric
After selecting Parametric parametric Equations On this screen, you display and enter both the components. The TI-80 allows three parametric equations, each defined in terms of Defining Follow the same procedures as for function graphing (pages Parametric 4-5 to 4-6) to enter the two components that define a new Equations parametric equation. - Page 96 The TI-80 graphs only the parametric equations you select. Selecting The highlighted Parametric Equations indicates that the equation is selected. You may select any or all of the equations on the parametric To change the selection status of a parametric equation, press 6 to move the cursor onto the component and press ¸.
- Page 97 When you press ,, the TI-80 plots the selected Displaying a parametric equations. It evaluates both the Graph component for each value of intervals of As a graph is plotted, the TI-80 updates Note: Smart Graph applies to parametric graphs also (page 4-11).
-
Page 98: Exploring A Parametric Graph
Changes to the previous or next equation. The equation number shows in the upper right of the display. Cancels tracing. , the calculator displays values for , and are updated as you move the Trace and return, unless Smart Graph replots the graph. - Page 99 Chapter 6: Tables This chapter describes how to use tables on the TI.80. A table evaluates the selected functions from the Y= list and displays each value for the independent variable along with the evaluated value for each corresponding dependent variable.
-
Page 100: Getting Started: Roots Of A Function
Getting Started: Roots of a Function Getting Started is a fast-paced introduction. Read the chapter for details. Evaluate the function Y=X many sign changes are there, and where do they occur? 1. If necessary, select FUNC Press 2 # to display the screen. - Page 101 Defining the Independent Variable The independent variable for a table is the independent variable in the current graphing mode (X for FUNC mode and T for PARAM mode). You define the minimum value and the incremental value for the independent variable on the TABLE SETUP screen.
-
Page 102: Defining The Dependent Variable
Defining the Dependent Variable The selected functions from the Y= list define the dependent variables. You can have as many dependent variables as there are functions in the current graphing mode (four for FUNC mode and six for PARAM mode). Enter the functions to define the dependent variables in the From the Y= editor. -
Page 103: Displaying The Table
Displaying the Table The table displays up to six values for the independent variable, along with the six corresponding values of one dependent variable, at a time. Once the table is displayed, you can press 6, 7, 9, and 8 to move around and scroll the table, displaying other independent and dependent values. - Page 104 Displaying Other If you have more than one function defined and selected, press 9 to display other dependent variables. In the example Dependent below, Variables press 9 9 to see the values for 6-6 Tables TBLMIN=0 @TBL=1 Y1=X Y2=X –2. You can...
- Page 105 Chapter 7: Draw Operations This chapter describes how to use the DRAW operations of the TI.80. Before using the DRAW operations, you should be familiar with Chapter 4, Function Graphing. Getting Started: Shading a Graph Chapter Contents DRAW DRAW Drawing Lines...
-
Page 106: Getting Started: Shading A Graph
Getting Started: Shading a Graph Getting Started is a fast-paced introduction. Read the chapter for details. Shade the area below the function Y=X 1. If necessary, select FUNC the functions: @ a | ¸ @ « ¸ · @ ¸ (Be sure that is cleared or turned off.) 2. -
Page 107: Draw Draw Menu
DRAW DRAW Menu To display the DRAW DRAW menu, press 2 F. What happens when you select an item from this menu depends on whether or not a graph is displayed when you access the menu, as described under each operation. DRAW DRAW DRAW POINTS Menu... -
Page 108: Drawing Lines
Drawing Lines While a graph is displayed, LINE( lets you use the cursor to define a line on the graph. If a graph is not displayed, the instruction is copied to the Home screen. Directly on a To define a line directly on a graph: Graph 1. -
Page 109: Drawing Horizontal And Vertical Lines
Drawing Horizontal and Vertical Lines While a graph is displayed, HORIZONTAL and VERTICAL let you define lines on the graph using the cursor. If a graph is not displayed, the instruction is copied to the Home screen. Directly on a To draw horizontal and vertical lines directly on a graph: Graph 1. -
Page 110: Drawing A Function
GRIDON and GRIDOFF DRAW DRAW points on or off, respectively. The grid points correspond to the axes tick marks. The default for the TI-80 is 1. From the Home screen, press 2 F to display the DRAW 2. Press 3. Press ¸. The message... -
Page 111: Shading Areas On A Graph
Shading Areas on a Graph There are three shading instructions on the DRAW DRAW menu: SHADE_Y>, SHADE_Y<, and SHADE(. These instructions are not interactive; they must be entered on the Home screen or in the program editor. SHADE_Y> Shading Areas arguments (functions of above a Function SHADE_Y>... - Page 112 Shading Areas SHADE_Y< arguments (functions of below a Function SHADE_Y< SHADE_Y< When executed, the graph and shades the area below the function with a pattern. The patterns for shading are automatically assigned in the following order. Function 1 Function 2 Function 3 Function 4 Note that the patterns are assigned in reverse order from the...
- Page 113 Shading a Graph SHADE( that is below one specified function and above another, between two X values. It draws lowerfunc and upperfunc in terms of X on the current graph and shades the area that is specifically above lowerfunc and below upperfunc. Only the areas where lowerfunc <...
-
Page 114: Drawing Points
Drawing Points To display the DRAW POINTS menu, press 2 F 9. What happens when you select an item from this menu depends on whether or not a graph is displayed when you access the menu, as described under each operation. DRAW POINTS DRAW POINTS Menu... - Page 115 Procedures for using PT.OFF( 2) to turn off (erase) a point and PT.CHANGE( DRAW POINTS are the same as for When you use these instructions from the Home screen or a From the Home Screen or a program, you must specify the X-coordinate and the Program Y-coordinate of the point as arguments for the instructions.
-
Page 116: Clearing A Drawing
Clearing a Drawing All points, lines, and shading drawn on a graph with DRAW operations are temporary. They remain only until you execute a CLRDRAW (clear drawing) instruction or a change prompts Smart Graph to replot the graph, at which time all drawn elements are erased. - Page 117 Chapter 8: Lists This chapter describes the list features of the TI-80. The TI.80 can store up to six lists. A list, depending on available memory, can have up to 99 elements. Getting Started: Generating a Sequence Chapter Contents About Lists...
-
Page 118: Getting Started: Generating A Sequence
Getting Started: Generating a Sequence Getting Started is a fast-paced introduction. Read the chapter for details. Calculate the first eight terms of the sequence 1àA form. function returns a list of values based on five arguments: an expression, SEQ( a variable to be incremented, a beginning value, an ending value, and an increment. For this example, the beginning value is 1, the ending value is 8, and the increment is 1. -
Page 119: About Lists
About Lists The TI-80 has six list variables: L1, L2, L3, L4, L5, and L6. On the Home screen or in a program, you can use, enter, store, and display lists. The list names are on the keyboard. A list may have a maximum of 99 elements. - Page 120 You can use a list in a Lists in Graphing be used in such a way that it resolves to a single value; for example, Note: Unlike the TI-82 and TI-85, you cannot use a list to graph a family of curves. 8-4 Lists element expression.
- Page 121 A list can be used to input several values for certain functions. Notes about (Other chapters and Appendix A state when a list is valid.) Using Math Functions with The function is evaluated for each element in the list, and a Lists list is returned.
-
Page 122: List Ops Operations
LIST OPS Operations Press 2 = to display the list operations on the LIST OPS menu. LIST OPS OPS MATH Menu 1: SORTA( 2: SORTD( 3: DIM 4: SEQ( Note: SORTD( SORTA( SORTA( SORTD( descending, ¦ With one list name, they sort the elements of an existing list and update the list in memory. - Page 123 Accessing List of elements) of the specified list. Dimensions with Creating a List number of elements. The elements of the new list are zeros. with DIM length Redimensioning a List with DIM ¦ ¦ ¦ length (dimension, , item 3) returns the length (number LIST OPS list is used with §...
- Page 124 SEQ( SEQ( an expression, a variable to be incremented, a beginning value, an ending value, and an increment. in which each element is the result of the evaluation of expression with regard to variable for values ranging from begin to end at steps of increment. SEQ( The variable need not be defined in memory.
-
Page 125: List Math Operations
LIST MATH Operations Pressing 2 = 9 accesses the list math operations on the LIST MATH menu. LIST MATH Menu 1: MIN( 2: MAX( 3: MEAN( 4: MEDIAN( 5: SUM 6: PROD Note: MATH NUM MIN( MIN( MAX( LIST MATH the specified list. - Page 126 elements in the specified list. PROD PROD the elements of the list. PROD Sums and You can combine Products of upper Numeric Sequences x=lower To evaluate G 2 8-10 Lists (summation, LIST MATH list (product, LIST MATH list PROD expression(x) (N–1) from N=1 to 4: , item 5) returns the sum of the...
-
Page 127: Chapter 9: Statistics
Chapter 9: Statistics This chapter describes the tools for analyzing statistical data on the TI-80. These include entering lists of data, calculating statistical results, fitting data to a model, and plotting data. Getting Started: Building Height and City Size Chapter... -
Page 128: Getting Started: Building Height And City Size
Getting Started: Building Height and City Size Getting Started is a fast-paced introduction. Read the chapter for details. Determine a linear equation to fit the data below. Enter the data, and perform a linear regression. Then plot the data. Predict how many buildings of more than 12 stories you would expect to find in a city of 300 thousand people. - Page 129 5. Enter the remaining elements of ¸. ¸. ¸. ¸. ¸. 6. Press 9 to move to the first element of list 7. Enter the elements (number of buildings with more than 12 stories) of ¸. ¸. ¸. ¸. ¸. ¸.
- Page 130 After entering and sorting the data, define the STAT PLOTS and Window variables; then perform a linear regression (aX + b). 10. Press y ¸ to display the 11. Press to display the , if necessary, and press Í to turn cursor to PLOT1 on.
- Page 131 Store the regression equation into the Y= list and graph it. mode, press ( to display the 15. In FUNC Press M to clear other functions, if necessary. 16. Press L to display the 17. Press to select STATISTICS... display the VARS EQ 18.
- Page 132 You can enter expressions to define lists in the STAT list editor. For example, you can now define predicted values and residuals (the differences between the observed values and the predicted values) for this problem. 21. Press … to display the ~ ~ } to move the cursor onto the name 22.
- Page 133 Plot the residuals, and predict how many buildings of 12 or more stories there are in a city with a population of 300 thousand. 27. Press ( 6 ¸ to turn off 28. Press ), and change the Window variable values to best show the residuals.
-
Page 134: Setting Up A Statistical Analysis
Setting Up a Statistical Analysis The data for statistical analyses is stored in lists. The TI.80 has six list variables (Lã through Lè) that you can use in STAT calculations. Several types of statistical analyses are available. Follow these basic steps to perform statistical analyses. -
Page 135: The Stat List Editor
The STAT List Editor Pressing A accesses the STAT list editor and several instructions for use with lists (Lã through Lè). The instructions are discussed on page 9-13. STAT EDIT EDIT CALC Menu 1: EDIT... 2: SORTA( 3: SORTD( 4: CLRLIST Displaying the STAT STAT List Editor... -
Page 136: Viewing, Entering, And Editing Lists
Viewing, Entering, and Editing Lists The STAT list editor has two “contexts,” viewing and editing. The current context determines the result of a key press. In both contexts, the full value of the highlighted element is displayed on the bottom line. Viewing Context In the viewing context, you can move quickly from one list element to the next. - Page 137 Deleting a List You can delete the contents of a list in several ways: ¦ With the ¦ Through the ¦ In the name and then pressing M ¸. ¦ In the ¦ On a command line, by entering Editing a List To edit a list element: Element 1.
- Page 138 You can enter or edit an entire list by moving the cursor to a list name on the top line of the STAT list editor and then pressing ¸. The bottom line displays L n =L n 1, if there is data already in the list. Type any expression that returns a list, and press ¸.
-
Page 139: Sorting And Clearing Lists
Sorting and Clearing Lists Items 2 through 4 on the STAT EDIT menu SORTA(, SORTD(, and CLRLIST let you sort or clear list data. Pressing A displays these instructions, and selecting an item copies the name of the instruction to the Home screen. Note that SORTA( and SORTD( are the same as SORTA( and SORTD( on the LIST OPS menu (Chapter 8). -
Page 140: Statistical Analysis
Statistical Analysis Pressing A 9 accesses the STAT CALC menu, where you select and perform statistical calculations. The TI-80 can analyze one-variable or two-variable statistics. Both can have associated frequency lists. STAT CALC EDIT CALC Menu 1: 1-VAR STATS 2: 2-VAR STATS... -
Page 141: Types Of Statistical Analysis
Types of Statistical Analysis These calculations return statistical results based on the list(s) you reference. If you reference a third list name as an argument for 2-VAR STATS or any of the regression models, the list is interpreted as the frequencies of occurrence for the data pairs in the first two lists. - Page 142 QUADREG QUADREG data to the second-order polynomial y=ax fit; for four or more, it is a polynomial regression. At least three data points are required. QUADREG QUADREG LINREG LINREG (a+bX) (a+bX) the data to the model equation y=a+bx using a least-squares fit LINREG (a+bX) LINREG (a+bX) LNREG...
-
Page 143: Statistical Variables
Statistical Variables The statistical variables are calculated as indicated below. Some are displayed when 1-VAR STATS or 2-VAR STATS are calculated. You can access these variables for use in expressions through the VARS STATISTICS... menus. If you edit a list, all statistical variables are cleared. Variables v (mean of X values) GX (sum of X values) -
Page 144: Statistical Plotting
Statistical Plotting You can plot statistical data that you have entered in lists. The types of plots available include scatter plots, x-y lines, box and whisker plots, and histograms. You can define up to three plots at a time. To plot statistical data: Steps 1. - Page 145 ¾ Box Plot (box plot) plots one-variable data. The whiskers on the plot ¾ extend from the minimum data point in the set ( first quartile ( maximum point ( median ( Box plots are plotted with respect to ignore first plots at the top of the screen and the second plots in the middle.
- Page 146 Defining the To define plots: Plots 1. Press 2 2. Select the plot to define ( 3. If you wish to plot the statistical data immediately, select 4. Select the type of plot. The options change appropriately. ¦ ¦ ¦ ¦...
- Page 147 Turning Plots Off PLOTSOFF off or on from the Home screen or a program. Used without or On plot#, they turn all plots off or all plots on. Used with plot#, they turn specific plots off or on. PLOTSOFF PLOTSOFF PLOTSON For example, plots off and then turns...
-
Page 148: Statistical Analysis In A Program
Statistical Analysis in a Program You can enter statistical data, calculate statistical results, and fit data to models from a program. Entering Stat Enter the statistical data directly into lists (Chapter 8) in the Data program. Statistical To calculate statistical results or fit data to a model from a Calculations program: 1. -
Page 149: Statistical Plotting In A Program
Statistical Plotting in a Program To display a statistical plot, you may define the plot(s), then turn the plot(s) on, and then display the graph. If you do not define the plot, the current definitions are used. To define a statistical plot in a program: Defining a Stat Plot in a 1. - Page 150 Displaying a Stat To display a plot, use any of the Zoom instructions (Chapter 4), or use the Plot from a Program 9-24 Statistics instruction (Chapter 10). DISPGRAPH...
- Page 151 Chapter 10: Programming This chapter describes specific programming instructions and explains how to enter and execute programs on the TI.80. Getting Started: Rolling a Die Chapter Contents About TI-80 Programs Creating and Executing Programs Editing Programs PRGM CTL PRGM I/O...
-
Page 152: Getting Started: Rolling A Die
Getting Started: Rolling a Die Getting Started is a fast-paced introduction. Read the chapter for details. A program is a set of commands that can be executed sequentially, as if they had been entered from the keyboard. Write a simple program to simulate the rolling of a single die. - Page 153 7. Press I 6 to access the (to copy RANDINT( § 2 ¢ c ? integers from 1 to 6 and store them into element . Press ¸ to complete the instruction. 8. Press K 9 to select copied to the cursor location. Press 2 ¢ c ? d.
-
Page 154: About Ti-80 Programs
About TI-80 Programs Most features of the TI.80 are accessible from programs. Programs can access all variables and named items. The number of programs that the TI.80 can store is limited only by available memory. Programs are identified by names of up to seven characters, Notes about beginning with a letter. -
Page 155: Creating And Executing Programs
Creating and Executing Programs Access the program editor by pressing K. Then either choose to create a new program or edit an existing program. In general, anything that can be executed from the Home screen can be included in a program. A program command always begins with a colon (:). -
Page 156: Editing Programs
Inserting a New To insert a new command line, position the cursor where you want to insert the new line, press 2 / to put the TI-80 in Command Line insert mode, and then press ¸. -
Page 157: Prgm Ctl (Control) Instructions
7: LBL 8: GOTO 9: PRGM_ 0: RETURN A: STOP Program control instructions tell the TI-80 which command to Controlling execute next in a program. Program Flow define to determine what command to execute next. The condition frequently uses relational tests (Chapter 2), such as IF A<7:A+1!A... - Page 158 IF-THEN THEN commands if the condition is true (nonzero). :THEN command if true :END command IF-THEN-ELSE ELSE group of commands if the condition is false (zero). :THEN command if true :ELSE command if false :END command 10-8 Programming , item 2) following an PRGM CTL , item 5) identifies the end of the group.
- Page 159 FOR( FOR( incrementing. It increments the variable from the beginning value to the ending value, by the specified increment. The ending value is a maximum or minimum value that is not to be exceeded. The increment is optional (if not specified, 1 is used) and can be negative (ending value <...
- Page 160 GOTO program. The label is one character (A–Z, 0–9, or q). GOTO the command line with the same label. GOTO PRGM_ PRGM_ as subroutines (pages 10-14). When you select copied to the cursor location. You may type the letters of an existing program name.
-
Page 161: Prgm I/O (Input/Output) Instructions
PRGM I/O (Input/Output) Instructions The PRGM I/O (program input/output) instructions are accessed only from the program editor. They control input to and output from a program, allowing you to enter values and display answers during program execution. While the program editor is displayed, press K. The selected menu item is copied to the cursor location. - Page 162 Storing a INPUT execution. The value for the variable may be a real number, a Variable Value with INPUT list, or (a real number, an expression, or a list), and press ¸. The value is evaluated and stored to the variable, listname, or function, and the program resumes execution.
- Page 163 Displaying the DISP Home screen. To view the Home screen during program Home Screen execution, follow the Displaying DISP displays the value of each. Values and Messages DISP DISP ¦ ¦ ¦ For example, PAUSE temporarily so that you can examine the screen. Press ¸ to resume program execution.
-
Page 164: Calling Other Programs
Calling Other Programs On the TI.80, any program can be called from another program as a subroutine. Enter the name of the program to use as a subroutine on a line by itself. Calling a To call one program from another, begin on a blank line in the Program from program editor and do one of the following. - Page 165 Chapter 11: Applications This chapter contains application examples that incorporate the TI.80 features described in the preceding chapters. Several of the examples use programs. Probability Experiments: Coins, Dice, and Spinners Chapter Contents The Unit Circle and Trigonometric Curves Program: Newton’s Numerical Solve Routine...
-
Page 166: Probability Experiments: Coins, Dice, And Spinners
Probability Experiments: Coins, Dice, and Spinners The RANDINT( (random integer) function can be used for probability experiments. RANDINT( takes two arguments that define a set of integers from which to draw for the probability experiments below. Using Problem probability experiments that employ the toss of a coin, the roll of two dice, and the spin of a wheel. -
Page 167: The Unit Circle And Trigonometric Curves
The Unit Circle and Trigonometric Curves You can use the parametric graphing feature of the TI.80 to show the relationship between the unit circle and any trigonometric curve. Problem Graph the unit circle and the sine curve to demonstrate graphically the relationship between them. -
Page 168: Program: Newton's Numerical Solve Routine
Program: Newton’s Numerical Solve Routine This program uses the Newton-Raphson method to find the roots (zeros) of a function numerically. Find the roots of e x ì3X. Problem Program This program uses the Newton-Raphson method to find a root initial guess. One way to make this initial guess is to graph and trace the function, and then enter X as the guess. - Page 169 5. Press + and move the cursor close to the left root. The variables X and Y are updated as you move the cursor. 6. From a blank line on the Home screen, execute the program NEWTON as the initial guess, and press ¸ repeatedly. 7.
-
Page 170: Program: Numerical Integration
Program: Numerical Integration This program uses Simpson’s method to estimate the definite integral of a function. Problem Estimate the definite integral of ‰ and graph the area of the integral. Program The program estimates the definite integral for Simpson’s method. It prompts for the lower and upper limits of integration and the number of divisions. - Page 171 3. Set the Window variables. 4. Execute the program entering the limits and divisions as you are prompted. 5. You can display the calculated area graphically, using from a clear Home screen. SHADE( SIMPSON from a clear Home screen, Applications 11-7...
-
Page 172: Program: Window Variables Store And Recall
Program: Window Variables Store and Recall The program below lets you store the values for the current Window variables, and it lets you display a graph using previously stored values. It also demonstrates a method for including menus in a program. PROGRAM:WINMEM Program :CLRHOME... - Page 173 Procedure Follow this procedure to see how the program works. 1. Execute the program The program prompts with three options. ¦ Store the Window variables you are currently using. ¦ View a graph using a previously stored set of Window ¦...
-
Page 174: Graphing The Inverse Of A Function
Graphing the Inverse of a Function You can use the parametric graphing feature of the TI.80 to graph the inverse relation of any function by defining the function in Xã Xä and Yä The function Y=.2X Problem form as X... - Page 175 5. Enter the expressions to define the line Y=X, about which the graph of the function and the graph of its inverse are symmetric. That is, the reflection of the graph of the function through the line Y=X produces the graph of its inverse.
-
Page 176: Graphing A Piecewise Function
Graphing a Piecewise Function The test functions of the TI.80 can be used to build piecewise defined functions. Define and graph this piecewise defined function. Problem f(x)= be used to build piecewise defined functions. For example, when x is 4 (x 3) is false and will return 0. - Page 177 4. Add the third piece of the function to f(x)=6ìx for x 5. It is entered as greater than or equal to 5, the test (x 5) returns 1. The third piece of the function is then equivalent to (6ìx) 1. When X is less than 5, the test (x 5) returns 0.
-
Page 178: Graphing Inequalities
Graphing Inequalities Examine the inequality explore the values of X where the inequality is true and where it is false. 1. Press 3. Select Procedure settings. Press 2 ", and turn off all stat plots. 2. Press (, and turn off all functions. Enter the left side of the inequality as of the inequality as false. -
Page 179: Graphing A Polar Equation
Graphing a Polar Equation The parametric graphing feature of the TI.80 can be used to graph polar equations. Graph the Spiral of Archimedes, the name given to the curve defined by the polar equation r=aq. A polar equation r=f(q) can be graphed by applying the Problem conversion formulas, x=f(q) cos(q) and y=f(q) sin(q). -
Page 180: Program: Guess The Coefficients
Program: Guess the Coefficients This program generates a function in the form A SIN(BX) with random integer coefficients between 1 and 10. Seven data points from the function are plotted. You are prompted to guess the coefficients, which are plotted as C SIN(DX). The program continues until your guess is correct. -
Page 181: Checking Available Memory
Chapter 12: Memory Management This chapter describes how to manage memory on the TI.80. To increase the amount of memory available for use, occasionally you may want to delete stored items that you are no longer using. You can also reset the calculator, erasing all data and programs. - Page 182 Checking Available Memory The MEMORY CHECK RAM screen displays the total amount of available memory and the amount of memory used by each variable type. This allows you to determine the amount of memory available for new items such as programs and the amount used by old items that you no longer need.
- Page 183 Deleting Items from Memory You can delete the contents of any variable (real number, list, or Y= function) or program from memory to increase available memory. Deleting an Item To delete an item: 1. Press 2 2. Press 2 to select currently in use and the amount of memory used by each is displayed.
- Page 184 Resetting the TI-80 Resetting the TI.80 restores memory to the factory settings, including deleting the contents of all variables and programs and resetting all system variables to the original settings. Because you can increase available memory by deleting individual items, you should rarely need to reset the TI.80.
-
Page 185: Table Of Ti-80 Functions And Instructions
Appendix A: Tables and Reference Information This appendix provides a list of all TI-80 functions that you can use in expressions and instructions that you can use on the Home screen and in programs. It also includes other reference information that can help you. - Page 186 Table of TI-80 Functions and Instructions A function (F) returns a value or a list and can be used in expressions; an instruction initiates an action. Some, but not all, have arguments. † indicates that the instruction is available for copying only from the program editor.
- Page 187 CONNECTED value list COSê value COSê list Cube: value ò Cube: list ò ò‡ Cube Root: value ò‡ Cube Root: list value 8DEC 8DEC list DEGREE Degree Notation: value ¡ list length !DIM listname DISP DISP " text " DISP valueA valueB .
- Page 188 DISPGRAPH à Division: valueA valueB à Division: list value Division: value à list Division: listA à listB DRAWF expression power list ELSE IF:THEN:ELSE Equal: valueA=valueB Equal: listA=listB Equal: list value or value list Exponent: í exponent Exponent: value í exponent Exponent: list í...
- Page 189 EXPREG Xlistname Ylistname EXPREG Xlistname Ylistname freqlistname Factorial: value Factorial: list FLOAT FNOFF FNOFF function# function# . . . FNON FNON function# function# . . . FOR( variable begin commands . . . :END FOR( variable begin increment commands . . . :END Fits Xlistname and Ylistname to the...
- Page 190 FPART value FPART list value 8FRAC list 8FRAC FUNC GOTO label Greater Than: valueA>valueB Greater Than: listA > listB Greater Than: list value or > value > list Greater Than or Equal: ‚ valueA valueB Greater Than or Equal: listA ‚...
- Page 191 HORIZONTAL condition commandA commands condition commands :THEN: :END condition :THEN: commands commands :ELSE: :END INPUT INPUT variable INPUT " text ", variable value list integerA INT÷ integerB listA INT÷ listB list INT÷ integer or integer INT÷ list ê Inverse: value Inverse: list ê...
- Page 192 IPART value IPART list label Less Than: valueA < valueB Less Than: listA < listB Less Than: list < value or value < list Less Than or Equal: valueA valueB Less Than or Equal: listA listB Less Than or Equal: ...
- Page 193 LNREG Xlistname Ylistname LNREG Xlistname Ylistname freqlistname value list MANSIMP MAX( valueA valueB MAX( list listA listB MAX( MAX( list value value list MAX( MEAN( list MEAN( list frequency list MEDIAN( MEDIAN( list frequency MIN( valueA valueB list MIN( Fits Xlistname and Ylistname to the logarithmic model.
- Page 194 MIN( listA listB MIN( list value MIN( value list Multiplication: valueA valueB Multiplication: value list or list value Multiplication: listA listB valueA valueB value list list value listA listB NDERIV( expression variable value NDERIV( expression variable value A-10 Tables and Reference Information Returns a list of the smaller of each pair of elements in listA and...
- Page 195 ë Negation: value ë Negation: list NORMAL Not Equal: valueA ƒ valueB ƒ Not Equal: listA listB Not Equal: list ƒ value or ƒ value list valueA valueB value list list value listA listB 1-VAR STATS listname 1-VAR STATS Xlistname freqlistname PARAM Returns the negative of...
- Page 196 PAUSE PLOT type Xlist Ylist PLOT type Xlist Ylist mark PLOT n(type Xlist PLOT type Xlist Flist PLOTSOFF PLOTSOFF plot# plot# . . . PLOTSON plot# plot# . . . PLOTSON Power: value power Power: list power Power: value list Power: listA listB Power of ten:...
- Page 197 PRGM_ programname PROD list P8Rx( P8Rx( Rlist qlist P8Rx( qlist Rlist P8Rx( P8Ry( P8Ry( Rlist qlist P8Ry( qlist P8Ry( Rlist PT-CHANGE( PT-OFF( PT-ON( Executes the program programname. (I) Returns the product of elements in list. (F) Returns the rectangular coordinate , given the polar coordinates R and q.
- Page 198 PWRREG Xlistname Ylistname PWRREG Xlistname Ylistname freqlistname QUADREG Xlistname Ylistname QUADREG Xlistname Ylistname freqlistname RADIAN Radian Notation: value RAND RANDINT( lower upper lowerlist upper RANDINT( lower upperlist RANDINT( lowerlist RANDINT( upperlist valueA REMAINDER( valueB REMAINDER( value list A-14 Tables and Reference Information Fits Xlistname and Ylistname to the power model.
- Page 199 REMAINDER( list value REMAINDER( listA listB Return nthroot x‡ value nthroot list x‡ list x‡ value listA x‡ listB ROUND( value ROUND( value #decimals list ROUND( ROUND( list #decimals R8Pr( R8Pr( Xlist R8Pr( Ylist Returns a list of remainders from the division of each element in list by value.
- Page 200 R8Pr( Xlist Ylist R8Pq( R8Pq( Xlist R8Pq( Ylist R8Pq( Xlist Ylist seq( expression variable begin increment sequential SHADE( lowerfunc upperfunc SHADE( lowerfunc upperfunc resolution SHADE( lowerfunc upperfunc resolution Xleft A-16 Tables and Reference Information Returns a list of coordinates, given the X coordinates in Xlist and the Y coordinates in Ylist.
- Page 201 SHADE( lowerfunc upperfunc resolution Xleft Xright SHADE_Y> func1 func2 SHADE_Y< func3 func4 fraction úSIMP fraction factor )úSIMP SIMUL value list SINê value SINê list SORTA( listname SORTA( keylistname dependlist1 dependlist2 . . . Shades the area above lowerfunc, below upperfunc, to right of =Xleft, to left of =Xright, and with resolution (1 through 9).
- Page 202 SORTD( listname) SORTD( keylistname dependlist1 dependlist2 . . . ñ Square: value Square: list ñ Square Root: ‡ value Square Root: ‡ list STOP Store: value variable Store: list listname Store: Yn or " expression "! " expression "! XnT or "...
- Page 203 list TANê value list TANê THEN IF:THEN TRACE 2-VAR STATS Xlistname Ylistname 2-VAR STATS Xlistname Ylistname freqlistname VERTICAL ZBOX ZDECIMAL ZOOM IN ZOOM OUT ZSQUARE ZSTANDARD ZTRIG Returns a list of the tangent for each list element. (F) Returns the arctangent of value.
- Page 204 TI-80 Menu Map Menus begin in the upper left of the keyboard. Default values are shown. ÚÁÄÄÄÄÄÄÄÄÄÄÄÄÄÄ¿ mode) FUNC PARAM Xã Yã Xä Yä Xå Yå TblSet ÚÄÄÙ TABLE SETUP TBLMIN=0 @TBL=1 ÚÄÙ NORMAL SCI FLOAT 0123456789 RADIAN DEGREE aÀb º...
- Page 205 2 " ÚÄÄÄÄÄÙ STAT PLOTS 1:PLOT1 OFF ¼ L1 L2 Â 2:PLOT2 OFF ¼ L1 L2 Â 3:PLOT3 OFF ¼ L1 L2 Â 4:PLOTSOFF 5:PLOTSON Screen for ¾ or ¿ plots (1-variable plots) PLOTn ON OFF TYPE: ¼ ½ ¾ ¿ XL: L1L2L3L4L5L6 F: 1L1L2L3L4L5L6 Screen for ¼...
- Page 206 ÚÄÄÁÄÄÄÄÄÄÄÄÄ¿ MATH 1:SORTA( 1:MIN( 2:SORTD( 2:MAX( 3:DIM 3:MEAN( 4:SEQ( 4:MEDIAN( 5:SUM 6:PROD ÚÁÄÄÄÄÄÄÄÄÄÄÄÄÂÄÄÄÄÄÄÄÄÄÄÄÄÄ¿ MATH 1:INT 1:ROUND( 2:4DEC 2:IPART 3:FPART ‡ 4:INT ‡ 5:MIN( 6:NDERIV( 6:MAX( 7:REMAINDER( ÚÙ FRACTION 1:4SIMP 2:4bºc 3:4aÀbºc 4:4FRAC 5:4DEC A-22 Tables and Reference Information 1:RAND 2:nPr 3:nCr 5:RANDINT( ÚÄÄÄÄÙ...
- Page 207 ÚÁÄÄÄÄÄÄÄÄÂÄÄÄÄÄÄÄÄÄ¿ EXEC EDIT 1:name 1:name 1:CREATE NEW 2:name 2:name 3:name 3:name © © ÚÄÄÄÄÁÄÄÄÄÄÄÄÄÄÄ¿ DRAW POINTS 1:CLRDRAW 1:PT-ON( 2:LINE( 2:PT-OFF( 3:HORIZONTAL 3:PT-CHANGE( 4:VERTICAL 5:DRAWF 6:SHADE_Y> 7:SHADE_Y< 8:SHADE( 9:GRIDON 0:GRIDOFF K (in program editor) ÚÁÄÄÄÄÄÄÄÄÂÄÄÄÄÄÄÄÄÄÄÄÄ¿ 1:IF 1:INPUT 2:THEN 2:DISP 3:ELSE 3:DISPGRAPH 4:FOR( 4:CLRHOME 5:END...
- Page 208 ÚÄÙ VARS 1:WINDOW 2:STATISTICS… 3:TABLE… 4:SIMPFACTOR… L á WINDOW… ÚÄÄÄÄÄÄÁÄÄÄÄÄ¿ 1:XMIN 2:XMAX 3:XSCL 4:YMIN 5:YMAX 6:YSCL 7:@X 8:@Y 9:XFACT 0:YFACT L á STATISTICS… ÚÄÄÄÄÄÄÁÄÄÂÄÄÄÄÄÄÄÄÄÄÂÄÄÄÄÄÄÄÄÄÄ¿ 3:Sx 4:sx 6:Sy 7:sy 8:MINX 9:MAXX 0:MINY A:MAXY ÚÄÄÄÄÁÄÄÄÄÄÄÄÄÄÂÄÄÄÄÄÄÄÄÄÄÄÄÄÄÄ¿ XT/YT 1:Y1 1:Xã 2:Y2 2:Yã 3:Y3 3:Xä 4:Y4 4:Yä...
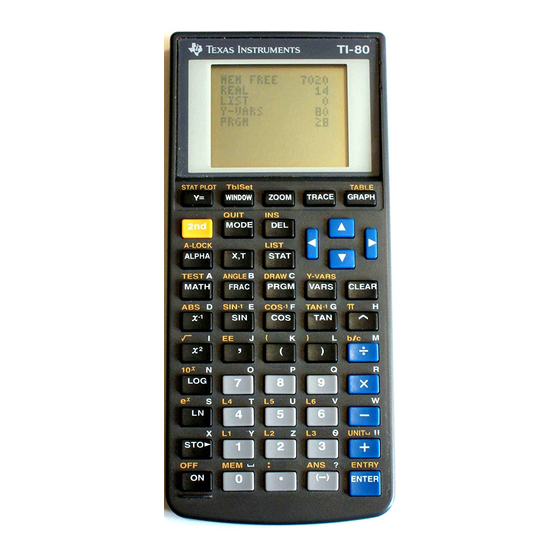
- Page 209 2 ¯ ÚÄÙ MEMORY 1:CHECK RAM… 2:DELETE… 3:RESET… 2 ¯ á CHECK RAM… ÚÄÄÄÄÙ MEM FREE REAL LIST Y-VARS PRGM â 2 ¯ á DELETE… ÚÄÄÄÄÄÄÙ 7014 DELETE: úname memory name memory name memory © (names include defined programs, lists, equations, and user variables, in that order.) Tables and Reference Information A-25...
- Page 210 TI-80 Variables The variables listed below are used by the TI-80 in various ways. Some have restrictions on their use. User Variables The variables either decimals or fractions. You may store to these variables. The TI-80 can update you may wish to reserve those variables for graphing activities.
- Page 211 Appendix B: Service and Warranty Information This appendix provides supplemental information that may be helpful as you use the TI.80. It includes procedures that may help you correct problems with the calculator. Battery Information Appendix Contents Accuracy Information In Case of Difficulty...
-
Page 212: Appendix B: Service And Warranty Information
Battery Information The TI.80 uses two CR2032 lithium 3-volt batteries. As you use the TI.80, the battery voltage will gradually drop, When to Replace and the display will dim. You can adjust the contrast to darken the Batteries the display when this happens. If the display is dim and adjusting the contrast to level 9 does not make it dark enough, you should replace the batteries. - Page 213 (Continued) b. Replace the plastic slide cover over the keys. c. Turn the calculator so that the back is facing you. Placing your thumb on the ridged area of the plastic battery compartment cover, push down slightly and slide the cover to the right until you can lift off the cover.
- Page 214 Changing the Batteries (Continued) Slide the metal battery cover away from the battery. The battery pops up. Remove the old battery. Insert a new battery, positive side (+) Hold the new battery in place and slide the metal battery cover back into position over the battery. B-4 Service and Warranty Information...
- Page 215 Changing the Batteries (Continued) Push the red switch all the way down to free the metal battery cover over the upper battery. Slide the metal battery cover away from the battery. Remove the old battery. Insert a new battery, positive side (+) Service and Warranty Information B-5...
- Page 216 Push the red switch to its center position to lock the metal covers and batteries into place. Note: The calculator will not turn on unless the red switch is in the center position. B-6 Service and Warranty Information...
- Page 217 Batteries (Continued) Replace the plastic battery compartment cover. Turn the calculator on and adjust the contrast display. To adjust the display contrast, press and release the 2 key. To increase the contrast (darken the screen), press and hold 7. To decrease the contrast (lighten the screen), press and hold 8.
-
Page 218: Accuracy Information
Accuracy Information To maximize accuracy, the TI.80 carries more digits internally than it displays. Values in memory are stored using up to 13 digits with a Computational two-digit exponent. Accuracy ¦ You can store values in the Window variables using up to 10 digits (13 digits for ¦... - Page 219 Function Following is a table of functions and the range of input values for each. Limits Function ‡x Function Results Following is a table of functions and the range of the result for each. Function Input Values 0 | x | < 10 -1 ...
-
Page 220: In Case Of Difficulty
See Chapter 12 for additional information about memory management. 5. If the dotted-line busy indicator is displayed, a graph or program is paused, and the TI-80 is waiting for input. Press ¸ to continue or ´ to break. B-10 Service and Warranty Information and delete some items from DELETE... -
Page 221: Error Conditions
Error Conditions When the TI.80 detects an error, it displays ERR: message and the error menu. The general procedure for correcting errors is described on page 1.22. The error messages, their possible causes, and suggestions for correction are shown below. - Page 222 You are attempting to enter, or you have calculated, a number that is beyond the range of the calculator. This error does not occur during graphing. The TI-80 allows for undefined values on a graph. B-12 Service and Warranty Information...
- Page 223 The Window variables are too small or too large to graph correctly. This can occur if you attempt to zoom in or out so far that you are not within the numerical range of the calculator. ZOOM A point or a line, rather than a box, is defined in math error has resulted from a Zoom operation.
-
Page 224: Support And Service Information
For technical questions, call the Programming Assistance Group of Customer Support: phone: Customers outside the U.S., Canada, Puerto Rico, and the Virgin Islands Contact TI by e-mail or visit the TI e-mail: Internet: Product Service Customers in the U.S. and Canada Only Always contact Texas Instruments Customer Support before returning a product for service. -
Page 225: Warranty Information
TI strongly recommends that you insure the product for value prior to mailing. Software. Software is licensed, not sold. TI and its licensors do not warrant that the software will be free from errors or meet your specific requirements. All software is provided “AS IS.”... - Page 226 TI strongly recommends that you insure the product for value if you mail it. Software. Software is licensed, not sold. TI and its licensors do not warrant that the software will be free from errors or meet your specific requirements.
- Page 227 Index a variable, 9-15 to 9-17, A-26 aÀbºc MODE , 1-9, 1-11, 3-4, A-2 aÀbºc , 3-8, 3-9, A-2 ABS, 2-6, A-2 Absolute value, 2-6, A-2 Accuracy, 4-12, B-8, B-9 Addition: +, 2-4, A-2 ALPHA ALPHA-LOCK , 1-8 Angle entry indicators (¡, A-2, A-14 ANGLE menu, 2-14, 2-15...
- Page 228 (Cont.) Conversions decimals, 2-7, 2-8, 3-8, 3-10, 82, fractions, 3-8, 3-10, A-6 polar to rectangular, 2-14, 2-15, A-13 rectangular to polar, 2-14, 2-15, A-15, A-16 Coordinates, 4-12 Correlation coefficient r, 9-15 to 9-17 COS –1 , 2-4, A-3, B-9 Cosine, 2-4, A-3, B-9 PRGM ) menu, 10-7 to 10-10 Cube:...
- Page 229 (Cont.) Equation Operating System, 1-20, 1-21 Equations, parametric, 5-2 to 5-6 Erasing a program, 10-4, 12-3 Errors, 1-22, 8-5, 10-4, B-11 to B-13 Evaluating expressions, 1-6, 3-4 Evaluating functions, 4-7 Executing programs, 10-5 Exponent: , 1-7, A-4 Exponential regression, 9-14, 9-16, A-5 EXPREG , 9-14, 9-16, A-5...
-
Page 230: Menu Map
keyboard, 2 (lists), 8-2 to 8-5, A-26 LABEL error, B-12 Labels (program), 10-10 Last Answer, 1-16, 10-4 Last Entry, 1-14, 1-15, 10-4 , 10-7, 10-10, A-8, B-12 Less than: <, 2-16, A-8 Less than or equal: , 2-16, A-8 LINE( , 7-3, 7-4, A-8 Line (stat), 9-18, 9-20 to 9-21 Linear regression, 9-15, 9-16, A-8... - Page 231 n (statistics), 9-17, A-26 Natural log, 2-5, A-8 nCr, 2-12, 2-13, A-10 NDERIV( , 2-7, 2-9, A-10 Negation: - , 1-21, 2-6, A-11 NEST LEVEL error, B-12 NORMAL MODE , 1-9, 1-10, A-11 Not equal: ƒ, 2-16, A-11 nPr, 2-12, A-11 ) menu, 2-10, 2-11 MATH Numerical derivative, 2-7, 2-9, A-10...
- Page 232 (Cont.) Residuals, 9-6, 9-7 RETURN , 10-7, 10-10, A-15 ‡, 2-7, 2-8, A-15, B-9 root ROUND( , 2-10, A-15 Running programs, 10-5 R8Pr(, R8Pq(, 2-14, 2-15, A-15, A-16 plot, 9-18, 9-20 SCATTER SCI MODE , 1-7, 1-9, 1-10, A-16 Scientific notation, 1-7, 1-9, 1-10, A-16 2nd, 1-8 Selecting from a menu, 4, 1-17...
- Page 233 (Cont.) Turning functions on and off, 1-19, 4-8, 5-4 Turning the TI-80 on and off, 3, , 9-14, 9-15, A-19 2-VAR STATS Two-variable statistics, 9-14, 9-15, A-19 UNDEFINED error, B-13 Variables, x, 1-12, 1-13, A-26 VARS menu, 1-19 VERTICAL , 7-3, 7-5, A-19 Vertical line, 7-5 Viewing rectangle, viewing window.
- Page 234 TI-80 STAT PLOT FRAC...
Need help?
Do you have a question about the TI-80 and is the answer not in the manual?
Questions and answers