Advertisement
Quick Links
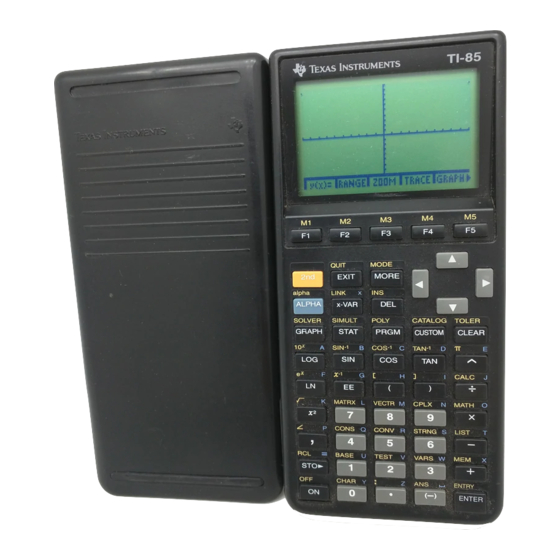
PART B
T
I
EXAS
NSTRUMENTS
C
ALCULATORS
Setup
When using this Guide, you should always, unless instructed otherwise, use the calculator setup
specified below for both the TI-85 and TI-86.
(
) . Use the following instructions to choose the settings shown in Figure 1. Check
2nd
MORE
MODE
the window format with
¥
If you do not have the darkened choices shown in Figures 1 and 2 (below), use the arrow
keys to move the blinking cursor over the setting you want to choose and press
¥
Press
or
EXIT
TI-85, 86 Basic Setup
For the TI-85
Return to the home screen with
setup as shown in Figure 3 by pressing
(
F2
Figure 3.) Press
For the TI-86
Return to the home screen with
setup
2nd
Copyright © Houghton Mifflin Company. All rights reserved.
GRAPH
MORE
F3
(
) to return to the home screen.
2nd
EXIT
QUIT
FIGURE 1
‹
)
(
)
}
STO
7
L
ALPHA
or
EXIT
2nd
as
shown
– (
)
(
)
LIST
F5
OPS
MORE
TI-85/TI-86 G
Before you begin, check the basic setup with
(
) . Choose the settings shown in Figure 2.
FORMT
TI-85, 86 Window Setup
FIGURE 2
or
EXIT
2nd
EXIT
2nd
1
ENTER
2nd
ENTER
(
) to return to the home screen.
EXIT
QUIT
or
EXIT
2nd
EXIT
in
Figure
MORE
MORE
RAPHING
.
ENTER
(
) . Specify the statistical
QUIT
–
(
)
(
)
LIST
F1
{
(
)
2
ENTRY
(
) . Specify the statistical
QUIT
6
by
pressing
(
)
F3
SetLE
ALPHA
0
. (See
ENTER
,
(
) 1
7
L
B-1
Advertisement

Related Manuals for Texas Instruments TI-85


Summary of Contents for Texas Instruments TI-85
- Page 1 ALCULATORS Setup When using this Guide, you should always, unless instructed otherwise, use the calculator setup specified below for both the TI-85 and TI-86. ) . Use the following instructions to choose the settings shown in Figure 1. Check MORE...
-
Page 2: Basic Operation
TI-86 Note: Because appropriate TI-86 computer linking software had not yet been perfected at the time this material was written, TI-86 screens in this Guide appear smaller than the TI- 85 screens. Screens that appear the same on both calculators are shown for the TI-85. Basic Operation You should be familiar with the basic operation of your calculator. -
Page 3: Storing Values
æ ö ç ÷ Calculate ç ÷ 4*15 + 895 è ø (If you wish to clear the home screen, press 3. ANSWER DISPLAY When the denominator of a fraction has no more than three digits, your calculator can provide the answer in fraction form. When an answer is very large or very small, the calculator displays the result in scientific notation. - Page 4 TI-85/TI-86 Graphing Calculators Choose ) to position the cursor to the place the error Goto occurred so that you can correct the mistake or choose ) to begin a new line on the home screen. Quit Copyright © Houghton Mifflin Company. All rights reserved.
-
Page 5: Drawing A Graph
Chapter 1 Ingredients of Change: Functions and Linear Models & 1.1 Fundamentals of Modeling There are many uses for a function that is entered in the graphing list. Graphing the function in an appropriate viewing window is one of these. Because you must enter all functions on one line (that is, you cannot write fractions and exponents the same way you do on paper) it is very important to have a good understanding of the calculatorÕs order of operations and to use parentheses whenever they are needed. - Page 6 TI-85/TI-86 Graphing Calculators Remove the lower menu with ZOOM MORE Notice that the graphics screen is blank. TI-85 Press EXIT by ZDECM. TI-86 Press EXIT by ZDECM. ¥ Both xMin and xMax are the settings of the left and right edges of the viewing screen, and yMin and yMax are the settings for the lower and upper edges of the viewing screen.
- Page 7 Chapter 1 Both Press ) to draw the graph of GRAPH = 1000(1 + 0.05^x) in the new view. removes the menu from the CLEAR bottom of the screen if you wish to see more of the graph. Copyright © Houghton Mifflin Company. All rights reserved.
- Page 8 (Delete all other functions that may be entered in other locations.) Before doing what follows, access the graphics menu with To access the range on the TI-85 (called the window on the TI-86), press . Set xMin to 0 and xMax to 10. (It does not matter what values are set in the yMin and yMax positions.) Press...
- Page 9 Estimate the value of A where A = 1000(1 + 0.05) when x = 5, x = 7, and x = 10. Press EXIT RANGE have the settings shown to the right, reset the values. Press ZOOM ZOUT finishes drawing, press enlarge your view of the graph.
- Page 10 TI-86: Evaluating outputs from the home screen indicated above works on the TI-86, advances in the TI-86 technology give you a way to evaluate functions from the home screen using fewer keystrokes than for the TI-85. Type ALPHA...
- Page 11 1.1.7. You can also evaluate functions using the calculatorÕs TABLE. (On the TI-85, the table is accessed with program TABLE.) When you use the table, you can ask for specific output values corresponding to the inputs you enter or generate a list of input values that begin with TblMin and differ by DTbl and their corresponding outputs.
- Page 12 B-12 TI-85/TI-86 Graphing Calculators The message that appears tells you to press to see the output. The output is in the form [ t, v(t) ]. We see that v(85) » $6945. If you had wanted to generate a list of values, starting at a value called TblMin and differing by DTbl, use the AUTO option in the program.
- Page 13 Press ) , type in the x-value(s) at which TABLE the function is to be evaluated, and press You can scroll through the table with , and/or . Unwanted input entries can be cleared with 1.2.2 SOLVING FOR INPUT VALUES equation that you enter in the SOLVER.
- Page 14 TI-85 and with GRAPH RANGE is at the top of the TI-85 screen and the word WINDOW is at the top of the TI-86 screen. Because the only difference in the calculators in this situation is the name that is used, we from this point forward refer to this key for both calculators as ) .
- Page 15 ) and reset yMin to - 6 for a RANGE WIND good view of all intercepts. Press Even though it is very easy to find f(0) = have the calculator find the y-intercept while view- ing the graph by pressing TI-85 MORE MATH TI-86 MORE MATH Both View the y-intercept f(0) = Copyright ©...
- Page 16 B-16 TI-85/TI-86 Graphing Calculators To graphically find an x-intercept, i.e., a value of x at which the graph crosses the horizontal axis, first press to return the menu to the bottom of the screen. EXIT TI-85 Press MATH TI-86 Press...
- Page 17 On the TI-85, ¥ The TI-85 interprets y composite function f(g(x)), you should substitute g(x) everywhere an x appears in f(x). For instance, if f(x) = x composite function (f On the TI-86, ¥ Enter y ) in y to obtain the composite function (f Both Your calculator will evaluate and graph these constructed functions.
- Page 18 ENTER TI-85 You can find function values by evaluating out- puts on the home screen or using the table. Do not forget to change the calculatorÕs FORMAT setting back to DrawLine when you finish graphing the piecewise function.
-
Page 19: Entering Data
After setting the proper horizontal view, you can now use ZFIT to draw a graph of the piecewise function. You can find function values by evaluating outputs on the home screen or using the table. & 1.4 Linear Functions and Models Actual real-world data is used throughout Calculus Concepts. - Page 20 ENTER 1.4.2 EDITING DATA IN THE TI-85 LIST EDITOR value, access the data with the list editor and use the cursor keys to move to the value you wish to correct. Type the correct value and press ¥...
- Page 21 There are several ways to do this, and the most convenient method is illustrated below. TI-85 Whenever you enter new data in your calculator, you should first delete any previously-entered data using one of the following methods: ¥...
-
Page 22: Plotting Data
(The boxes may appear a slightly different size with different screen settings.) ¥ Even though the TI-85 generally allows you to call lists by any names you want, you must enter the input data in the list named L using program STPLT. - Page 23 To graph data on the TI-86: The TI-86 has a built-in command to graph data and autoscale the data window. Press STAT PLOTS screen. (Your screen may not look exactly like this one.) Note: When drawing a graph from the y(x)= list, you may get an error message or see a scatter plot of ÒoldÓ...
- Page 24 B-24 TI-85/TI-86 Graphing Calculators output values are constant. indication that a linear model may be appropriate. Program DIFF is given in the TI-85/TI-86 Appendix. To run the program, press then the -key under the name of the program. Press . If you have not entered the data, stop the...
- Page 25 TI-85 It is possible to enter data while in the statis- tics mode of your calculator. However, the examples in this Guide assume that input data is already en- tered in list L and output data is in list L...
- Page 26 1.4.9 GRAPHING A MODEL scatter plot of the data to verify that the model provides a good fit to the data. TI-85 After you have copied the model to the y(x)= list, run program STPLT to graph the model and the scatter plot on the same screen.
- Page 27 You can explore the process of finding the line of best fit with program LSLINE. (Program LSLINE is given in the TI-85/TI-86 Appendix.) For your investigations of the least-squares Copyright © Houghton Mifflin Company. All rights reserved.
- Page 28 B-28 TI-85/TI-86 Graphing Calculators process with this program, it is better to use data that is not perfectly linear and data for which you do not know the best-fitting line. Before using program LSLINE, clear the y(x)= list and enter your data in lists L Next, draw a scatter plot.
- Page 29 (say, L . Press ENTER ¥ TI-85 The original data remains in DATE. It is not deleted until you delete it using DELET press . Press ENTER ¥...
Need help?
Do you have a question about the TI-85 and is the answer not in the manual?
Questions and answers