Table of Contents
Advertisement
Quick Links
3M Occupational Health & Environmental Safety Division
3M
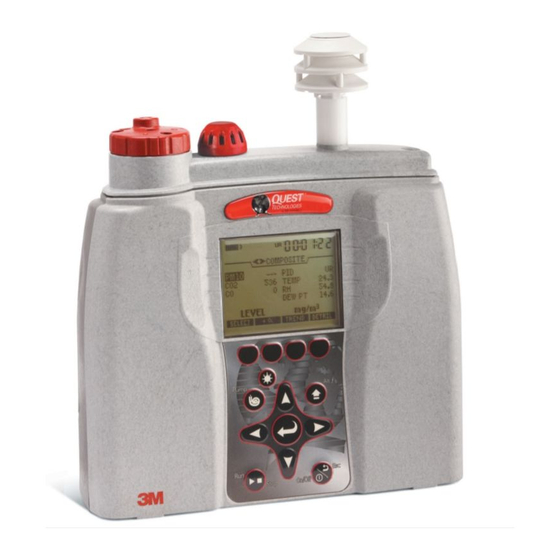
EVM Series Environmental Monitor
TM
Simultaneous
Particulate
Concentration Measurement
Distributed by:
Air-Met Scientific Pty Ltd
Air-Met Sales/Service
P: 1800 000 744
F: 1800 000 774
E: sales@airmet.com.au
Work with Confidence
and Gas
Air-Met Rental
P: 1300 137 067
E: hire@airmet.com.au
W: www.airmet.com.au
User Manual
Advertisement
Table of Contents

Related Manuals for 3M EVM Series


Summary of Contents for 3M EVM Series
- Page 1 3M Occupational Health & Environmental Safety Division EVM Series Environmental Monitor Simultaneous Particulate and Gas Concentration Measurement User Manual Distributed by: Air-Met Scientific Pty Ltd Air-Met Sales/Service Air-Met Rental P: 1800 000 744 P: 1300 137 067 F: 1800 000 774 E: hire@airmet.com.au...
-
Page 2: Dangers, Warnings, & Cautions
Dangers, warnings, & cautions EVM series environmental monitor Dangers, warnings, & cautions Danger! Failure to observe the following procedures may result in serious personal injury: Not for use in Explosive or Hazardous locations. This product is NOT Intrinsically Safe. - Page 3 Dangers, warnings, & cautions (continued) Dangers, warnings, & cautions (continued) Caution! Avoid exposure to condensation, fogs, and liquid mists, that can contaminate the optical path inside the sensor. This instrument cannot detect methane gas. For best sensor life, avoid acidic condensing gases. ...
-
Page 4: Table Of Contents
Volatile organic compounds (VOC’s) sampling ............................. 6 Temperature, Relative humidity, Dew Point ..............................6 What the standards say ..................................... 6 Resources ........................................7 EVM Series .......................................... 7 Applications ........................................7 Models explained ......................................9 Chapter 2: Getting started ....................................11 Checking the equipment .................................... - Page 5 Table of Contents Outputs........................................19 Chapter 3:Setting up the EVM ..................................21 Setting up parameters via the keypad ................................21 Time and date setting ....................................21 Checking battery power ....................................22 Display: language, contrast, & key click ..............................24 Setting logging and viewing run time ................................25 PID correction –...
- Page 6 Table of Contents Calibrating CO AND O ....................................67 Accuracy ......................................67 Accuracy ......................................67 Calibrating Photo-Ionization Detector (PID) Sensor ............................ 71 PID parts per million (ppm) zero calibration ............................71 PID parts per billion (ppb) zero calibration ............................71 PID span calibration ....................................
- Page 7 Impactors and when to clean ..................................124 Gravimetric cassette and filter paper ................................125 Appendix A: Specifications ..................................126 Replacement and optional parts .................................. 136 Appendix B: Customer service ................................... 138 Contacting 3M Quest Tecnologies Instrumentation ..........................138 International customers....................................138 Calibration ........................................138...
- Page 8 Appendix B: Glossary of Terms .................................. 140 Appendix C: PID sensor and correction factors tables ..........................146 Appendix D: FAQ’s; particulate measurements ............................158 Appendix E: System errors displayed on the EVM series ........................163 List of Figures Figure 1-1: Particulate path diagram ........................................2 Figure 1-2: Particulates and diameter size ......................................
- Page 9 List of Figures Figure 4-13: Reset gravimetric setting ........................................ 57 Figure 4-14: Pump flow rate calibration ......................................58 Figure 4-15: Flow Rate Calibration........................................59 Figure 4-16: Calibration history for EVM ......................................61 Figure 4-17: Applying a gas sensor........................................62 Figure 4-18: Selecting sensor for calibration process..................................64 Figure 4-19: Calibration zero screen ........................................
- Page 10 List of Tables Figure 7-4: Remove/insert PID sensor with lamp & pellet ................................119 Figure 7-5: PID sensor cleaning kit ........................................119 Figure 7-6: Fitting/Inserting the lamp and pellet....................................120 Figure 7-7: Optical engine and cleaning ......................................121 Figure 7-8: Cleaning the optical engine ......................................122 Figure 7-9: When to clean impactors .......................................
-
Page 11: Chapter 1: Introduction
CHAPTER Introduction Particulate path Introduction Chapter 1: The EPA (Environmental Protection Agency) conducted a study over the last 25 years (1975- 2000) and determined that 107 measurable air pollutants, specifically carcinogens, exist in working environments. Combined with the advent of closed windows, modern office buildings and various cleaning solvents, the outcome has been energy efficient buildings and homes which contain levels of carcinogens. -
Page 12: Particulate Sampling (Aerosols/Dust Vapors)
Introduction Particulate path Particulate sampling (Aerosols/dust vapors) The EVM is a portable-area monitoring instrument with a laser-photometer that measures and stores concentration levels of airborne-dust over time. It is designed to measure and help you identify the air pollutants, existing as matter (gases and aerosols) in the environment. -
Page 13: Particulate Sizes
Particulate sampling (Aerosols/dust vapors) Particulate sizes Particulate sizes Aerosols and gases are experienced in industrial processes, workplaces, and in every day life. Keeping in mind that inhalable dust is 100 microns and smaller, this dust is usually filtered through the hairs and membranes in your sinuses. 10 microns and smaller is considered “thoracic”, 4-10 microns is “inhalable”... -
Page 14: Particulates And Cut-Point
Particulate sampling (Aerosols/dust vapors) Particulates and cut-point Particulates and cut-point In consideration of how the size of particulates affect the human body, it is important to select a particulate size cut-point. Essentially, the particle size selector on the EVM is a top-mounted rotary impactor. Based on your setting, it will filter out all particulates at or above the selected size. -
Page 15: Gas Sensors Sampling
Gas sensors sampling Gas sensors and path Gas sensors sampling The EVM uses a unique smart sensor technology includes automatic sensor recognition and measures up to three gases simultaneously: a selection of optional nine toxic gases, Carbon Dioxide, combustible gases, and VOC’s. Gas sensors and path Quest’s unique smart sensor technology includes automatic sensor recognition, calibration levels, temperature compensation information... -
Page 16: Volatile Organic Compounds (Voc's) Sampling
Volatile organic compounds (VOC’s) sampling Gas sensors and path Volatile organic compounds (VOC’s) sampling According to the American Lung Association, Volatile Organic Compounds (also referred to as VOC’s) are one of the top Indoor Air Quality (IAQ) pollutants. These include: ... -
Page 17: Resources
EVM Series Resources Health Administration (OSHA), the Mine and Safety and Health Administration (MSHA), and the American Conference of Governmental Industrial Hygienists (ACGIH), NFPA (National Fire and Protection Agency), National Institute and Technology (NIST), and American Society of Heating, Refrigeration, and Air-Conditioning (ASHRAE) have all created regulations and limitations on total permissible exposure levels. - Page 18 EVM Series Applications to analyze work-place exposure and help identify dust control techniques such as training or implementing engineering controls. Industrial setting - Used to monitor and ensure health Time history: manufacturing and safety in settings where toxic fumes are released (such as testing levels at a paper mill or a foundry).
-
Page 19: Models Explained
EVM Series Models explained Models explained The EVM Series simultaneously measures and data logs specific sensors/parameters that were ordered with your instrument. The models, sensors, and accessories are explained in detail below. Please refer to the part’s listing for further details (such as calibration accessories). - Page 20 EVM Series Models explained This page left blank intentionally...
-
Page 21: Chapter 2: Getting Started
CHAPTER Checking the equipment Models explained Getting started This chapter is designed to guide you through basic information you will need to begin measuring with your environment monitor. Checking the equipment If your instrument was sent to you in a storage case, you will want to remove all the packaging and acquaint yourself with the following equipment. -
Page 22: Display And Keypad
Display and keypad Diagram Display and keypad The keypad is used to run and stop your studies, view your measurement values, select appropriate set-up parameters, and power on and off. Diagram The following diagram explains the features on the display and keypad. 6. -
Page 23: Keypad Description
Display and keypad Keypad description Keypad description Keypad Explanation 1. Display Used to view data, menus, and various indicators. 2. Backlight Used to illuminate the background of the display screen. (i.e., nighttime study.) 3. Particulate pump Used for particulate measuring. Toggles the internal pump on and off (used for particulate measurements) 4. -
Page 24: Turning On
Turning on Start screen explanation Turning on 1. To turn on the EVM, press the On/Off /Esc A Quest Technologies splash screen will appear including the firmware version name. Proceeding the splash screen, you will be viewing the Start screen. -
Page 25: Navigating
Turning on Navigating Navigating Once the EVM is powered–on, press the Up/Down Arrow Key to select a menu or to edit a field. Press the Left/Right Arrow Key to scroll through measurement screen, start screen, or to move right or left in a menu (i.e., setup menu). -
Page 26: Turning Off
Turning off Unit information screen Turning off When turning off the EVM, ensure you are in stop mode. A stop indicator will appear on the top left next to the battery charge status icon. If it is in run mode, stop the session and then proceed below. 1. -
Page 27: Figure 2-5: Selecting Unit Info. Sensors
Instrument Information Unit information screen 3. To view the installed sensors, repeatedly press Enter and it will display the Unit Info screen with the installed sensors. (See Figure 2-6). 4. Or press the Look-up key. Then press the Arrow to select and press Enter to open the screen. -
Page 28: Tm Detection Management Software Dms
Unit information screen Detection Management Software DMS DMS is a software application designed by 3M Quest Technologies that runs under the Windows operating system. You can use DMS for a variety of functions such as: customizing your set-up parameters, displaying data, manipulating data, and creating reports. -
Page 29: Powering And Outputs On The Evm
Communicating Powering and outputs on the EVM Powering and outputs on the EVM Battery The battery is an internal Lithium-ion Rechargeable battery pack. The minimum hours of operating time is 8 hours of continuous operation including setup time, run time, and viewing your result time. - Page 30 Communicating Powering and outputs on the EVM This page left blank intentionally...
-
Page 31: Chapter 3:Setting Up The Evm
Setting up parameters via the keypad CHAPTER Time and date setting Setting up the EVM Chapter 3: The focus of this chapter is to address all of the setup options available on the EVM. Once your parameters are selected, you will want to refer to the Calibration chapter (see Chapter 4). -
Page 32: Checking Battery Power
Setting up parameters via the keypad Checking battery power Ensure Setup is highlighted and press Enter . (The Setup menu will appear.) In the Time/Date screen, press the Arrows to select Time field or Date field. (Note the Day field will update automatically based on the selected day from the date field.) ... -
Page 33: Figure 3-2: Start Screen
Setting up parameters via the keypad Checking battery power The battery screen is used to determine the battery capacity status. When operating from the battery, you can check the remaining capacity of the battery pack at any time by accessing the Battery screen. Additionally, a battery indicator will be present on all screens to notify you of the remaining battery capacity. -
Page 34: Display: Language, Contrast, & Key Click
Setting up parameters via the keypad Checking battery power Display: language, contrast, & key click In the display screen, there are three selectable settings including language, contrast, and key click. Display Explanation settings Language With the language setting, there are six options including: English, Spanish, German, French, Italian, and Portuguese. -
Page 35: Setting Logging And Viewing Run Time
Setting up parameters via the keypad Setting logging and viewing run time To change the Key click sound setting, press Arrows until On/Off is displayed. Press Enter to move back to the left column or escape to cancel selection. Display fields Select the field (via up/down arrows). -
Page 36: Table 3-2: Logged Intervals And Selecting Logged Measurements
Setting up parameters via the keypad Setting logging and viewing run time Logged data Explanation attributes Measurements Selectable logged measurements: Level, Lmin, Lmax, Lavg, and STEL. If the measurement is set to “On”, this indicates the instrument will log data at the logged interval (i.e., while in run mode). “Off” indicates the measurement will not log when in run mode. -
Page 37: Pid Correction - Adding/Editing
Setting up parameters via the keypad PID correction – adding/editing Logging time/averaging time Logging attributes/measurements Run Time When selected, the estimated run time screen displays the total Figure 3-5: Logging screen remaining time. 4. Optional: To view the Estimated Run Time, select this field (by pressing Arrows) and press Enter . -
Page 38: Figure 3-7: Pid Correction Factor
Setting up parameters via the keypad PID correction – adding/editing 2. Select PID by pressing Arrows and press Enter . The PID correction factor screen will appear. 3. Press Enter to move to the value field. Press Arrows to change the value. Press Enter to save your changes. -
Page 39: Changing Units (Temperature, Particulates, Pid, And Air Velocity)
Setting up parameters via the keypad Changing units (temperature, particulates, PID, and air velocity) Changing units (temperature, particulates, PID, and air velocity) In the units screen, the temperature, particulates, and the air velocity values can be displayed in different measurement units. ... -
Page 40: Setting Up Particulate Settings
Setting up parameters via the keypad Setting up particulate settings Setting up particulate settings There are four parameters in the particulate screen which include: Particulate field- enables and disables when measuring particulates. (If disabled, it will not enable the pump during run mode.) ... -
Page 41: Dust Correction Factors (Profiles)
Setting up parameters via the keypad How particulate factors are adjusted and calculated The gravimetric volume accumulator will display the amount of volume passed through the gravimetric filter. After the run, check the gravimetric mass accumulator, compare to what was actually measured from the lab, and enter in a correction factor. -
Page 42: Figure 3-11: Entering A Profile For Particulate Calibration
Setting up parameters via the keypad How particulate factors are adjusted and calculated 5. Press the Edit softkey and the Edit Profile screen will open. Profile name Optional: customize the profile name Factor Figure 3-11: Entering a profile for particulate calibration 6. -
Page 43: Particulate Pump: Enable Or Disable
Setting up parameters via the keypad Particulate pump: enable or disable Particulate pump: enable or disable You may wish to disable the particulate pump for situations in which the environment is too dirty for the particulate optical engine or if you want to keep the engine and pump clean and dry from oily mists, liquids, or fogs elements. -
Page 44: Auxiliary Input/Output
Setting up parameters via the keypad Auxiliary input/output To reset the Gravimetric filter, select the Grav. Mass/Grav. Volume fields by pressing Arrows. Once selected, the Reset softkey will appear. Press this softkey to reset. Reset softkey Displays accumulated Visible when particulate mass &... -
Page 45: Figure 3-13: Configuring Digital Output
Setting up parameters via the keypad Auxiliary input/output Digital Out/Logic Explanation Active High Pulse The output will assert an active high pulse for approximately 50msec when the threshold is exceeded. Active Low Pulse The output will assert an active low pulse for approximately 50msec when the threshold is exceeded. -
Page 46: Air Velocity
Setting up parameters via the keypad Air Velocity Air Velocity Setting the air velocity parameter is fairly simplistic; however, ensure no other outputs are enabled prior to setup. (The EVM will display a pop-up message if more than one output is enabled. You will have to disable all other auxiliary outputs before proceeding with air velocity setting.) When air velocity is “enabled”, you can measure/log with the Quest AirProbe10 (optional accessory). -
Page 47: Analog-Out
Setting up parameters via the keypad Analog-out Analog-out The analog-out channel provides a voltage reading that is proportional to the sensors output. The analog-out channel can be configured to track any installed sensor. The example displayed in Figure 3-12 shows the results of measuring with the thermometer from 0 to 60ºC reading from 0 to 5 volts. -
Page 48: Restoring Default Factory Settings
Setting up parameters via the keypad Restoring default factory settings Restoring default factory settings The EVM is equipped to restore all factory settings and factory calibration NOTE: Dew Point and Air Velocity are not settings via the Defaults screen. user calibrated and therefore, not listed in the restore factory calibration screen. -
Page 49: Backlight Setting
Setting up parameters via the keypad Backlight setting 4. To restore the Factory Settings, press Arrows to select and press Enter A Restore Factory Settings pop-up screen will appear. Press either Yes or No (with Arrows and Enter to confirm). Backlight setting A key on the keypad is dedicated to turning on or off the backlight feature. -
Page 50: Lock/Secure Run And/Or Setup
Setting up parameters via the keypad Lock/secure run and/or setup Lock/secure run and/or setup The lock or security feature is designed to lock the EVM during a run to ensure the session will not be stopped unless the lock feature is disabled. -
Page 51: Unlock Run And/Or Setup
Setting up parameters via the keypad Unlock run and/or setup 4. To enable either one, first select Run or Setup fields (by using Up/Down Arrows). 5. Press Enter and the first field will be shaded/selected. Press Arrows to change the numeric value. Adding a numeric password ... -
Page 52: Auto-Run
Setting up parameters via the keypad Auto-run Auto-run The EVM has four programmable auto-run settings including a timed- run, a date, a day of week (DOW), and a disabled mode. The EVM is shipped with the auto-run set to the disabled mode. Each mode has more than one setting and is denoted by the “+”... -
Page 53: Auto-Run With Date Mode
Setting up parameters via the keypad Auto-run To change the duration, press Arrows. To move between the fields, press Arrows. (Repeat as necessary). Duration Select the hours/minutes/seconds with up/down arrows and press Enter to move to the next field. Figure 3-23: Setting timed-run and duration Press Enter to save your settings. -
Page 54: Figure 3-24: Selecting Auto-Run With Date Mode
Setting up parameters via the keypad Auto-run Next, press one of the softkeys. (This will open a Date/Auto-Run screen.) Softkeys Select a softkey to setup the Date Auto-Run parameters Once set, “-one” will appear as “+one” which is turned on. Figure 3-24: Selecting auto-run with date mode If off appears under Auto-Run, press Enter (or skip and see step... -
Page 55: Auto-Run With Day Of Week (Dow) Mode
Setting up parameters via the keypad Auto-run Auto-run with day of week (DOW) mode The days of the week (DOW) setting is a pre-programmed weekly auto-run with a specified day, start time, and duration with two auto on settings. The programmable settings include a day of the week, start time, and duration. - Page 56 Setting up parameters via the keypad Auto-run This page left blank intentionally...
-
Page 57: Chapter 4: Calibrate Sensors
CHAPTER Placement and calibration of sensors Inserting and removing sensors Calibrate sensors Placement and calibration of sensors Before you begin your measurement sampling, it is recommended to calibrate the sensors you will be using. This chapter focuses on inserting and removing sensors, calibrating each sensor, viewing past calibrations, and how to verify your calibration set points. -
Page 58: Figure 4-1: Sensor Housing And Manifold
Placement and calibration of sensors Inserting and removing sensors Remove the black manifold casing. Manifold Sensor housing Figure 4-1: Sensor housing and manifold 4. To insert a sensor, gently push the sensor’s pins into the socket pin of the circuit board so it aligns accordingly. It will fit securely. 5. -
Page 59: Calibrating Particulates
Placement and calibration of sensors Calibrating particulates NOTE: The Temperature/ Relative Humidity sensor is not user removable. NOTE: the user will receive a message on the display when a new sensor is detected or an existing sensor is no longer detected. -
Page 60: Adjusting The Impactor/Turret Setting
Placement and calibration of sensors Adjusting the impactor/turret setting NOTE: Depending on the environment (i.e., a dense, dusty manufacturing plant), you will want to ensure the impactor is well greased and cleaned before using. Additionally, it is recommended to monitor this process while measuring. -
Page 61: Figure 4-5: Adjusting Impactor/Turret Setting
Placement and calibration of sensors Adjusting the impactor/turret setting 2. Twist the turret (red casing around the impactor) to the left or right until you see the appropriate setting on the display. It will align to the impactor text and arrow on top of the housing. NOTE: The actual diameter of the air inlet hole is directly to the ... -
Page 62: Particulates Calibration (Zero Cal)
Placement and calibration of sensors Particulates calibration (zero cal) Particulates calibration (zero cal) A zero calibration is recommended the first time you measure particulates in the run mode. For particulate calibration, place a zero filter (also called a HEPA filter) with attached coupler into the vent of the turret. -
Page 63: Figure 4-7: Selecting Calibration Screen
Placement and calibration of sensors Particulates calibration (zero cal) 3. From the Start screen, press Arrows until Calibration is selected and press Enter Calibration – select to open to the Calibration set screen Figure 4-7: Selecting calibration screen 4. In the Calibration screen, press Arrows and select PM (for particulate matter). -
Page 64: Figure 4-9: Particulate Calibration And Ready Screen
Placement and calibration of sensors Particulates calibration (zero cal) 6. The ready screen with the PM, Profile will appear. Press the Start softkey. Start softkey Figure 4-9: Particulate calibration and ready screen Allow the level to stabilize (approximately 1-3 minutes). It will state Waiting (A) and Set softkey will appear when it has stabilized (B). -
Page 65: Figure 4-11: Particulate Calibration Pause Screen
Placement and calibration of sensors Particulates calibration (zero cal) 9. The instrument will show a Pause state with the intended and actual values. Save softkey Figure 4-11: Particulate calibration pause screen 10. Press the Save softkey to save your calibration (or press Cancel and Retry to repeat this process.) A screen pop-up will state “Zero cal set point”... -
Page 66: Particulate Advanced Calibration (Gravimetric)
Placement and calibration of sensors Particulate Advanced Calibration (Gravimetric) Particulate Advanced Calibration (Gravimetric) With the EVM, you can store up to 8 different profiles (also called correction factors) to reflect the environment or building zone you plan to measure. The instrument is factory calibrated to Arizona Road dust. In some situations, you may want to perform a gravimetric calibration in order to determine the correction factor for an alternative environment. -
Page 67: Performing A Gravimetric Calibration
Placement and calibration of sensors Performing a gravimetric calibration Performing a gravimetric calibration Ensure the gravimetric cassette is new before beginning. 1. Place the instrument in the appropriate environment. 2. Turn on by pressing On/Off/Esc 3. In the Start screen, select the Setup menu and press Enter Next, select Particulates by pressing the Down arrow repeatedly and once selected, press Enter 4. -
Page 68: Pump Flow Rate Calibration
Placement and calibration of sensors Pump flow rate calibration 8. Lastly, calculate the ratio between the value in the Gravimetric Mass field and the weight of the collected sample. 9. Enter in the correction factor via the Particulate Setup screen. (Please see “Setting Profiles”... -
Page 69: Toxic Gas Sensors
Placement and calibration of sensors Toxic gas sensors 1.67 lpm is the recommended flow rate to mirror with Percentage of air flowing through the pump Save Figure 4-15: Flow Rate Calibration 6. Manually adjust the flow rate (as needed) by repeatedly pressing the Up/Down key to select the desired level. -
Page 70: Cross Sensitivity
Placement and calibration of sensors Cross sensitivity The sensors are based on well established electrochemical sensor technology. They are designed to be maintenance free and stable for long periods of use. Cross sensitivity The following table illustrates the cross-sensitivity to a range of commonly encountered gases, expressed as a reading of the sensor when exposed to 100 ppm of the interfering gas at 20ºC. -
Page 71: About Sensors And Cal Storage
Placement and calibration of sensors About sensors and cal storage About sensors and cal storage Once a calibration is completed and a sensor is removed, the calibration records are stored in the sensor. Calibration history and sensor serial numbers After running, saving a calibration, and downloading the data to ©... -
Page 72: Applying A Gas Sensor
Placement and calibration of sensors Applying a gas sensor Applying a gas sensor You will want to gather your calibration gas source, the regulator (if not already connected), inert tubing, the cal adapter and the EVM with the appropriate sensors installed. After your calibration setup is completed, please follow the proceeding applicable calibration sensor sections. -
Page 73: Calibrating Toxic Gas Sensors
Placement and calibration of sensors Calibrating toxic gas sensors Calibrating toxic gas sensors It is recommended to conduct a zero cal and a span cal with toxic gas sensors. Essentially, a calibration is conducted by checking the sensors response to a known concentration of a certified calibration gas. It is important to note that with a zero cal and a span cal, you should be in a non-contaminated environment when performing the calibration. -
Page 74: Figure 4-18: Selecting Sensor For Calibration Process
Placement and calibration of sensors Calibrating toxic gas sensors 1. While the instrument is powered off, connect the pure air cylinder, regulator, inert tubing, and cal cup to the EVM. 2. Power on the EVM by pressing the On/Off/Esc 3. In the start screen, press the Down arrow to select Calibration and press the Enter 4. -
Page 75: Toxic Gas Span Calibration
Placement and calibration of sensors Calibrating toxic gas sensors 8. Press the Set softkey. A screen displaying the zero cal intended and actual set point values will appear. Press the Save softkey. Zero Cal + (plus sign) Span cal indicates Zero cal - (minus sign) indicates has been set. -
Page 76: Figure 4-21: Span Calibration
Placement and calibration of sensors Calibrating toxic gas sensors 2. Apply the gas at full flow rate while observing the “Level” field on the display. Wait for the current level to stabilize (allow a couple of minutes). Level Allow to stabilize Figure 4-21: Span Calibration 3. -
Page 77: Calibrating Co
Placement and calibration of sensors Calibrating CO2 AND O2 7. Repeatedly press On/Off/Esc until you return to the start screen. 8. Press Arrows to view measurement screens. Calibrating CO AND O With the Carbon Dioxide (CO ) or Oxygen (O ) calibration, you can perform a zero calibration and a span calibration (when the cal gas is connected) in the field. -
Page 78: Figure 4-23: Selecting A Calibration Sensor
Placement and calibration of sensors Calibrating CO2 AND O2 gas (used for zero cal.) calibration gas Room air for 0 calibration gas (i.e., 20.9%) 2. Attach the regulator and tubing to the gas cylinder. 3. Place the Cal. cup over the Air inlet cover and slide the tubing over the black air inlet casing. -
Page 79: Figure 4-24: Calibration Co2 Ready Screen
Placement and calibration of sensors Calibrating CO2 AND O2 For the Set Points, -zero and –span softkeys will appear. Press either Zero Cal or Span Cal softkey. (See Table 4-2 for more information.) Softkey Menu Zero, Span or Exit Figure 4-24: Calibration CO2 ready screen ... -
Page 80: Figure 4-25: Setting Co Span Cal Screen
Placement and calibration of sensors Calibrating CO2 AND O2 Level Allow to stabilize before setting calibration point Set Softkey Figure 4-25: Setting CO Span Cal screen 10. Once the zero and span cal values are set, the calibration save screen will appear. Press Save to save your calibration. NOTE: If you want to repeat the cal, press the Cancel softkey ... -
Page 81: Calibrating Photo-Ionization Detector (Pid) Sensor
Placement and calibration of sensors Calibrating Photo-Ionization Detector (PID) Sensor Calibrating Photo-Ionization Detector (PID) Sensor Since a PID PPM sensor can detect a wide variety of gases, the best method to calibrate a PID sensor is to apply the gas of interest. It is recommended to set the flow rate at 1 LPM for best response time. -
Page 82: Pid Span Calibration
Placement and calibration of sensors Calibrating Photo-Ionization Detector (PID) Sensor 3. Press the Arrows to select the PID sensor. Selecting PID sensor Cal softkey Figure 4-27: Selecting PID sensor for calibration process 4. Press the Cal softkey and the Calibrate PID/Ready screen will NOTE: allow at least 60 seconds appear. -
Page 83: Figure 4-29: Pid Calibration Span Softkey
Placement and calibration of sensors Calibrating Photo-Ionization Detector (PID) Sensor relevant VOC for your calibrated gas source. However, for PID PPB span calibration, it is recommended to use 10 ppm (or 10,000 ppb) isobutylene whether the gas of interest is known/unknown. ... -
Page 84: Calibrating Relative Humidity And Temperature
Placement and calibration of sensors Calibrating relative humidity and temperature 3. Apply the gas at full flow rate while observing the “Level” field on the display. Wait for the current level to stabilize (allow a couple of minutes). 4. Press the Set softkey (and it will state Cal set point stored). 5. -
Page 85: Figure 4-31: Temperature Calibration
Placement and calibration of sensors Calibrating relative humidity and temperature Relative Humidity or Temperature calibration 1. Open the Calibration screen. 2. Press Arrows and select either RH or Temperature calibration. 3. Select the Cal softkey and then press the Start softkey. 4. -
Page 86: Calibration History
Placement and calibration of sensors Calibration history Calibration history In the calibration history screen, it will show your previous calibration of a specific sensor. When the sensor is selected, you will see when the last calibration was performed. To view the calibrated values, an optional History menu is selectable via a History softkey. -
Page 87: Verify Calibration And Drifting Analysis
Placement and calibration of sensors Verify calibration and drifting analysis Verify calibration and drifting analysis The verify screen is typically used to analyze drifting. This process verifies if the zero calibration remained stable or unchanged during the run-time/logging time. If it did not remain stable, you can set a new calibration offset and save this as your new set point. -
Page 88: Figure 4-34: Calibrating Pid
Placement and calibration of sensors Verify calibration and drifting analysis 4. Press the Set softkey to set a new calibration value. Figure 4-34: Calibrating PID 5. The Intended and Actual values will appear. Press the Save softkey to save these new values. Or press the Cancel softkey and press Retry to repeat this ... - Page 89 Placement and calibration of sensors Verify calibration and drifting analysis This page left blank intentionally...
-
Page 90: Chapter 5: Measuring And Viewing
CHAPTER Overview of running a session Verify calibration and drifting analysis Measuring and Viewing Once you have setup your logging parameters and calibrated the instrument, you are ready to begin measuring. The focus of this chapter is to give you a brief overview of what is measured, how to navigate, what measurements screens will appear, and how to run and stop your measurements. -
Page 91: Measuring
Measuring Understanding what data is stored Measuring Once you have placed the EVM in a specific location, you are ready to take measurements. With a couple pushes on the keypad buttons, you will be running and viewing your sessions. Following your sessions, you can load the data/files into QSP-II to manipulate, analyze, save, and create reports (See Chapter 6 for viewing your logged data in QSP-II). -
Page 92: Running And Stopping
Running and stopping Logged data/ Time history minute intervals (as set up in the EVM monitors via the logging screen). Time History data represents measurements that occurred over the most recent time period, which is the logging interval. For example, if the log interval is 1 minute, then the maximum value is the highest value for that 1 minute, and the Lavg value is the average value for that 1 minute. -
Page 93: Measurement Screens And Navigation
Measurement screens and navigation Logged data/ Time history Running and Stopping measurements 1. From the start screen or any of the measurement screens, press the Run/Stop key to begin measuring. A 5 second countdown will appear with a run message (in pause ... -
Page 94: Unit Defined
Measurement screens and navigation Unit defined Unit defined While viewing your measurement data, you will want to have a good understanding of the abbreviated units used on the instrument. These are listed in Table 5-1. Abbreviations Explanation on the EVM Over Load –... -
Page 95: About The Measurement Softkeys
Measurement screens and navigation About the measurement softkeys About the measurement softkeys Each measurement screen has softkeys (extended menus) which are used (NOTE: press the Enter key to toggle to view different measurements. through the various measurements.) Softkey menus Used to select additional menus or different measurements/units Figure 5-5: Example of measurement softkey menus... -
Page 96: Particulate Measurement Screen
Particulate measurement screen About the measurement softkeys Measurement Explanation Softkeys Detail softkey – Detail softkey used to view a sensor’s measurement values in a summary screen. For example, if you are on the composite measurement screen and you want to view the summary data for CO2, you would first select the CO2 field and then select the Detail softkey. -
Page 97: Impactors And Particulate Measuring
Particulate measurement screen Impactors and particulate measuring Impactors and particulate measuring As discussed in the calibration chapter, there are four selectable particulate settings. To move the impactor, ensure you are in stop mode. Then, twist to the right or left until you feel a tactile detent. The impactor setting will align to the gray marking on the housing (see Figure 4-4 for an example). -
Page 98: Changing Particulate Measurements
Particulate measurement screen Changing particulate measurements Changing particulate measurements To change the displayed measurements, there are three options in the particulate screen. You can press the Enter key to page through each measurement, select a specific measurement from the lookup/glasses softkey, and/or press the Detail softkey. -
Page 99: Relative Humidity & Temperature Measurements
Relative humidity & temperature measurements Relative humidity and temperature screen Measurement Explanation values Level LEVEL - Notation used to represent current live reading of the sensor. (This is updated once a second.) Minimum - Minimum level value which occurred during a log session. Maximum - Maximum level value which occurred during a log session. -
Page 100: Gas Measurements
Gas measurements Gas screen To change the RH and Temperature measurement view Press the Select softkey, Trend softkey, or the Detail softkey. (See Table 5-1 for details). NOTE: The Arrows can be used instead of the Select softkey. Gas measurements The gas measurement screen displays the measurements for CO , toxic... -
Page 101: Composite Screens
Composite measurement Composite screens Composite screens Zoomed in: The composite measurement screen (when zoomed- in) combines all sensors/parameters into one screen with two columns displaying two different measurement calculations. The second column is changeable by pressing Enter . (See “B” below.) Zoomed out: ... -
Page 102: Air Velocity Meaursurement Screen
Air velocity meaursurement screen Composite screens Air velocity meaursurement screen There are a couple quick steps to ensure air velocity is setup and that the AirProbe is attached before measuring. 1. The air velocity setting is enabled in Setup /AUX/Air Velocity screen. -
Page 103: Summary Data
Summary Data Viewing details in the measurement screen Summary Data In each of the measurement screens, a Detail softkey will appear. Once selected, you can view a quick summary of all measurement calculations in one screen. This is explained below. Viewing details in the measurement screen ... -
Page 104: Viewing Trend Data In The Measurement Screen
Trend Data Viewing trend data in the measurement screen Viewing trend data in the measurement screen The example in Figure 5-13 displays particulate trend data with one second level values. Trend data screen To select a trend screen, first select a measurement screen you wish to view. -
Page 105: Past Session
Past session Summary data screen 6. Press On/Off/Esc to return to previous screen. Past session The past session summary screen allows you to view your session summary data. You can view sessions by name and file size, name and date, or name and run time via the lookup softkey. Once a session is selected, the measurement summary information is viewable and selectable via Arrows. -
Page 106: Figure 5-16: Past Session With Files Selected
Past session Summary data screen To select a session, press Arrows and press the Load Softkey. Past sessions listed by Name and date order Look-up Re-arrange how the sessions are organized. Figure 5-16: Past Session with Files selected Files softkeys Explanation Lookup Look-up softkey: used to organize the session files by the... -
Page 107: File System Menu
File System menu Deleting sessions individually NOTE: the particulates, toxic gas, CO gas, and PID sensors will detail the following measurement parameters: Min, Max, Avg, Max STEL, TWA. For RH, Temp, and Air Velocity, the measurement parameters include: Max, Min, and Avg. -
Page 108: Delete All Sessions
File System menu Delete all sessions In the File System/Sessions screen, you have the same softkey selections as the Past Session Summary menu. (Please see Table 5-4 for softkey explanation). To delete a selected session, first select a specific session to delete by pressing the Arrows. -
Page 109: Memory Remaining And File Properties
File System menu Memory remaining and file properties Memory remaining and file properties The properties screen displays the number of stored files, the total amount of space used on the instrument, and the amount of free memory space. Viewing remaining memory and file properties ... -
Page 110: Estimated Run Time
File System menu Estimated Run Time Estimated Run Time The Estimated Run Time screen displays the amount of days, hours, and minutes’ remaining on the instrument. You can extend the run time if you log less parameters (such as, only logging MAX or increasing the log interval.) You may want to download and save your files in QSP-II and then clear the memory on the EVM. -
Page 111: Chapter 6: Dms (Software)
The following explains the EVM communication download and/or setup steps. 1. Plug the USB cable into the powered on EVM and then connect it to the computer port. EVM Series Turn On ... -
Page 112: Downloading Data With The Evm
Downloading data with the EVM The Instrument Download feature enables you to download your files from the EVM Series into the software for review and analysis of the data. Once the files are downloaded and if “Go to Session Finder after Download” is checked, DMS will open into the session finder page. -
Page 113: Evm Panel Layout View (Plv) Page
EVM: Viewing Data EVM panel layout view (PLV) page EVM panel layout view (PLV) page The measurements and parameters will be displayed in charts and graphs which may be customized for analysis and/or reporting purposes. Note: a button provides a quick link to viewing the panel layout view data in a report format. 1. -
Page 114: Evm Reports And Printing
EVM Reports and Printing EVM panel layout view (PLV) page EVM Reports and Printing To quickly create reports, open your data (in the data finder page) and click the quick report button. A standard template of charts and graphs (or panels) will appear in the report. Note: the charts/graphs will appear in the order displayed in the panel layout page. ... -
Page 115: Customizing Reports
The example below displays customizing the header and footer. Type in text or use the icons to create customized heading/footer. To change the 3M logo and add your company’s logo, click on the image icon. Figure 6-6: Customizing DMS reports... -
Page 116: Evm Setup
EVM Reports and Printing EVM Setup EVM Setup There are 7 configurable EVM setup screens (see 1 in Figure 1-54 below) in the setup page. With the EVM, you have the option to save the configurations either on the instrument and/or store the configurations in DMS. Note: if you save the profiles in the software, this can be used as a time management tool to organize and save all the setups for future use. -
Page 117: Evm General Parameters Table
The PID correction factor is automatically set to 1.0. For best results, it is recommended to add a correction factor to the Factor relevant VOC you intend to measure. Note: Appendix C of the EVM Series User Manual, provides a listing of PID correction factors. -
Page 118: Evm Logging Parameters Table
EVM Reports and Printing Figure 6-9: Logging EVM setups EVM and auto-run setting 2. To set the logging settings, click on or save and send to the EVM (for more details see “Saving and sending configurations”. EVM logging parameters table Logging parameters Name Field *Note: refer to Glossary for more detailed information... -
Page 119: Evm And Auto-Run Setting
EVM Reports and Printing Figure 6-9: Logging EVM setups EVM and auto-run setting EVM and auto-run setting The EVM has four programmable auto-run settings including a timed run, a date, a day of week (DOW), and a disabled mode. The following Auto-Run settings are briefly explained below: ... -
Page 120: Day Of Week And Auto-Run Setting
EVM Reports and Printing Figure 6-9: Logging EVM setups EVM and auto-run setting 4. To enable additional date settings (Date 2 – Date 4), repeat step 3. 5. To set the auto-run, click on or save and send to the EVM (for more details see “Saving and sending configurations”. -
Page 121: Evm And Security Settings
EVM Reports and Printing EVM and security settings EVM and security settings The security or lock feature is used to prevent a user from interrupting a run and/or prevents someone from changing a setup or saved setups on the instrument. NOTE: a default code, “9157”, will disable secure run or secure setup if the numeric Passcode is forgotten. -
Page 122: Figure 6-14: Evm Triggering Setup
EVM Reports and Printing EVM and triggering settings 4. To set the triggering setup, click on or save and send to the EVM (for more details see “Saving and sending configurations”. Figure 6-14: EVM Triggering setup Triggering Explanation parameters Digital Output Enables the digital output on the device when checked per the mode, parameter, and threshold settings. -
Page 123: Evm And Particulate Settings
EVM Reports and Printing EVM and particulate settings EVM and particulate settings The particulate settings may be programmed with up to 8 correction factor profiles. It also provides the capability to view the mass and volume of the gravimetric accumulator and gravimetric volume if get configuration is selected. To update, please follow below. 1. - Page 124 The firmware update screen is used to update the latest software to EVM Series. With a firmware update, the Web Server option enables you to update through an internet connection. If you do not have internet capability, the File option is used in place of the first option.
-
Page 125: Chapter 7: Maintenance & Cleaning
CHAPTER Maintenance and Cleaning PID Sensor Maintenance & cleaning Overview The maintenance and cleaning chapter discusses how to care for the following items: Care and cleaning with the PID sensor Optical Engine: maintenance and cleaning Impactor care ... -
Page 126: Removing And Installing Pid Sensor
116 Maintenance and Cleaning Removing and Installing PID sensor Removing and installing PID sensor If you ordered a PID sensor with your instrument, it will be shipped with an installed PID sensor that was factory calibrated. The following procedures explain how to remove and install the PID sensor. 1. -
Page 127: Maintenance And Cleaning Overview Of Pid
Maintenance and Cleaning Maintenance and cleaning overview of PID Maintenance and cleaning overview of PID Periodic maintenance is encouraged to ensure accurate VOC measurements. Typically, in a clean air environment where VOCs are low with few particulates, cleaning and calibrating is recommended on a monthly basis or even less frequent. -
Page 128: Figure 7-2: Removing Intelligent-Sensor Casing With Pid
Maintenance and Cleaning Cleaning PID sensor 2. Using a flat-headed screwdriver, gently pry open the plastic, intelligent sensor casing where the small rectangle crevice is on the backside of the housing. Using some force, lift the top off (the bottom section is glued in.) Remove intelligent sensor casing Figure 7-2: Removing intelligent-sensor casing with PID... - Page 129 Maintenance and Cleaning Cleaning PID sensor Note: you may 4. Set the electrode pellet and lamp to the side. ( want to use paper towel, or a cloth without fibers, when handling these pieces to prevent oils from your hands transferring to the lamp or pellet.) Electrode Pellet The lamp twists onto this pellet cover...
-
Page 130: Optical Engine: Maintenance And Cleaning
Maintenance and Cleaning Cleaning PID sensor 7. Then, lower into the PID sensor as displayed below. Electrode Pellet and lamp attached Figure 7-6: Fitting/Inserting the lamp and pellet 8. Place the plastic Intel-sensor casing over the sensor. Press firmly to snap it into place. - Page 131 Maintenance and Cleaning Optical Engine Maintenance and cleaning of the optical engine 1. Remove the two screws on the optical engine using a Phillip’s screwdriver. 2. You have two options when removing the screws: Your first option is to loosen the two screws and turn the D- Ring so the flat angle is facing the circular metal plate.
- Page 132 Maintenance and Cleaning Optical Engine Mirror from 3. Next, lift the spherical mirror up and off optical by using a flat-headed screwdriver. engine Using a clean Q-tip, gently wipe the spherical mirror in a circular motion. Set aside. Using a clean Q-tip, gently wipe around the outer cavity of the optical engine.
-
Page 133: Impactor Care
Maintenance and Cleaning Impactor care Impactor care The impactor will require periodic greasing and cleaning which is dependent on the density of air particulates floating in the intended measurement environment. NOTE: The impactor must be greased before your first measurement. -
Page 134: Impactors And When To Clean
Maintenance and Cleaning Impactor care Impactors and when to clean When the dust accumulates on top of impactor plate in a pyramid form (as displayed in the Figure below), this signifies the impactor plate requires cleaning. For example, in a dense, dusty manufacturing plant, this may require greasing and cleaning after each measurement or every 10 hours of measuring. -
Page 135: Gravimetric Cassette And Filter Paper
Maintenance and Cleaning Impactor care Gravimetric cassette and filter paper A filter paper in the gravimetric cassette (also referred to as “gravimetric pump protection filter”) is user-replaceable and is included in your kit. It is suggested to replace the filter paper when the flow rate is not maintained. -
Page 136: Appendix A: Specifications
APPENDIX Appendix A Specifications Particulate Sensor Method Display Display Accuracy/ Range Resolution Repeatability Photometer 0.000- 200.0 mg /m 0.001 +/-15% (Calibrated to Arizona (Non-condensing) road dust; ISO 12103-1, A2 Fine Test Dust) 0 to 20,000 ug/m Particulates 0.1 – 10 μm *See note below Particulate Sensor - General Size... - Page 137 Appendix A Volatile Organic Compounds (VOCs) Gas Detector (PID Sensor) Method & Display Display Accuracy/ Detector Range Resolution Repeatability Low sensitivity PID 0.00 to 2,000 ppm; 0.01 ppm +/-5% / 2%; (relative (Non- condensing) Isobutylene) at cal value High sensitivity PID 0 –...
- Page 138 Maintenance and Cleaning Gravimetric cassette and filter paper Toxic Gas Sensors Accuracy/ Life expectancy/ Gas Type Display Display Repeatability warranty Range Resolution Carbon Monoxide (CO) 0 - 1000 ppm 1 ppm 5%/ 2% of signal 2 years/ 2 years Chlorine (CL 0.0 - 20 ppm 0.1 ppm 5%/ 2% of...
- Page 139 Appendix A Displayed Data Measurements Level, Minimum, Maximum, Average, Short- Term Exposure Level (STEL), Time Weighted Average (TWA) Real-time measurements Once per second display update rate Time history data logging intervals 1, 5, 15, 30 seconds, 1, 5, 10, 15, 30 and 60 minutes Trend graphing intervals for all 1.5, 3, 15 minutes, 1.5, 3, 8, 12 and 24 hours...
- Page 140 Appendix A Environmental effects The typical time interval needed to stabilize after changes in environmental conditions is 5 minutes for each 10º C change. Operating Temperature: 0 ºC to + 50 ºC (32 ºF to 122 ºF) Conditions Pressure Range: 65 KPa to 108 kPa Relative Humidity Range: 10% to 90%, Non-Condensing Storage Temperature: -20 ºC to + 60 ºC (-4 ºF to + 140 ºF)
- Page 141 Appendix A Measurements units Particulates mg/m Carbon Dioxide Relative Humidity ºC or ºF Temperature Toxic Gas ppm (Option) (Using one of Quest’s toxic sensors indicated in “Toxic Sensors”) VOC’s ppm or ppb (Options) (Using PID – 10.6eV Photo Ionization Detector) Air Velocity m/s or m/ft (Options) (Using external air probe accessory) Operating Modes...
- Page 142 Appendix A Special functions Auto-Run Programmable via the EVM setup screen or in QSP-II Security Securing or locking run mode and/or setup via the EVM setup screen or in QSP-II © Software User friendly compatible QuestSuite Professional II software available for advanced analysis with charts and graphs and reporting options Sensors Auto-detectable when inserted at powered-off mode and...
- Page 143 Appendix A Standard EVM-7 (continued) Run Time (Days) Logging Rate Number of Measurements Logged 1 seconds 5 seconds 15 seconds 19.4 30 seconds 38.7 19.4 12.9 1 minute 77.5 38.7 25.8 19.4 15.5 5 minutes 387.3 193.7 129.1 96.8 77.5 10 minutes 774.7 387.3...
- Page 144 Appendix A Standard EVM-4 (Memory and logged time) (Logging the following Sensors: Temp, Humidity, CO2, Toxic, Dew Pt) Run Time (Hours) Logging Rate Number of Measurements Logged 1 seconds 49.6 24.8 16.5 12.4 5 seconds 247.9 123.9 82.6 62.0 49.6 15 seconds 743.7 371.8...
- Page 145 Appendix A Standard EVM-3 (Memory and logged time) (Logging the following Sensors: Dust, Temp, Humidity, Dew Pt) Run Time (Hours) Logging Rate Number of Measurements Logged 1 seconds 49.6 24.8 16.5 12.4 5 seconds 247.9 123.9 82.6 62.0 49.6 15 seconds 743.7 371.8 247.9...
-
Page 146: Replacement And Optional Parts
Appendix A Replacement and optional parts **All accessories subject to change Base Unit Parts & Numbers Description 074-718 EVM Carry Case, with foam and labels 074-300 EVM Owner’s manual 053-263 12 VDC Universal input power supply 053-575 USB cable Particulate Parts & Numbers Description 100-456 Silicone dielectric grease for impactors... - Page 147 Appendix A PID Parts & Numbers Description 074-713 PID PPM smart sensor (includes pellet removal tool) 074-080 PID PPM cleaning kit 074-081 PID PPM replacement lamp 074-082 PID PPM replacement electrode (grid) pellet 074-097 PID PPB smart sensor 074-098 PID PPB replacement lamp 100-460 10 PPM isobutylene cal gas 100-459...
-
Page 148: Appendix B: Customer Service
Quest by using the e-mail, telephone, or fax information given under “Contacting 3M Quest Technologies” above. Calibration The EVM Series and 3M Quest field calibrator devices should be examined regularly by the factory. An annual calibration is recommended. (Please see Service Department above.) -
Page 149: Warranty
Quest distributor or our 3M Quest European Service Laboratory. Foreign purchasers should contact the local 3M Quest authorized sales agent for detail. -
Page 150: Appendix B: Glossary Of Terms
APPENDIX Appendix B Glossary of Terms ACGIH The American Conference of Governmental Industrial Hygienists organization in the United States. Air monitoring Sampling for pollutants in the air using a variety of means such as sorbent tubes, bags, filters and sampling conventions. Air pollutant Any substance in air that could, in high enough concentration, harm man, other animals, vegetation, or material. - Page 151 Appendix B Calculating particulate matter The worker exposure assessment, on the EVM, is based on a gravimetric analysis with filter samples drawn over a period time. If acute effects exist from personal inhalable dust, the sampling analysis allows for short term analysis (STEL). Ceiling This is the maximum allowable concentration of a chemical that an employee may be exposed to.
- Page 152 Appendix B Dust monitoring Dust is typically known as a type of particulate matter or an aerosol with a miniscule diameter of 0.1 μm upwards. Filtered CO sensor vs. Unfiltered There is a high cross-sensitivity between CO and H S. A filtered CO sensor lessens the sensitivity of the sensor to H Fire Triangle A term for the three components required to start a fire: fuel, oxygen, and ignition.
- Page 153 Appendix B Measurement parameters The following measurements are displayed on the instrument and in the Logged data table/chart in QSP- Average The measurement value over the time interval (or logging interval) Level The instantaneous measurement at a specific point in time. ...
- Page 154 Appendix B Peak The highest level of toxic gas or oxygen reached while the unit is on. PEL (Permissible Exposure Limit Permissible exposure limit. PEL's are a regulatory limitation to exposure used to specify the allowable exposure to a substance in the workplace and assume that the exposure takes place over an 8-hour shift in a 40-hour work week.
- Page 155 Appendix B Relative Humidity The relative humidity of an air-water mixture is defined as the ratio of the partial pressure of water vapor in the mixture to the saturated vapor pressure of water at a prescribed temperature. This can be calculated by dividing the temperature and dew point readings and multiplying by 100%.
-
Page 156: Appendix C: Pid Sensor And Correction Factors Tables
APPENDIX Appendix C: PID cal. correction factors Appendix C PID sensor and correction factors tables The following chart details approximate correction factors (or response factors) for specific concentrations of VOCs. It is recommended, for best test results, to calibrate the PID sensor with the relevant VOC you intend to measure. - Page 157 Appendix C: PID cal. correction factors Attention: In the table below, a Correction factor listed as “NR” indicates no response since not all VOCs or gases can be measured with a PID sensor. NOTE: The “Typical minimum detection level” is listed in parts per billion ...
- Page 158 Appendix C: PID cal. correction factors Gas/VOC Formula Correction Relative Typical (used to factor sensitivity PID (ppb) convert ppm measurement to mg/m Benzyl formate C8H8O2 Biphenyl C12H10 Boron trifluoride Bromine 2000 Bromine pentafluoride BrF5 Bromobenzene C6H5Br Bromochloromethane CH2ClBr Bromoethane C2H5Br Bromoethyl methyl ether C3H7OBr Bromoform...
- Page 159 Appendix C: PID cal. correction factors Gas/VOC Formula Correction Relative Typical (used to convert factor sensitivity (ppb) measurement to mg/m 10.0 Dibromochloromethane CHBr2Cl 1000 Dibromodifluoromethane CF2Br2 ZR Dibromoethane 1,2- C2H4Br2 Dibromotetrafluoroethane, C2F4Br2 1,2- Dibutyl hydrogen phosphate HC8H18 Dichloro-1,1,1- C2HCl2F3 trifluoroethane, 2,2- C2H2Cl2F2 Dichloro-1,1- difluoroethane, 1,2-...
- Page 160 Appendix C: PID cal. correction factors Gas/VOC Formula Correction Relative Typical (used to factor sensitivity convert ppm (ppb) measurement to mg/m Dimethoxymethane C3H8O2 Dimethyl cyclohexane, 1,2- C8H16 Dimethyl disulphide C2H6S2 Dimethyl ether C2H6O Dimethyl phthalate C10H10O4 Dimethyl sulphate C2H6O4S Dimethyl sulphide C2H6S Dimethylacetamide N,N- C4H9NO...
- Page 161 Appendix C: PID cal. correction factors Gas/VOC Formula Correction Relative Typical (used to factor sensitivity convert ppm (ppb) measurement to mg/m Ethyl benzene C8H10 Ethyl butyrate C6H12O2 Ethyl chloroformate C3H5O2Cl 8300 Ethyl cyanoacrylate C6H7O2N Ethyl decanoate C12H24O2 Ethyl formate C3H6O2 3000 Ethyl hexanoate C8H16O2...
- Page 162 Appendix C: PID cal. correction factors Gas/VOC Formula Correction Relative Typical (used to factor sensitivity convert ppm (ppb) measurement to mg/m Hydrogen Hydrogen bromide Hydrogen chloride Hydrogen cyanide Hydrogen fluoride Hydrogen peroxide H2O2 Hydrogen sulfide Hydroquinone C6H6O2 Hydroxypropyl acrylate 2- C6H10O3 Iminodi(ethylamine) 2,2- C4H13N3...
- Page 163 Appendix C: PID cal. correction factors Gas/VOC Formula Correction Relative Typical factor sensitivity (used to convert ppm (ppb) measurement to mg/m Mercury alkyls Mesitylene C9H12 Methacrylic acid C4H6O2 Methacrylonitrile C4H5N Methane Methanol CH4O 20000 Methoxyethanol, 2- C3H8O2 Methoxyethoxyethanol, 2- C5H12O3 Methoxymethylethoxy-2- C7H16O3 propanol...
- Page 164 Appendix C: PID cal. correction factors Gas/VOC Formula Correction Relative Typical (used to factor sensitivity convert ppm (ppb) measurement to mg/m Methylpent-3-en-2-one, 4- C6H10O Methylpentan-2-ol, 4- C6H14O Methylpentane-2,4-diol, 2- C6H14O2 Methylpropan-2-ol, 2- C4H10O Methylstyrene C9H10 Mineral oil Mineral spirits Naphthalene C10H8 Nitric oxide Nitroaniline...
- Page 165 Appendix C: PID cal. correction factors Gas/VOC Formula Correction Relative Typical factor sensitivity (used to convert ppm measurement to (ppb) mg/m Phenol C6H6O Phenyl propene, 2- C9H10 Phenyl-2,3-epoxypropyl ether C9H10O2 Phenylenediamine C6H8N2 Phosgene COCl2 Phosphine Picoline C6H7N Pinene, alpha C10H16 Pinene, beta C10H16 Piperidine...
- Page 166 Appendix C: PID cal. correction factors Gas/VOC Formula Correction Relative Typical (used to convert ppm factor sensitivity measurement to mg/m (ppb) Tetrachloro-1- C2HCl4F fluoroethane, 1,1,2,2- Tetrachloro-2,2- C2Cl4F2 difluoroethane Tetrachloro-2- C2HCl4F fluoroethane Tetrachloroethane, 1,1,1,2- C2H2Cl4 Tetrachloroethane, 1,1,2,2- C2H2Cl4 Tetrachloroethylene C2Cl4 Tetrachloronaphthalenes, C10H4Cl4 all isomers Tetraethyl orthosilicate...
- Page 167 Appendix C: PID cal. correction factors Gas/VOC Formula Correction Relative Typical factor sensitivity (used to convert ppm measurement to mg/m (ppb) Trichlorobenzene 1,2,4- C6H3Cl3 Trichloroethane, 1,1,1- C2H3Cl3 Trichloroethane, 1,1,2- C2H3Cl3 Trichloroethylene C2HCl3 Trichlorofluoromethane CCl3F Trichloronitromethane CCl3NO2 Trichlorophenoxyacetic C8H5O3Cl3 acid, 2,4,5- Trichloropropane 1,2,3- C3H5Cl3 Trichlorotrifluoroethane, 1,1,1-...
-
Page 168: Appendix D: Faq's; Particulate Measurements
(2) The instrument is exposed to oily or wet mists. (3) The readings are falling lower and lower indicating the mirror is dirty. (Please see Chapter 7 of the EVM series manual for details on cleaning and maintenance.) - Page 169 Appendix D: FAQ’s Question: How many correction factors can be stored on the monitor and in QSP-II? Response/Solution: The EVM supports 8 different particulate matter (PM) configurations/profiles with customized name settings and user correction factor settings. See Chapter 3 for instrument profile set-up or Chapter 6 for QSP-II set-up for more details. Question: What if I want to enter in the correction factor after running/logging particulate measurements? Response/Solution: You can adjust/change the correction factor in QuestSuite Professional II after the session has been downloaded.
- Page 170 Appendix D: FAQ’s 3. How often do we need to calibrate the pump? Response/Solution: Quest Technologies recommends an annual factory calibration. If the user has an accurate flow meter, such as a bubble-flow meter, the user may perform more periodic pump calibrations. 4.
- Page 171 Question: Do you have a correction factor chart (or a library of PID correction factors) for various VOCs? Response/Solution: Quest has included a correction factor chart with the various VOC’s in Appendix C of the EVM series user manual. Please reference as needed.
- Page 172 Pump Flow rate An accurate flow meter (i.e., bubble-flow meter) and tubing is required to perform this calibration. The tubing and flow meter are connected to the back outlet or in the turret. (Please see the EVM Series manual for details.) Temperature An accurate temperature sensing instrument (i.e., thermometer) is required to perform this calibration.
-
Page 173: Appendix E: System Errors Displayed On The Evm Series
Appendix E: System errors displayed on the EVM Appendix E System errors displayed on the EVM series There are two types of pop-up notifications that may appear on your instrument. Monitor system errors – The EVM is equipped with numeric system errors which range from 101- 108. - Page 174 Appendix E: System errors displayed on the EVM System errors displayed on the EVM series Monitor Errors Explanation Invalid impactor setting to When the impactor reads at an incorrect setting, it will not allow you start logging to log without turning the turret to a correct setting.
- Page 175 INDEX INDEX %..................84 Toxic Gas overview ............63 ACGIH Verify calibration ............77 Defined ................ 140 Zero cal and span cal for CO2 or for 02 sensor ..67 Air monitoring Zero cal for toxic gas ............. 63 Defined ................
- Page 176 Can we adjust the flow rate ........160 Defined ................ 142 Can we run the unit without a cassette ....... 159 Gravimetric cassette and filter paper ........ 125 Does 3M Quest offer cassettes ........159 Replacing ..............125 Gravimetric cassette sizes .......... 159 Hazardous Atmosphere Gravimetric Sample Defined ................
- Page 177 INDEX Measurements units Specifications ..............131 Defined ................ 144 Measuring Photodiode Changing views ............. 88 Defined ................ 144 Logged data ..............81 PID sensor Quick help list ..............80 Correction factor setup screen ........28 Sample summary data in QSP-II ........81 PID sensor &...
- Page 178 INDEX Particulates ..............30 Specifications .............. 128 Profile field ..............30 Trend data screen Pump: enable or disable ..........33 About ................93 Resetting the Gravimetric ..........33 Trend Screen ............... 94 Temperature and air velocity ........29 Trend softkey ............... 86 Time and Date ..............
- Page 179 Quest products are used in more than 80 countries worldwide. 3M Quest has a strong reputation of rugged, reliable instrumentation and software systems that monitor and evaluate occupational and environmental health and safety hazards including noise, vibration, heat stress, indoor air quality and toxic/combustible gases.
Need help?
Do you have a question about the EVM Series and is the answer not in the manual?
Questions and answers