
Related Manuals for 3M Edge eg5


Summary of Contents for 3M Edge eg5
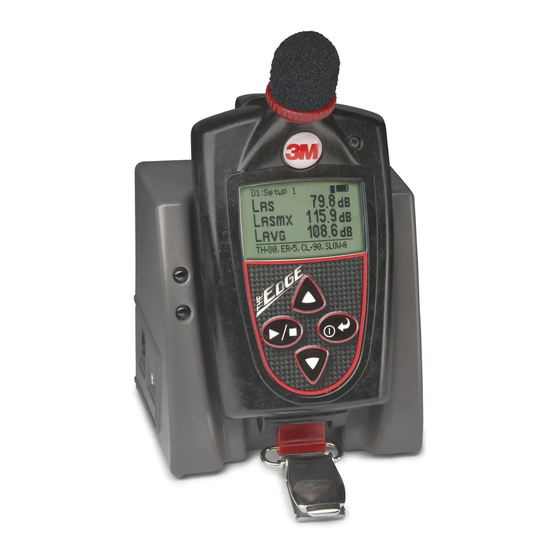
- Page 1 3M Personal Safety Division 3M™ The Edge eg5 Personal Noise Dosimeter The EDGE MODEL eg5 Intrinsic Safety eg5 User Manual (Intrinsic Safety)
- Page 2 Contacting 3M Quest Should your 3M Quest Technologies equipment need to be returned for repair or for recalibration, please contact the service department at the following number or access the online form via the website. For technical issues, please contact Technical Support.
- Page 3 SIRA Certification: EC Type-Examination Certificate Equipment intended for use in Potentially Explosive Atmospheres Directive 94/9/EC Safety Markings Manufacturer Quest Technologies, a 3M company Equipment/model eg5 Dosimeter Certificate number Sira 09ATEX2269 Compliance with safety markings EN 60079 – 0:2006; EN 60079-11:2007; EN60079-26-2007...
- Page 4 Edge Dosimeter battery care best practices. The Edge dosimeter incorporates a Lithium Polymer battery as a power source that with proper care should give years of operational service. (Three years is typical.) Proper care includes these best practices: After use, it is best to charge the Edge in an EdgeDock charger prior to storage for a prolonged period.
-
Page 5: Table Of Contents
Table of Table of Contents Contents Table of Contents Chapter 1: Introduction ......................1 Dosimetry ............................1 Overview ............................. 1 Noise dosimeter ..........................2 Range of sound ..........................3 What do the standards say? ......................3 Applications of the Edge ........................4 Noise assessment steps ........................ - Page 6 Table of Contents Chapter 3:Setting-up the Edge via DMS ................16 Noise studies............................. 16 Understanding what data is stored....................17 Summary data ..........................17 Time history………………………………………………………………………………………………………..17 Logging ............................18 Views on the Edge ..........................18 Definitions of data log values and views ..................18 Edge Measurement descriptors/variants ..................
- Page 7 Replacing microphone and windscreen .................... 42 Attaching/Detaching ........................42 Hard Hat Attachment Kit ........................43 Appendix A: Specifications ....................44 3M Service ............................51 Contacting 3M ..........................51 International customers ........................51 Warranty............................51 Appendix B: Glossary of Terms ..................52 Appendix C: Measurement Equations ………………………………………………………..79...
- Page 8 Table of Contents List of Figures Figure 1-1: Sample Edge Dosimeter…………………………………………………………………………………………………..….……1 Figure 1-2: Illustration of how the dosimeter operates and processes....................2 Figure 1-3: Parameter setup screen for eg5 ............................6 Figure 2-1: Identifying your equipment ..............................7 Figure 2-2: Powered on with measurement view displayed ......................... 8 Figure 2-3: Edge Keypad ..................................
- Page 9 viii This page left blank intentionally...
-
Page 10: Chapter 1: Introduction
CHAPTER Dosimetry Introduction Dosimetry Measuring noise in the workplace is an important element of hearing conservation programs and noise reduction programs. With a noise dosimeter, you can assess and determine a worker’s daily exposure to noise levels. This information can be used to ensure compliance with regulatory bodies or to ensure if hearing conservation programs are needed. -
Page 11: Noise Dosimeter
Overview Noise dosimeter Noise dosimeter What is a noise dosimeter and how does it compute measurements? Essentially, a noise dosimeter is composed of the following: a microphone with a preamplifier, a weighted network, fast or slow response time, an internal clock, calculator, and memory to store logged data. -
Page 12: Range Of Sound
Overview Range of sound Range of sound Sound pressure is measured in decibels, or tenths of a Bel. Sound pressure level is indicated as dB SPL. Since the human ear can detect sounds with an extensive range of amplitude, a decibel scale is used to simplify the measurement results. -
Page 13: Applications Of The Edge
Overview Applications of the Edge Applications of the Edge The Edge has a cable-free, mounted microphone that converts sound pressure into an electrical signal. This signal is conditioned, monitored, and integrated over time in order to provide a host of automatically calculated values that can be used in occupational and environmental noise assessments. -
Page 14: Noise Assessment Steps
Run, observe, and stop your studies. Understand display indicators. See Chapter 4 “Running and operating the Edge”. View your results via 3M Detection Management Software (DMS). Working with Charts and Graphs. Organizing and saving your studies. -
Page 15: Eg5 Overview
Overview eg5 Overview eg5 Overview The “eg5” model is an intrinsically safe instrument featuring simultaneous C and A weighted measurements. The instrument will also calculate C-A. The “eg5” model features two virtual dosimeters with data logging. Once the parameters are set and saved in the dosimeter, you can monitor two different dosimeters by a single press of the Enter button. -
Page 16: Chapter 2 : Getting Started
NOTE: Depending on the accessories you selected, the dosimeter may have the following components. For the docking stations, you will either have an EdgeDock1 or an EdgeDock5. (For more information on parts/accessories, please refer to www.3m.com/detection.) USB cable- connects EdgeDock to the PC Edge 5 ... -
Page 17: Turning On
Turning on eg5 Overview Turning on 1. To turn on the Edge, press the on/off and enter button. The Edge splash screen (see Figure 2-3 for an example, page 10) will appear indicating the model (i.e. “eg5”) and firmware version. The screen will be in the measurement view. LED Indicator Battery indicator icon If icon is fully shaded, this indicates full... -
Page 18: Led Indicator
Turning off LED indicator LED indicator There is a three-color LED indicator on the Edge, located to the right of the 3M logo. Table 2-1 explains when and why the LED indicator color will appear. NOTE: The LED indicator can be disabled via DMS (see section, “Explanation of setting LED in DMS”.) -
Page 19: Display And Keypad
Display and keypad Diagram Display and keypad The keypad is used to run and stop your studies, view your measurement values, and power on and off the dosimeter. Diagram The following diagram explains the features on the display and keypad. Windscreen and microphone LED indicator ... -
Page 20: Tm Detection Mangement Software (Dms)
To load DMS software, follow the instructions on the back of the CD or download a trial version from www.3m.com/dms. It will automatically load the drivers for the EdgeDock1 and/or EdgeDock5. If loading from 3M Internet site, please follow the directions online. -
Page 21: Docking Station Components
Docking station functionality Docking station components Docking station components The table below explains the EdgeDock1 or EdgeDock5 LED indicators, power connector, USB connector, and contact pins. Docking station Explanation components Charging indicator Identifies if the dosimeter is “charging” or “fully charged”. A red blinking LED indicates the dosimeter is charging. -
Page 22: Powering Edgedock1 Or Edgedock5
Docking station functionality Powering EdgeDock1 or EdgeDock5 Powering EdgeDock1 or EdgeDock5 Powering EdgeDock1 or EdgeDock5 1. Assemble the charger adapter and plug adapter as illustrated in Figure 2-5. (It will be the same process for an EdgeDock5.) 2. Plug the charger adapter directly into the wall (electrical wall plate). 3. -
Page 23: Charging Your Dosimeter
Docking station functionality Charging your dosimeter Charging your dosimeter The number of hours you have used your dosimeter from your last charge will impact your total charge time. For example, if the battery clock indicator (see “Checking the battery power” for more information) displays 20 hours remaining on the battery and you wish to charge the battery, the approximate charging time is 2 hours. -
Page 24: Mounting The Docking Station To A Wall
Docking station functionality Mounting the docking station to a wall Mounting the docking station to a wall The docking station is equipped with two single screw slots in case you wish to mount the docking station to the wall. The figure below displays the backside of the single bay dock. Screw slots Used to mount to a wall Figure 2-8: Backside of EdgeDock1... -
Page 25: Chapter 3:Setting-Up The Edge Via Dms
CHAPTER Noise studies Storing the dosimeter Setting-up the Edge via DMS Chapter 3: Noise studies The eg5 model comes equipped with two customizable user setups. You have the option to customize the parameters for threshold values, exchange rate values, filtering, C-A measuring, an upper limit value, and a criterion level. -
Page 26: Understanding What Data Is Stored
Understanding what data is stored Summary data Understanding what data is stored When you are running noise dosimetry studies, there are two types of data stored on the dosimeter which include the summary data and time history (or Logged) data. Summary data Summary data represents values that occurred over the entire run of the study. -
Page 27: Logging
Views on the Edge Logging Logging eg5 model only logs at one minute intervals and includes the following measurements: Meter 1 logs L • Meter 2 logs L Meter 3 logs L • Lc and L Lc-a (if enabled) ... - Page 28 Views on the Edge Definitions of data log values and views Views on the Edge Explanation Time-weighted average - is the sound level (in dB) that is accumulated for any time period but with its average level computed over an 8-hour period. TWA is usually measured with A-weighting, Slow response, and a 5dB exchange rate.
-
Page 29: Edge Measurement Descriptors/Variants
Views on the Edge Edge Measurement descriptors/variants Views on the Edge Explanation Memory storage symbol – eg5: The eg5 model displays the total memory storage remaining in hours and minutes. For example, if it displays the memory symbol 100:50 this represents 100 hours and 50 minutes of memory storage remaining on the dosimeter. -
Page 30: Docking
Docking Communicating & downloading data Docking Communicating & downloading data By using your docking station, USB cable, software, and your dosimeter, you can quickly communicate between the software and the dosimeter. There are two methods for communicating which are: Send setup data: Enables you to configure your set-up parameters in Detection Management Software (DMS) and download these parameters to the Edge. -
Page 31: Customizing Set-Up Parameters In Dms
Customizing set-up parameters in DMS For first time use of a docking station, Welcome to the found new hardware wizard will appear (see Figure 2-8). Select No and press Next through the remaining wizard. At the end of the wizard, press Finish. -
Page 32: Dosimeter Setting
Customizing set-up parameters in DMS Dosimeter setting Dosimeter setting The Edge general settings are used to setup the instrument with basic parameters. The eg5 model features three dosimeters in one with three customized, user-defined settings. Please refer to the General Edge parameters table below for details. -
Page 33: Display Setting
Customizing set-up parameters in DMS Display setting Dose indicator LED When enabled (or checked), the LED will flash red when the dose value exceeds the designated entered value. Setup name (Optional field) A setup name may be entered into the Meter 1 and/or Meter 2 fields. -
Page 34: Security Setting
Customizing set-up parameters in DMS Security setting Security setting The security setting is a type of “locking” feature (or secure run feature) that enables you to password protect the instrument to prevent users from inadvertently terminating a study. Initially, this feature is set through the software and turned on once in run mode by pressing run/stop key three consecutive times. -
Page 35: Firmware Update
Customizing set-up parameters in DMS Firmware update Firmware update Edge firmware updates are performed in DMS when the instruments are docked, communicating, and the update key is selected. Please follow the steps below prior to updating your Edge(s). Note: this feature enables you to update all of your docked Edges (when powered on and not in run mode). -
Page 36: Saving And Sending Configurations
Customizing set-up parameters in DMS Saving and sending configurations Saving and sending configurations With the Edge, there are saved setup profiles used to quickly access and apply to The Edge(s). Below explains how to save configuration settings in DMS and how to send to the instrument. Note: if you wish to only send the setup, please skip to step 3. Please refer to this section as you setup your instrument. -
Page 37: Chapter 4: Running And Operating
CHAPTER Overview of running a study Running and operating As explained in Chapter 3, the view of your display is customizable via DMS. NOTE: The subsequent sections show examples of views which you may have disabled on your dosimeter. (Please refer to Chapter 3, “Setting up the Edge via DMS”.) Overview of running a study The list below is a brief overview of the steps for running a study. -
Page 38: Positioning The Edge On Your Shirt
Depending on what accessories you ordered with the Edge, you may have either clips on the top and bottom of the dosimeter or some other type of mounting device. (Please refer to Appendix A, “Contacting 3M”). How to attach the dosimeter Clip the dosimeter on your shirt and ensure the microphone is positioned as high on your shoulder as possible and away from your neck. -
Page 39: Checking Battery Power
Overview of running a study Checking battery power Checking battery power Typically, the life of the battery is approximately 40 hours nominal without LED activated (see Appendix A for specific specifications). It is recommended to perform a daily download of the measured data while simultaneously charging the battery for maximum efficiency. -
Page 40: Calibrating
Overview of running a study Calibrating Calibrating It is recommended to calibrate your dosimeter before you run your study(ies) and after your study(ies) to ensure highly accurate measurement results. The steps below address how to calibrate for either a pre or post calibration. -
Page 41: Resetting The Dosimeter
Overview of running a study Resetting the dosimeter Resetting the dosimeter The Edge can be reset through the dosimeter keypad or via DMS. The steps below outline how to reset your dosimeter. Reset Ensure the meter is Off. Turn the meter on by pressing the button. -
Page 42: Adjusting The Contrast On The Edge
Overview of running a study Adjusting the contrast on the Edge Adjusting the contrast on the Edge Contrast 1. Ensure the meter is Off. 2. Turn the meter on by pressing the button. 3. When the splash screen appears, press and hold the buttons. -
Page 43: Running Studies
Running studies Starting a run Running studies With a couple pushes on the keypad buttons, you will be running and viewing your study (ies). Following your study (ies), you can load the data/files into DMS to manipulate, analyze, save, and create reports (See Chapter 5 for viewing your logged data in DMS). -
Page 44: Stopping A Study
Stopping a study Indicators/Icons on the display Stopping a study While the dosimeter is running, you can end the study by pressing and holding the stop button. How to stop a noise study 1. While running, press and hold the button. -
Page 45: Locking Or Securing
Viewing measurements on the display Locking or Securing Locking or Securing How to lock or secure 1. Turn the dosimeter on and press the button to begin logging your study. 2. To enable the lock, press button three consecutive times within one second intervals. ... -
Page 46: Viewing Your Studies In Dms
CHAPTER Viewing measurements on the display Downloading data Viewing your studies in DMS The focus of this chapter is to discuss how to view your studies via Detection Management Software. The first section explains how to retrieve your studies from the dosimeter, and the subsequent sections will then walk you through viewing, organizing, and customizing your studies. -
Page 47: Figure 5-3: Downloading In Dms With The Edge
Viewing measurements on the display Downloading data 5. Select Noise Dosimetry (see 1), Edge (see 2), and Edge 5 (see 3). Select the docked Edge (s) to download (see 4). 6. Click button. In the status field, it will state download is successful. ... -
Page 48: Viewing Data And Data Finder Page
Viewing measurements on the display Viewing data and data finder page Viewing data and data finder page When you download the data via the the download feature, the data is stored and viewable via the data finder page with advanced charting, tables, and reporting capability. The information is viewable in customizable graphs and/or with measurements/parameters displayed on the top navigational bar. -
Page 49: Panel Layout View(Charts/Graphs)
Viewing measurements on the display Panel Layout View(charts/graphs) Panel Layout View(charts/graphs) When you are in the data finder page (see above), select either the Analyze button or double-click on a session/study to view the data in charts and graphs as displayed in Figure 5-6. The measurements and parameters will be displayed in charts and graphs which may be customized for analysis and/or reporting purposes. -
Page 50: Chapter 6: Technical Support
CHAPTER Technical Support Technical Support Setting up and Viewing C-A measurements With the eg5 model, you have the option of enabling c-a measurement and viewing the values in tables and charts (also called “panels”). For your setup parameters, c-a is selected via the Setup button of DMS’s dosimeter screen. A quick checkmark of C minus A activates this measurement and is viewable on the display if it is turned on in the Display screen (refer to “Dosimeter setup”... -
Page 51: Led Indicator: Disable/Enable
Technical Support LED indicator: disable/enable Some users may prefer to turn off the LED indicator. To disable this feature, open DMS, select setup button from start screen and then select the Edge (ensuring it is setup to communicate). Under the Setup Dosimeter tab, uncheck the Dose Indicator ... -
Page 52: Hard Hat Attachment Kit
Hard Hat Attachment Kit Attaching/Detaching Hard Hat Attachment Kit The following instructions explain how to assemble and attach the hard hat kit to a standard hard hat. Hard Hat Attachment kit A. Epaulette mount B. Hard hat mount Using a 3/32” hex wrench, twist the top shoulder bolt counterclockwise to loosen and remove the bolt and the clip. -
Page 53: Appendix A: Specifications
CSA International (US and Canada) certificate number: 2283414 MSHA Approval number: 18-A100008-0 Safety Markings Manufacturer Quest Technologies a 3M company Equipment/model eg5 Dosimeter Code Ex ia I/IIC 143ºC IP65 Ambient temp. range: -10ºC<Tamb<+50ºC (Alternate Code) Ex ia I/IIC T4 IP65 Ambient temp. -
Page 54: User Interface
Appendix A Power/Electrical characteristics Life Up to 40 hours of continuous operation at normal operation without LED activated under reference to environmental conditions when full capacity batteries are installed. It is recommended to charge the battery frequently for maximum efficiency. Type Lithium Polymer (Flat cell) Memory capacity... - Page 55 Appendix A EdgeDock1 and EdgeDock5 EdgeDock1 and EdgeDock5 are powered by a 12-volt charger adapter with international plug adapters. The backside of the Edge slides into the hook of the EdgeDock1 or EdgeDock5 with the mounting clasps rotating to a 90 degree angle (which will rest on a table/work area).
- Page 56 Appendix A Measurements Types Displayed Data and SPL, Average value (L or L ), Maximum value (L status indicators Minimum value (L ), Peak Value (LCPK), Exposure, Run Time, TWA, UL Time, L Measurement parameters Dosimeters Up to three dosimeters at once (eg5), each with its own assignable profile (via DMS only).
-
Page 57: Special Functions
Appendix A Calibration Pre-calibration When performed, valid prior to the start of the study. Post-calibration When performed, valid for the previous study. Storage Calibrations for a study are stored in the related study file. Calibrator requirement Calibrations should be performed at 114 dB at 1kHz. Communications The Edge communicates via the EdgeDock1 and/or the EdgeDock5. - Page 58 Appendix A Edge Block Diagram Analog Board...
- Page 59 Appendix A Edge Block Diagram (continued)
-
Page 60: 3M Service
3M Service Contacting 3M Should your 3M equipment need to be returned for repair or for recalibration, please contact the service department at the following number or access the online form via the website. For technical issues, please contact Technical Support. -
Page 61: Appendix B: Glossary Of Terms
APPENDIX Appendix B Glossary of Terms Background Noise, effects of Background noise can cause considerable error in measurement when its level is high relative to the level of a noise source of interest. If you can make measurements both with and without the contribution of a noise source of interest, you can mathematically subtract the background noise from the combined measurement, yielding the level of the noise source of interest alone. - Page 62 Appendix B The C-A measurement is an L that enhances the low- frequency components of the sound signal. It is the result of subtracting an A-weighted L from a simultaneously collected C-weighted L and is sometimes used as the NRR (noise reduction rating) factor to determine if hearing protection devices are adequate for usage in the field.
- Page 63 Appendix B Crest Factor Crest Factor is the ratio of the instantaneous peak value of a wave to its RMS value. This is a performance specification of a meter’s ability to process signals that have peaks that are substantially higher than their RMS averages. Criterion Level (CL) Criterion level is the average SPL that will result in a 100% dose over the Criterion time, usually 8 hours.
- Page 64 Appendix B Exchange Rate (ER – also known as the Doubling Rate) Exchange rate refers to how the sound energy is averaged over time. (Also, referred to as Doubling Rate.) Using the decibel scale, every time the sound energy doubles, the measured level increases by 3dB. This is the 3dB exchange rate that most of the world uses.
-
Page 65: Measurement Range
Appendix B Logging (Also called Data Logging.) Certain measurements, such as average level (Lavg) and maximum level (max), can be recorded by the dosimeter at regular intervals. For example: A dosimeter is set to log Lavg and max at one minute logging intervals. If the dosimeter runs for one hour, then it would log 60 Lavg results and 60 max levels. -
Page 66: Response Time
Appendix B Response Time The response determines how quickly the unit responds to fluctuating noise. Fast has a time constant of 125 milliseconds. Slow has a time constant of 1 second. Example: Typically, noise is not constant. If you were to try to read the sound level without a response time, the readings would fluctuate so much that determining the actual level would be extremely difficult. - Page 67 Appendix B then measure for the entire 6.5 hours. TWA is the correct level to report to OSHA. It does not have to be modified. Weighting (A, C, Z, etc.) “A”, “B”, “C”, “Z” and LINEAR are the standard weighting networks available. These are frequency filters that cover the frequency range of human hearing (20Hz to 20 kHz).
-
Page 68: Appendix C: Measurement Equations
APPENDIX Appendix C Appendix C Measurement equations... - Page 69 Appendix C Variables used in equations...
-
Page 70: Index
INDEX Index INDEX Attaching Edge the Edge ............... 29 Positioning ..............29 Edge Dock New hardware wizard..........22 EdgeDock1 ................37 Background Noise, effects of EdgeDock1 and EdgeDock5 ..........21 Defined ................52 eg4 6 Battery Checking ............... 30 Memory storage ............20 Battery charge status ............ - Page 71 Index Overview ............... 28 Running studies Maximum Level steps ................34 Defined ................56 Measurement Range Defined ................56 Memory storage symbol ........... 20 Securing run mode............36 Mount the docking station ........... 15 Defined ................57 Sound pressure ..............3 Splash screen ..............
- Page 72 The 3M Detection brand of instrumentation is used by safety and industrial hygiene professionals to help comply with applicable occupational standards and regulations.
Need help?
Do you have a question about the Edge eg5 and is the answer not in the manual?
Questions and answers