
Related Manuals for Awareness Technology Stat Fax 4700


Summary of Contents for Awareness Technology Stat Fax 4700
- Page 1 Stat Fax 4700 ® MICROSTRIP READER ’ ’ © Awareness Technology Inc. 2010 Doc. 4700 Revised 2018 Rev. G...
-
Page 3: Table Of Contents
TABLE OF CONTENTS 1. Introduction ...................... 1 1.1 Applications ..........................1 1.1.1 Intended Use ........................1 1.1.2 Summary of the Instrument ....................1 1.1.3 Principles of Operation ...................... 2 1.2 Warning Markings Inscriptions d’avertissement ..............3 1.2.1 Safety Symbols Le Symboles de Sûreté ................3 1.2.2 Safety Terms Terminologie de Sûreté... - Page 4 4. Troubleshooting ..................... 50 4.1 Messages and Flags ......................50 4.2 Error Messages ........................53 5. References...................... 55 6. Optional Accessories ..................55 6.1 Thermal Printer Paper ......................55 6.2 Dri-Dye® Check Strips ......................55 7. Information ..................... 56 8. Appendix A – SF_Capture ................57 9.
-
Page 5: Introduction
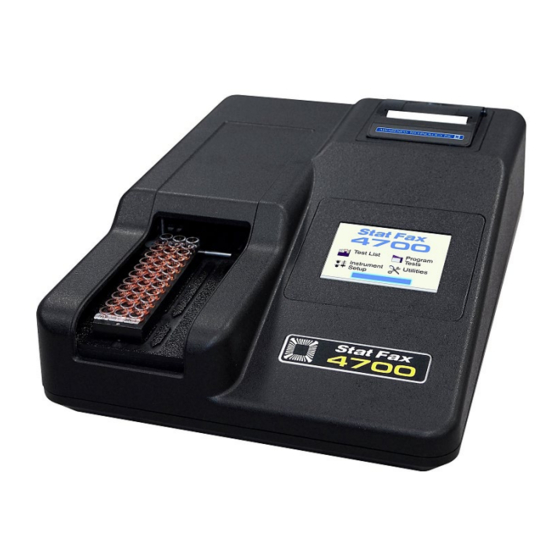
1. Introduction 1.1 Applications 1.1.1 Intended Use The Stat Fax 4700 is a compact, microprocessor-controlled, multi-purpose photometer ® system designed to read and calculate the results of assays, which are read in microtiter strips or break apart wells. The Stat Fax 4700 may be used for in-vitro diagnostic testing. -
Page 6: Principles Of Operation
Summary of the Instrument (Continued) The Auto-Track feature enables all three strips to be read automatically, rather than having to read each strip individually. The Stat Fax 4700 uses a specialized strip carrier. Be sure ® to use only this carrier. Starting from Position A (home position), the Auto-track feature transports the carrier such that all of the wells in all strips in the carrier are read;... -
Page 7: Warning Markings Inscriptions D'avertissement
1.2 Warning Markings Inscriptions d’avertissement 1.2.1 Safety Symbols Le Symboles de Sûreté Symbols that may appear on the product: Les symboles de sûreté peuvent apparaitre sur le produit: WARNING Protective Ground CAUTION BIOHAZARD AVERTISSEMENT La Terre Electrique L’ATTENTION BIOHAZARD Risk of Shock (Earth) Terminal Refer to Manual Risk of Infection... -
Page 8: Safety Precautions
1.3 Safety Precautions To assure operator safety and prolong the life of your instrument, carefully follow all instructions outlined below. Read Instructions Take time to read this manual carefully before using this instrument. Review the following safety precautions to avoid injury and prevent damage to this instrument or any products connected to it. - Page 9 Safety Precautions (Continued) Do Not Operate With WARNING: If you suspect there is damage to this instrument, have it Suspected Failures inspected by a qualified service person. Do Not Operate in WARNING: Do not operate instrument in wet/damp conditions. Wet/Damp Conditions Do Not Operate In An WARNING: Do not operate instrument in an explosive atmosphere.
-
Page 10: Specifications
1.4 Specifications Photometric Linear Measurement Range: .... 0.00 to 3.0 Absorbance Units (A) Photometric Accuracy: ..... +/- (1% +/- 0.010) 0.0 through 1.5 ABS ............+/- (2% +/- 0.010) 1.5 through 3.0 ABS Stability: ..........Drift of no more than 0.005A in 8 hours bichromatic Light Source: ........ - Page 11 Calculation Modes: ......Single point calibration by standard or factor, multi-point calibration with point-to-point curve fit, linear regressions with log, linear, and log-logit selections, cubic spline and cut off mode selections Test Storage: ........Total of 120 open channels to store tests. Stores all parameters including wavelengths, calculations, unit codes, ranges, interpretations, calibrator values, test names, and previous curve...
-
Page 12: Installation
1.5 Installation 1.5.1 General Carefully unpack the instrument, removing it from its plastic bag. Report any damage to your freight carrier at once. Retain the original packing material for future use in the event that the instrument is shipped to another location or returned for service. The operator’s manual, stylus, thermal printer paper, power supply module, and a spare parts kit will be packed with the instrument. -
Page 13: Installation/Preparation
1.5.2 Installation/Preparation Instrument Placement Place the instrument on a flat working surface capable of safely and Use supporting the weight of the instrument, approximately 2.3kg (5 lbs.). A clearance of at least 8cm (3”) around the instrument is required to assure optimal ventilation. -
Page 14: Touch Screen Description
1.5.3 Touch Screen Description The Stat Fax 4700 touch screen responds to touch pressure which causes electrical contact ® between the conductive and resistive layers. The touch screen provides the following advantages: • High touch resolution • Pressure sensitive, works with any stylus •... -
Page 15: Load Paper
1.5.4 Load Paper Locate the roll of thermal printer paper P/N 150006. Lift the printer paper compartment lid at the tab location to open. Caution: Be gentle lifting the latch on the printer. Once it is slightly open, release the latch and lift it from the sides of the lid Figure 1.5.4-1 Paper compartment lid location... -
Page 16: Parts And Controls
1.6 Parts and Controls The following terms are used in this manual to describe parts and controls of the Stat Fax 4700 ® Microstrip Reader. More details on the operation of each feature are provided in Section 2- Operating Procedures. A Carrier Track B Printer and Printer Paper... -
Page 17: Strip Carrier Loading And Positioning
1.6.1 Strip Carrier Loading and Positioning The Strip Format must be selected before programming a new assay. Use the instructions from the table that follows to set the strip format, load, and properly position the strip carrier into the instrument. Place the carrier in the instrument as instructed; for proper alignment utilize the alignment arrow located inside the cover of the instrument (Figure 1.6.1-2). -
Page 18: Auto-Track
Strip Carrier Loading and Positioning (Continued) Select and confirm a stored test, or create a new test. The display will show the strip carrier, indicating where Blanks, Standards and Controls are located. Two carriers are supplied with the instrument. The one without posts is for use with 3 strip, non-break apart wells configuration. - Page 19 Auto Track (continued) The carrier must always be placed in the left-most position, so that A1 is the first well to be read. • The footprint for most 8 and 12 well, single and break apart strips are similar and non-break apart strips will fit the Auto Track carrier.
- Page 20 If more wells/strips are to be read following the first selection, two additional buttons are added to the display - ‘CONTINUE’ and ‘REPEAT’. CONTINUE UNLOAD REPEAT QUIT Figure 1.6.2-3 Options to Continue or to Repeat Choose from the following options when prompted: Option: Function: Continue...
-
Page 21: Checkout Procedure
(Figure 1.7-2). Figure 1.7-1 Power up Screen Display Caution: Run the carrier empty at Stat Fax 4700-1001 least once to verify mechanical parts before reading a real strip. (Refer to Ver: Eng-00.44.00 Section 1.6.1) -
Page 22: Operating Procedures
2. Operating Procedures 2.1 Operating Precautions Avoid lifting, leaning or turning the instrument over when a strip carrier is in place. • • Be sure to run a sufficient number of controls in each assay. If controls are not within their acceptable limits or if incomplete, disregard test results CAUTION! L’ATTENTION! CAUTION! Verify mode selection matches with the test kit package insert... -
Page 23: Main Display Menu Options
2.3 Main Display Menu Options The Main display menu options are: Run Test explained in Section 2.3.1 • • Settings explained in Section 2.3.2 Manage Tests explained in Section 2.3.3 • Utilities explained in Section 2.3.4 • • Load - the reader positions the carrier in the Home position. Unload - the reader positions the carrier for ease of removal. -
Page 24: Run Test
2.3.1 Run Test The Run Test feature allows the operator to recall user tests that have been stored in the instrument’s memory. The instrument stores up to 120 complete test setups in nonvolatile memory, making it easy for the user to recall complete test configurations. Select Run Test from the Main display. -
Page 25: Settings
2.3.2 Settings Select the Settings option on the main display screen and the Unit Settings will display: Printer Setup Arrow Keys: Utilize the arrow keys to scroll up and down Adjust Date and Time the list of options or press the option directly from the list;... -
Page 26: External Output
Type B Figure 2 USB Type B port and connector 2.3.2.2 Mouse Connection To use a USB mouse with the Stat Fax 4700 , be sure that the mouse is connected to the ® USB port A on the instrument before the instrument is powered on. If the mouse is plugged in after the instrument is on, it will not be operational. -
Page 27: Manage Tests
2.3.3 Manage Tests Detailed descriptions of the Modes of Operation may be found in Section 2.5. Select Manage Tests on the Main display screen and the following options will display Create Test Edit Test Clone Test Delete Test Print Test List Exit Figure 2.3.3-1 Manage Tests options Feature... -
Page 28: Utilities
Manage Tests (Continued) Feature Function Restore Tests (OEM User can choose to restore just one of the pre-programmed models only) tests, or to restore all of the pre-programmed tests. Print Test List Prints out the list of stored tests (maximum 120 tests) Exit Returns to the Main display screen 2.3.4 Utilities... -
Page 29: General Operation
2.4 General Operation 2.4.1 Bichromatic Differential Operation The option to operate this instrument using differential absorbance readings is available for every mode. The absorbance readings at the differential wavelength are subtracted from the absorbance readings at the operating (primary) wavelength. Use of the bichromatic differential absorbance values corrects for optical imperfections in the plastic wells and removes the effects of meniscus and turbidity. -
Page 30: Unit Of Measurement Codes (Unit Code)
2.4.2 Unit of Measurement Codes (Unit Code) To access the list of Unit Codes, select Manage Tests, select Create Test select any mode except Absorbance, and advance to the Test Definition Final Page. Check the container for the calibrator(s) to determine the units for results. Select the Units field and the list will display. -
Page 31: Modes Of Operation
2.5 Modes of Operation Mode Function Absorbance Section 2.5.1 - Absorbance mode reads and prints the monochromatic or bichromatic differential absorbance at the user-selected wavelengths. Blanking is optional. Most Assays require a mode other than Absorbance Mode. In this mode, no calculations are made - only absorbance values are reported. - Page 32 Regression Section 2.5.4 Regression mode accepts a number of calibrators and calculates concentration values based on a best-fit curve (linear regression). Cubic Spline Section 2.5.4 – Cubic Spline Mode accepts a minimum of 3 to a maximum of 8 calibrators and calculates concentrations based on the Cubic Spline (constrained) calibration curve.
-
Page 33: Absorbance Mode
2.5.1 Absorbance Mode NOTE: Every user should begin by learning to use the Absorbance Mode. Absorbance mode will read and print sample absorbance values at user selected wavelengths. Press Manage Tests, press Create Test, and the Test Definition window will display. -
Page 34: Offset Absorbance
2.5.1.2 Offset Absorbance If Differential Filter is set to "None", then the Offset Absorbance field is displayed. TEST DEFINITION Name Exit Absorbance Mode Primary Filter Differential Filter None Blank Edit Offset Absorbance 0.000 Print Save Figure 2.5.1.2-1Test Definition – Offset Absorbance field displayed The user should determine the value of the Offset Absorbance. -
Page 35: Lamp Saver
2.5.1.4 Lamp Saver Ten minutes after reading the last sample, the Lamp Idle Timeout feature will automatically turn off the lamp. 600 seconds (ten minutes) is the default setting. The Minimum Lamp Warmup will occur (45 seconds is the default setting), and then operation will resume where it left off. - Page 36 Factor Mode (continued) When Controls are read in duplicate, the mean of the duplicates can be calculated and that one value used, or, each Control can be required to fall within the ranges individually. The instrument will prompt ‘Check Mean?’ once duplicate Controls are selected. TEST DEFINITION Control 1 Enabled # Replicates...
- Page 37 Factor Mode (Continued) Selecting the Interpretation Mode field will open the Test Definition Interpretation screen for editing the Interpretation controls. Use the arrow keys to advance through the options, press the Edit key to change the value of the selection. Editing the Interpretation Pos/Neg field will display the Interpretation Normal option for inputting Normal Range Low, Normal Range High, Valid Range Low, or Valid Range High.
-
Page 38: Single Standard Mode
2.5.3 Single Standard Mode To operate in Single Standard Mode, select Manage Tests and then select Create Test. The Test Definition screen will display. Select the mode field and the Select Mode screen will display the list of modes. Use the arrow keys to scroll through the mode selections to the desired selection and press Select, or use the stylus to highlight Single Standard. - Page 39 Single Standard Mode (Continued) When Controls are read in duplicate, the mean of the duplicates can be calculated and that one value used, or, each Control can be required to fall within the ranges individually. The instrument will prompt ‘Check Mean?’ once duplicate Controls are selected TEST DEFINITION Control 1 Enabled # Replicates...
-
Page 40: Multi-Point Modes (Point-To-Point, Regression And Cubic Spline)
2.5.4 Multi-Point Modes (Point-to-Point, Regression and Cubic Spline) The Stat Fax 4700 offers three varieties of multi-point modes: Point-to-Point, Regression and ® Cubic Spline. In Point-to-Point and Cubic Spline modes, the standard concentrations must be read in either increasing or decreasing order. All of the Test Definition screens, use of Controls, and items related to Interpretations work the same for each type of multi-point. - Page 41 Multi-Point Modes (Continued) The Test Definition second page will display and allow use of % Absorbance, editing of the number of Standards and to enable the use of Controls. Note: The number of Standards must be at least two for Point-to-Point and Regression. Cubic Spline mode requires at least three Standards.
- Page 42 Multi-Point Modes (Continued) When Duplicate Standards are used, the curve may be edited by deleting one of a pair of standards. Once the curve has been read, before the ‘Accept’ or ‘Print’, select ‘Edit’. Using the stylus, select the duplicate standard to be deleted. As shown below, they are labeled as ‘Dupl I’...
- Page 43 Multi-Point Modes (Continued) Calculation Explanation “Y= ABS, X=CONC” Both the absorbance data (y) and the concentration data (x) are linear. “Y=Ln (1000*ABS), X=Conc” The natural log of the absorbance is plotted against the concentration. The absorbance values are multiplied by 1000 before taking the logs. “Y=ABS, X=Ln(Conc)”...
- Page 44 Multi-Point Modes (Continued) Selecting any of the Control fields will open a Test Definition Control screen with options to enable the Control (Yes or No), input the number of Replicates, Name the Control, input a Low and a High Range, set the Action to Take (Warn, Continue or End Test), input a Lot Number, and input an Expiration Date.
- Page 45 Multi-Point Modes (Continued) Selecting the Interpretation Mode field will open the Test Definition Interpretation screen for editing the Interpretation controls. TEST DEFINITION Interpretation Pos/Neg Interpretation Pos >= Neg < NOTE: Double check that the interpretation Reversed Edit information you entered Done is correct.
-
Page 46: Cut Off Mode
2.5.5 Cut Off Mode Many qualitative assays interpret results based on a pre-determined, or cut off, absorbance such that a sample absorbance greater than the cut off absorbance is interpreted as positive (or negative) and samples with absorbance less than the cutoff be interpreted as negative (or positive). - Page 47 Cut Off Mode (Continued) The Cut Off Mode Test Definition first page displays the available options: Name, Mode (Cut Off), Primary Filter, Differential Filter, and Blank. The Test Definition Cut Off second page allows editing of Cut Off Value (COV), values of X, Y, and F;...
- Page 48 Cut Off Mode (Continued) Note: When Cut Off Controls are read in multiples (replicates), the mean of the replicates can be calculated and that value used, or each Control can be required to fall within the ranges set. “Check Mean?” will display if replicate Controls are selected. Selecting the ‘COV =’...
- Page 49 Cut Off Mode (Continued) COV Formula Explanation X*mean(NC) + Y*mean(PC) + F Universal equation, used to calculate the cut off value based upon readings of positive and/or negative controls. In this equation, NC and PC are used to determine the COV (cut off value).
- Page 50 Cut Off Mode (Continued) Selecting the QC Criteria field opens the Test Definition Cutoff Quality screen: TEST DEFINITION Cutoff Quality (mPC / mNC): Enter the lowest acceptable Minimum COV ratio for the mean of the positive controls to the Maximum COV mean of the negative controls (mPC/mNC).= (mPC –...
- Page 51 Cut Off Mode (Continued) By selecting Pos/Neg, Positive and Negative Interpretations can be entered. It is not necessary to enter both Positive and Negative. These can also be set to be evaluated in the reverse, where Positive is LESS than or equal to (<=) the value entered. From the Interpretation screen for Pos/Neg, selecting the Interpretation Pos/Neg field will display the Normal option for inputting Normal Range Low, Normal Range High, Valid Range Low, or Valid Range High.
-
Page 52: Cleaning And Maintenance
3. Cleaning and Maintenance 3.1 Cleaning 3.1.1 Exterior CAUTION: Solvents such as acetone or paint thinner will damage the instrument! Use only water and recommended cleaners! Avoid abrasive cleaners. The display area is liquid-resistant, but is easily scratched. The exterior of the instrument may be cleaned with a soft cloth using plain water. If needed, a mild all-purpose (nonabrasive) cleaner may be used. -
Page 53: Storage
Calibration and Linearity (Continued) For example, if the 1/4 dilution reads .520 A, then you can expect your 1/2 dilution sample to read twice as much or 1.04 A ± [(1% of 1.04) +0.01 A], which is ± .02. A good working instrument would then give a result between 1.02 A and 1.06 A. You will know that your filters are deteriorating when darkly colored solutions consistently read lower than expected. -
Page 54: Troubleshooting
4. Troubleshooting 4.1 Messages and Flags Messages are displayed to alert the operator when certain limits are approached. After displaying the warning the instrument will continue to function normally. Flags are displayed, for example, when an invalid range is entered. They are intended to help the user correct the problem. - Page 55 Messages and Flags (Continued) Message/Flag Explanation “Do not select the same filter Appears on Page 1 of Test Definition when the same for primary and differential” wavelengths are entered for both the Primary and the Differential filters. “EQ” This is reported when a Sample is less than the POS cutoff and greater than the NEG cutoff concentration.
- Page 56 Messages and Flags (Continued Message/Flag Explanation “OUT” Blank is outside min/max range or sample is outside low/high valid range values It also appears in Cubic Spline mode, when the sample is outside the range of valid standards “POS” Sample is >= POS value (or if reversed, sample is <=POS value.
-
Page 57: Error Messages
4.2 Error Messages Error Messages are displayed when the instrument fails to operate. They are intended to help the user locate the problem. Some error messages require action in order to clear them. Most require help from technical support. Error Message Explanation "i2c Bus error, 0xNN. - Page 58 Error Messages (Continued) Error Message Explanation “Mechanism Error” Indicates that the mechanism is not receiving any updated position information from the sensors. “Mechanism Jam” Be sure to use the correct carrier. Check for badly placed carrier and free the jam. 3. Contact Technical Support.
-
Page 59: References
5. References 1. Engineering data supplied by Awareness Technology, Inc. Palm City, Florida (1987 to current date) 2. Data on DRI-DYE Check Strips, provided by Awareness Technology, Inc. Palm City, ® Florida (1989 to current date) 6. Optional Accessories 6.1 Thermal Printer Paper Reorder replacement Thermal Printer Paper Roll P/N 150006. -
Page 60: Information
USA 772-283-6540 Fax: USA 772-283-8020 E-mail: support@awaretech.com Mailing Address: Awareness Technology, Inc. 1935 SW Martin Highway Palm City FL 34990 USA Important: When contacting us, please have the Model and Serial Number of the Stat Fax 4700 in ® question. Have a description of the problem with as much detail as possible. Save any relevant jobs or logs and send or e-mail us the information. -
Page 61: Appendix A - Sf_Capture
8. Appendix A – SF_Capture SF_Capture is a software program for use with this reader. Contact your dealer for a copy of the program. Install the program by double clicking on the setup.exe file found in the SF_Capture folder. The installation process is the same as other software – follow the prompts until it is done. Power on the instrument, connect the serial port to USB cable from the reader to the PC. -
Page 62: Appendix B - Installing New Software
9. Appendix B - Installing new software 1. Erase/delete anything that is on the USB pen drive (or any USB drive). 2. If the software is received in a zip file, double click the zip file to see the romimage.47x folder.
Need help?
Do you have a question about the Stat Fax 4700 and is the answer not in the manual?
Questions and answers