Table of Contents
Advertisement
Quick Links
Advertisement
Table of Contents

Related Manuals for Snap-On VERUS


Summary of Contents for Snap-On VERUS
-
Page 1: User Manual
User Manual EAZ0061B40D Rev. A... -
Page 2: Regulatory Information
Legal Information Trademarks Snap-on, ShopStream Connect, ShopKey, ShopKey Pro and VERUS are trademarks registered in the United States and other countries of Snap-on Incorporated. All other marks are trademarks or registered trademarks of their respective holders. Copyright Information © 2014 Snap-on Incorporated. All rights reserved. -
Page 4: Safety Information
Safety Information For your own safety and the safety of others, and to prevent damage to the equipment and vehicles upon which it is used, it is important that the accompanying Important Safety Instructions be read and understood by all persons operating, or coming into contact with, the equipment. We suggest you store a copy near the unit in sight of the operator. -
Page 5: Important Safety Instructions
Safety Information Safety Signal Words Safety Signal Words Safety messages are provided to help prevent personal injury and equipment damage. All safety messages are introduced by a signal word indicating the hazard level. DANGER Indicates an imminently hazardous situation which, if not avoided, will result in death or serious injury to the operator or to bystanders. -
Page 6: Table Of Contents
Emergency Shutdown ......................18 Chapter 4: Scanner Operations....................19 Getting Started ........................... 19 The Demonstration Program....................20 Disconnecting the VERUS Diagnostic Tool From a Vehicle ..........21 Vehicle Identification........................22 Alternative Vehicle Identification ..................23 Menu Options, Scanner ....................... 24 Connecting to a Vehicle...................... -
Page 7: Contents
Identifying a Test Vehicle ..................... 68 Operations ..........................70 Component Information ....................... 70 Tests ............................ 71 VERUS Toolbar Menu Options .................... 74 Chapter 7: Scope Multimeter....................76 Getting Started ........................... 76 Capabilities .......................... 76 Leads, Probes and Adapters ....................78 Menu Options, Scope Multimeter.................. - Page 8 Battery Pack Safety Guidelines ..................136 Replacing the Battery Pack....................137 Disposing of the Battery Pack .................... 137 Battery Pack Calibration ....................138 VERUS System Restore......................138 Wireless Scan Module......................139 Replacing the Protective Handgrip..................139 Appendix A: Troubleshooting Bluetooth Communication Issues........140 Index ............................
-
Page 9: Chapter 1 Using This Manual
Using This Manual Chapter 1 This manual contains basic operating instructions and is structured in a manner to help you become familiar with your Diagnostic Tool features and perform basic operations. The illustrations in this manual are intended as reference only and may not depict actual screen results, information, functions or standard equipment. -
Page 10: Notes And Important Messages
Using This Manual Conventions 1.1.4 Notes and Important Messages The following messages are used. Note A note provides helpful information such as additional explanations, tips, and comments. Example: NOTE: For additional information refer to... Important Important indicates a situation which, if not avoided, may result in damage to the test equipment or vehicle. -
Page 11: Chapter 2 Introduction
VERUS to run most Windows compatible software programs. The standard Windows toolbar displays at the bottom of the screen. Unique Snap-on software that allows VERUS to function as a scan tool, graphing multimeter, lab scope, and a powerful diagnostic database opens on startup. -
Page 12: Features And Specifications
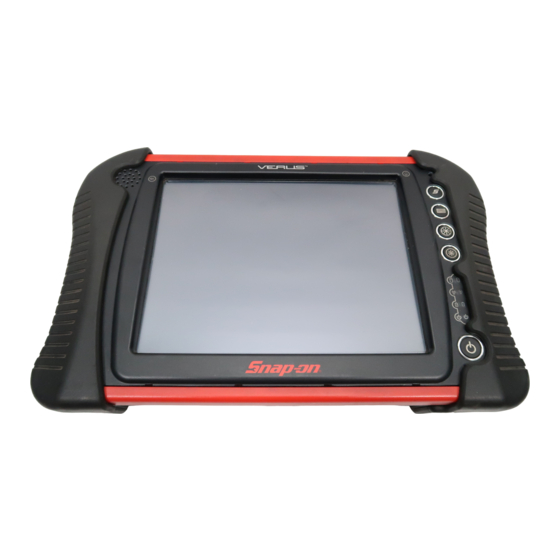
Introduction Features and Specifications 2.1 Features and Specifications 2.1.1 Features 1— Audio Speaker 2— Touch Screen Display 3— Microphone 4— S (Shortcut) Button 5— Virtual Keyboard Button 6— Brightness Up Button 7— Brightness Down Button 8— Hard Drive Activity LED 9—... - Page 13 Features and Specifications IMPORTANT: There are two versions of the VERUS Diagnostic Tool: the standard Diagnostic Tool with integral Scan Module that connects to the vehicle with a data cable, and the wireless unit that uses the stand-alone Scan Module and does require a physical link to the test vehicle. The top view of the two models are distinctly different, as shown in the illustrations below.
- Page 14 Introduction Features and Specifications 1— VGA (video graphics array) Connector 2— LAN (local area network) Jack 3— USB (universal serial bus) Jack 4— Audio (head phone) Jack 5— DC Power Supply Input Jack 6— Fan Filter 7— Data Cable Connector 8—...
-
Page 15: Technical Specifications
1024 x 768 resolution 262,144 Colors Battery: Lithium Ion Smart Battery Pack Approximately 4 hour run time Approximately 4 hour charge time, VERUS not operating Approximately 8 hour charge time, VERUS operating Communications: 10/100 Ethernet Jack 802.11 b/g Wireless LAN Bluetooth 2.0 Class 1... -
Page 16: The Stand
Output; 17VDC 60W, LPS (limited power source) 2.1.3 The Stand The VERUS Diagnostic Tool has a built-in, metal stand attached to the back. When the stand is not in use, it is secured to the back of the Diagnostic Tool by an integrated casing hook. When extended, the stand allows the Diagnostic Tool to rest at a 45°... -
Page 17: Control Buttons
S (Shortcut) Button Use the S Button to quickly capture an image of the current screen with a single button press. This screen capture function is available at all times, even when operating outside of the VERUS Diagnostic Tool software. -
Page 18: Power Sources
Data Link Connector (DLC), Standard Diagnostic Tool Only • Internal Battery Pack The VERUS Diagnostic Tool can be powered from a rechargeable lithium ion battery located on the bottom of the Diagnostic Tool under the right handgrip (Figure 2-5). A fully charged battery provides sufficient power for about four hours of constant operation. -
Page 19: Scan Module (United Kingdom Only)
The wireless Scan Module is provided as standard equipment on all EEMS325 VERUS Diagnostic Tools. Older VERUS Diagnostic Tools in the U.K., which are designed to operate with a hard-wired connection to the test vehicle, can also be converted to operate with the wireless Scan Module. -
Page 20: Technical Specifications
Introduction Scan Module (United Kingdom Only) 2.2.2 Technical Specifications Communications: Bluetooth 2.0 Class 1 Dimensions: Length: 8.04 inches 204.3 mm Height: 3.82 inches 97 mm Depth: 1.66 inches 42.1 mm Weight (including protective hand grip): 0.9 lbs. 0.408 kg USB Power: 5V @ 500mA Data Cable Connector Power: 8V to 32V, Maximum 12 Watts... -
Page 21: Chapter 3 Getting Started
Getting Started Chapter 3 Make sure the VERUS® Diagnostic Tool has a charged battery or is connected to an AC power supply (see “Power Sources” on page 10). It is recommended that you calibrate the touch screen on your VERUS Diagnostic Tool and upon initial startup, and as needed while the Diagnostic Tool is in service (see “Calibrating the Touch Screen”... -
Page 22: Function Icons
Getting Started Turning On 3.1.1 Function Icons The Function icons configure the VERUS Diagnostic Tool for the type of test to be performed. The table below gives brief descriptions of the functions: Table 3-1 Name Icon Description Configures the VERUS Diagnostic Tool Scanner to operate as a scan tool. -
Page 23: Verus Toolbar
Name Icon Description Touching this icon returns you to the Home VERUS Home screen from any test. Touching this icon opens and closes Desktop the standard Windows toolbars at the bottom of the screen. Touching this icon opens a menu of Menu common operations and information. - Page 24 This option opens this document, which provides overall navigation and operation information for the Diagnostic Tool. Version Info This option opens a window showing the version of the VERUS software and the Software License Agreement (Figure 3-2). Select OK to close the window.
- Page 25 Getting Started Turning On View Record The year make and model of vehicle currently identified is shown on the toolbar. Touching the icon opens the worksheet, or service record, of the test vehicle (Figure 3-3). Figure 3-3 Sample vehicle worksheet Use the virtual keyboard to enter data in the worksheet and select Back when finished.
-
Page 26: Windows Toolbar
Delete removes an attached file. 3.1.3 Windows Toolbar This is the standard Windows toolbar. Your VERUS Diagnostic Tool is a fully functional personal computer based on the Windows Embedded Standard operating system. Refer to Microsoft documentation for additional information. 3.2 Turning Off All vehicle communication must be terminated before turning off the VERUS Diagnostic Tool. -
Page 27: Chapter 4 Scanner Operations
The Scan Module communicates wirelessly with the VERUS Diagnostic Tool. Instructions on the VERUS screen tell you how to connect the Scan Module. Additional connection information can be found in the appropriate vehicle communication software manual for the test vehicle, which is available through the Help menu. -
Page 28: The Demonstration Program
5. Follow the on-screen instructions and select as needed until the Systems menu displays. 6. Select from any of the systems listed, then select from the submenus. IMPORTANT: Do not connect a vehicle to the VERUS Diagnostic Tool while in the Demonstration mode. -
Page 29: Disconnecting The Verus Diagnostic Tool From A Vehicle
Getting Started 4.1.2 Disconnecting the VERUS Diagnostic Tool From a Vehicle When disconnecting the VERUS Diagnostic Tool from the vehicle, make sure the Scan Module software is not communicating with the vehicle. To exit Scanner and disconnect the VERUS Diagnostic Tool from a vehicle: 1. -
Page 30: Vehicle Identification
The Scan Module information presented is provided by a direct link to the ECM of the vehicle being tested. Therefore, certain attributes of the test vehicle must be entered into the VERUS Diagnostic Tool so that the data displays correctly. Vehicle identification information is carried over if you enter the Scan Module either from the Guided Component Test module or from one of the records stored in the Vehicle History module. -
Page 31: Alternative Vehicle Identification
Scanner Operations Vehicle Identification A confirmation dialog box displays once all the required data has been entered. 4. From the Confirm vehicle details dialog box, select: a. Ok to continue. b. Cancel to return to the engine list. When Yes is selected list of systems available for testing on the identified vehicle displays. 5. -
Page 32: Menu Options, Scanner
Scanner Operations Vehicle Identification 4.2.2 Menu Options, Scanner The Toolbar Menu at the base of the screen opens a menu near the top of the display. Figure 4-8 Sample Scanner Menu options The following Menu options are available: Safety Information—opens the Important Safety Instructions explained previously. •... - Page 33 Scanner Operations Vehicle Identification Tools This option allows you to adjust tool settings to your personal preferences. Selecting Tools opens a menu with two options: • Units Setup • Display BEN Units Setup The units of measurement can be changed for temperature, vehicle speed, air pressure and other pressure readings.
- Page 34 Scanner Operations Vehicle Identification Help A variety of utilities and additional resources are available through the Help menu: User Manual • Version Info • Activation Status • • User’s Manuals • About Scanner Hardware Version • About Scanner The User Manual, Version Info, and Activation Status options are the same as explained previously, see Menu Options on page 15 for details.
-
Page 35: Connecting To A Vehicle
Scanner Operations Connecting to a Vehicle 4.3 Connecting to a Vehicle Make a selection from the systems available for testing list and instructions for connecting the Scan Module to the vehicle with the data cable display on the screen. If an adapter and key are needed, the instructions tell you which ones to use, and also where to locate the vehicle diagnostic connector to perform the selected tests. -
Page 36: No Communication Message
Scanner Operations Connecting to a Vehicle To connect the data cable to the vehicle: 1. Follow the on-screen instructions for connecting to the vehicle (Figure 4-10). 2. Select Continue once the data cable is connected. The Diagnostic Tool establishes communication then displays a list of available tests. If the Diagnostic Tool is unable to establish a communications link, a “no communications”... -
Page 37: Navigation
Scanner Operations Navigation 4.4 Navigation This sections describes how to navigate the Scan Module interface and select scanner tests. 4.4.1 Scan Module Screen Layout The Scan Module screens typically include three sections (Figure 4-11): 1— Scanner Toolbar 2— Main Body 3—... - Page 38 Scanner Operations Navigation Scanner Toolbar The Scanner toolbar contains a number of icons that allow you to configure certain aspects of the displayed data and to exit. The table below provides a brief explanation of the Scanner toolbar icon operations: Table 4-1 Scanner toolbar icons Name Icon...
- Page 39 Moves to the previous frame in the data buffer Frame Counter Indicates the data buffer frame currently displayed Step Forward Moves to the next frame in the data buffer Arms the VERUS software to take a snapshot of Snapshot vehicle data...
-
Page 40: Screen Messages
Scanner Operations Navigation Table 4-2 Data buffer toolbar icons Name Icon Description Increases the magnification by decreasing the sweep Zoom In of the graph Decreases the magnification by increasing the Zoom Out sweep of the graph 4.4.2 Screen Messages Screen messages appear when additional input is needed before proceeding. There are three types of on-screen messages;... -
Page 41: Operations
Scanner Operations Operations 4.5 Operations The Scan Module allows you to establish a data link to the electronic control systems of the vehicle being serviced in order to view live data parameters and perform tests. You can use selected functional tests, get troubleshooting tips, and get vehicle-specific trouble codes for various vehicle control systems such as engine, transmission, antilock brake system (ABS) and more. -
Page 42: Data Display
Operations To perform a Scan Module test 1. Start the Scanner—Select Scanner on the VERUS Home screen. 2. Identify the vehicle—Identify the test vehicle by entering selecting from the menu options. 3. Select the system—Select the system to be tested (engine, transmission, ABS, Airbag, body) from the systems menu. - Page 43 Scanner Operations Operations Parameters display in the order that they are transmitted by the ECM, so expect variation between vehicles. Figure 4-13shows a typical data screen. 1— Graph icon 2— Parameter name 3— Parameter value Figure 4-13 Sample data screen...
- Page 44 You can view up to six graphs at a time on the standard VERUS screen, and up to sixteen graphs at a time when Graph View is selected from the toolbar. Refer to Graph View on page 50 additional information.
- Page 45 Scanner Operations Operations Triggers Triggers establish threshold values, an upper limit and a lower limit, for recording a data snapshot. A snapshot allows you to closely evaluate conditions that caused the triggering event. When a snapshot is taken, the Scanner captures additional data after the trigger point is detected, data collection pauses, and the buffered information is automatically saved as a movie.
- Page 46 Scanner Operations Operations To set triggers and record a snapshot: 1. Select the Graph Properties icon on the parameter graph you wish to set triggers on to open the dialog box. 2. From the Graph Properties dialog box, Select Triggers On. A check mark appears in the box and the minimum and maximum fields activate (Figure 4-15).
- Page 47 Scanner Operations Operations Once all of the data is compiled, data collection pauses and the information is saved as a movie. A confirmation screen displays to let you know the name automatically assigned to the saved file and where to locate it. Figure 4-17 Sample saved movie confirmation screen 8.
- Page 48 Scanner Operations Operations Scale Scale adjusts the upper and lower values displayed on the vertical axis of a data graph. Two scale modes are available; auto scale and manual scale. Auto scale, which is the default setting, automatically adjusts the graph scale based upon the minimum and maximum values transmitted by the ECM.
-
Page 49: Codes Menu
Scanner Operations Operations Using Zoom The zoom options Data Buffer toolbar allow you to change the level of magnification of the sweep when viewing graph data. Use the Zoom In (+) icon to increase magnification, and the Zoom Out (–) icon to decrease magnification. 4.5.2 Codes Menu This selection may appear as Codes, Codes Menu, Codes Only, codes (No Data), or something similar on the menu. - Page 50 Scanner Operations Operations A code list includes the DTC and a brief description (Figure 4-19). Figure 4-19 Sample code list Clear Codes The Scan Module clears trouble codes from the electronic control module memory on some vehicles. If this function is not available on the test vehicle, Clear Codes does not appear as a menu option.
- Page 51 Scanner Operations Operations DTC Status This selection allows you to view the records of a particular DTC. To check DTC status 1. Select DTC Status from the Codes Menu. The DTC Status entry field displays and the virtual keyboard opens (Figure 4-20).
-
Page 52: Functional Tests
Scanner Operations Operations 4. Select the virtual keyboard Return key once all the code characters are entered. The DTC status report displays (Figure 4-21). Figure 4-21 Sample DTC status report 5. Select Exit to return to the DTC status entry screen. 6. - Page 53 Scanner Operations Operations Selecting Functional Tests opens a menu of test options that varies by make and model. Selecting a menu option either activates the test or opens a submenu of additional choices. Follow all screen instructions while performing tests. How and what information is presented on the screen varies according to the type of test being performed.
-
Page 54: Generic Functions
Scanner Operations Operations Table 4-4 Functional test control icons (sheet 2 of 2) Name Icon Description Minus Incrementally reduces a variable signal. Plus Incrementally increases a variable signal. 4.5.4 Generic Functions The Generic Functions selection opens a menu of available OBD-II/EOBD functions on 1996 and newer vehicles. - Page 55 Scanner Operations Operations To create a custom data list: 1. Select Custom on the Scanner Toolbar. The parameter selection dialog box with all of the parameters selected opens (Figure 4-23). Figure 4-23 Sample custom list configuration screen 2. Select the Deselect All icon to clear the highlights from the screen. 3.
- Page 56 Scanner Operations Operations Alarms Alarms are visual indicators next to a parameter in the data display list that change color to show the status of the signal. A green alarm indicates on, a gray alarm indicates off. Only parameters with a range of two states, can have alarms. Parameters with continuous ranges, such as variable voltage and pressure values, cannot have alarms.
- Page 57 Scanner Operations Operations Properties The Properties icon on the Scanner Toolbar is used to configure certain characteristics of the parameter graph display. Selecting opens a Properties dialog box that allows you to adjust colors, settings, and sweep (Figure 4-25). Selecting either color option, Edit Background Color or Edit Plot Color, opens a standard color picker dialog box.
- Page 58 Scanner Operations Operations Graph View The Graph View icon on the Scanner toolbar allows you to simultaneously view up to sixteen data graphs. Select the Graph View icon and all of the parameters that were being viewed as data graphs in the standard mode now display together on the screen. Only the previously opened graphs display.
- Page 59 Scanner Operations Operations Save The Save icon is used to record movies of vehicle datastream values. Saved files and be helpful when trying to isolate an intermittent problem or to verify a repair during a road test. To save a movie: Select Save.
- Page 60 Scanner Operations Operations Print Selecting Print from the toolbar opens a standard Windows Print dialog box. Select from the options as needed to print the current frame of data. Figure 4-28 Sample print dialog box If the Diagnostic Tool is connected to a printer, the current frame of data is printed. If the Diagnostic Tool is not connected to a printer, the frame of data is saved as an “XPS”...
- Page 61 Scanner Operations Operations More Whenever the More icon appears on the toolbar it indicates that there are additional options available. Selecting the More icon from the Scanner toolbar opens a dropdown menu that offers two choices, Scane and Sweep, that only apply to data graphs: Scale The Scale option switches the scale values, displayed along the left-hand side of the graphs, on and off...
-
Page 62: Exiting The Scanner
The Scan Module remains open as long as there is an active communication link with the vehicle. You must disconnect this communication link in order to exit from Scan Module tests and close the VERUS Diagnostic Tool software. A warning message displays if you attempt to shut down with the Scan Module communicating. -
Page 63: Downloading Firmware
Scan Module remains fully functional but may not benefit from the additional features available in the update. Therefore, you can delay updating the firmware until it is a convenient time to have your VERUS out of service for a few minutes. - Page 64 Scanner Operations Downloading Firmware To update the firmware: 1. Power on the VERUS wireless Scan Module. 2. Connect a wireless Scan Module to the Diagnostic Tool as follows (Figure 4-32): a. From the bottom of the Scan Module, gently lift up and out on the sides of the handgrip to free it from Scan Module housing.
- Page 65 Scanner Operations Downloading Firmware 4. Select OK when the firmware update notification displays (Figure 4-31). The firmware update begins and installation progress is tracked on the screen (Figure 4-33). Figure 4-33 Sample update in progress screen A “successfully updated” message displays once the installation is complete (Figure 4-34).
-
Page 66: Chapter 5: Obd Direct
Options for the Menu on the Toolbar at the base of the screen are the same as those available for the Scanner module. Refer to Menu Options on page 15 for details. Selecting OBD Direct on the VERUS Home screen opens a menu with two options (Figure 5-1): Figure 5-1 Sample OBD Direct main menu... -
Page 67: Obd Health Check
OBD Direct OBD Health Check 5.1 OBD Health Check The OBD Health Check offers a way to quickly check for and clear generic diagnostic trouble codes (DTCs) and to check readiness monitors. Selecting OBD Health Check opens a submenu of options (Figure 5-2). -
Page 68: Global Obd Ii Clear Codes
OBD Direct OBD Health Check Pending Codes The purpose of this service is to enable the scan tool to obtain “pending” or maturing diagnostic trouble codes. These are codes whose setting conditions were met during the last drive cycle, but need to be met on two or more consecutive drive cycles before the DTC actually sets. -
Page 69: Mil Status
OBD Direct OBD Diagnose Scroll to view the entire list of Readiness Monitors to ensure that all tests are complete. It is possible to print the readiness test status or save it as part of a Vehicle history. 5.1.4 MIL Status This item is used to check the current condition of the Malfunction Indicator (MIL). - Page 70 OBD Direct OBD Diagnose A communications message that shows how many ECMs were detected, Which ECM is communicating, and which communication protocol is being used (Figure 5-5). Figure 5-5 Sample communication message 4. Select Continue and a menu of available tests displays(Figure 5-6).
- Page 71 OBD Direct OBD Diagnose Readiness Monitors Use this menu item to check the status of the monitored system. If a monitored system is not supported, it is not displayed. Scroll to view the entire list of Readiness Monitors to ensure that all tests are complete.
-
Page 72: Connector Information
OBD Direct OBD Diagnose Request Control of On-board System ($08) This service enables bidirectional control of the ECM so that the Scanner is able to transmit control commands to operate the vehicle system. This function is useful in determining how well the ECM responds to a command. -
Page 73: Manual Protocol Selection
OBD Direct OBD Diagnose 5.2.3 Manual Protocol Selection A communication protocol is a standardized way of data communication between an ECM and a scan tool. Global OBD may use several different communication protocols. The scan tool automatically connects to an available protocol, which displays on the connection message (Figure 5-5). -
Page 74: Chapter 6 Guided Component Test
The Guided Component Test information presented is specific to the vehicle being tested. Therefore, certain attributes of the test vehicle must be entered into the VERUS Diagnostic Tool so that the correct data can be retrieved. Vehicle identification information is carried over if you enter the Guided Component Test module either from the Scan Module or from one of the records stored in the Vehicle History module. -
Page 75: Menu Options, Guided Component Test
Guided Component Test Vehicle Identification 6.1.1 Menu Options, Guided Component Test Selecting the Toolbar Menu at the base of the screen offers the following options: • Safety Information—opens the Important Safety Instructions document. • File—allows you to print or save the data being viewed. Top Level Menus—allows you to access supplemental information and training programs. -
Page 76: Identifying A Test Vehicle
Guided Component Test Vehicle Identification Features and Benefits Selecting Features and Benefits opens a menu page that includes: • Features and Benefits—provides descriptions and a brief overview of meter functions. Accessories—opens a menu of optional equipment available. • Product Description—provides descriptions and a brief overview of meter operations. •... - Page 77 Guided Component Test Vehicle Identification 7. From the confirmation dialog box, select OK to continue, or Cancel to return to the engine list. A list of tests available for the identified vehicle displays (Figure 6-2). Figure 6-2 Sample available tests list 8.
-
Page 78: Operations
Guided Component Test Operations 6.2 Operations Component Test software provides vehicle specific Guided Component Test Guided procedures and information that aid in setting up scopes and meters. Once a test vehicle is identified, you can select a Guided Component Test from the list of available tests. For most selections two main choices are available on the component menu: 1. -
Page 79: Tests
Guided Component Test Operations The component information screen displays (Figure 6-4). Figure 6-4 Sample Component Information screen 3. Gesture scroll to view any additional information. 4. Select Back at any time to return to the previous screen. 6.2.2 Tests The Tests section guides you through the process of performing tests on a specific component. It also provides specifications, tips on how and where to connect the test meter leads, and also configures the multimeter or lab scope to perform the selected test. - Page 80 Guided Component Test Operations 3. Select a test option and the test screen displays (Figure 6-5). Figure 6-5 Sample Test screen 4. Gesture scroll to view any additional information. 5. Select Back at any time to return to the previous screen. Hyperlinks Guided Component test screens contain hyperlinks that either take you to another page that contains additional information or open an additional window on top of the current screen.
- Page 81 Guided Component Test Operations A Meter icon, which is only available in the Guided Component Test view meter mode, appears on the upper toolbar (Figure 6-6). Figure 6-6 Sample view meter screen Three view meter options are available: 1. With View Meter active (Figure 6-6), select the toolbar Meter icon once and the meter expands to fill the entire screen.
-
Page 82: Verus Toolbar Menu Options
View Meter window. 6.2.3 VERUS Toolbar Menu Options The Menu on the VERUS Toolbar at the base of the display screen opens a list of basic operations and features. This section discusses only those menu options that are unique to the Guided Component Test module. - Page 83 Utilities and additional resources are available to you through the Help menu: VERUS Help—opens a version of this manual designed for on-screen viewing • VERUS User Manual—opens a version of this manual designed printing • Version Info—shows the version of the VERUS software on your Diagnostic Tool. •...
-
Page 84: Chapter 7: Scope Multimeter
Electrical shock can cause personal injury, equipment damage, or circuit damage. IMPORTANT: Maximum rated transient over voltage impulse is 500 volts, do not exceed the rated transient over voltage. 7.1 Getting Started The Scope and Multimeter module enables the following VERUS functions: Lab Scope • • Ignition Scope •... - Page 85 Scope Multimeter Getting Started Table 7-1 Scope Function Range Accuracy/Comments Ch. 1—yellow banana jack Each channel input is referenced to Ch. 2—green banana jack Signal Measurement common ground input (GND—black banana Ch. 3—blue banana jack jack) Ch. 4—red banana jack Single trace mode = 6 MSPS (Ch.
-
Page 86: Leads, Probes And Adapters
(Figure 7-2) is used for Channel 2. The lead color matches the color of socket 2 on the VERUS display and the color of trace 2 on the test screens. This green lead includes a stackable, black, right-angle, ground plug. - Page 87 (Figure 7-4) is used for either Channel 4 or Digital Meter plus (+). The lead color matches the color of socket 4 on the VERUS display, as well as the color of trace 4 on the test screen. Alligator Clips...
- Page 88 7-9) connects to the scope auxiliary jack of the VERUS Diagnostic Tool with a DB9F plug. It can be used to trigger a waveform or display RPM. With the Ignition Scope, the RPM Pickup connects to cylinder number one to establish the...
-
Page 89: Menu Options, Scope Multimeter
Scope Multimeter Getting Started Low Amp Current Probe (optional) The optional Low Amp Current Probe provides accurate and reliable non-intrusive testing of ignition coils, fuel injectors, fuel pumps, relays, electric motors, and parasitic draw. Use to measure current from 10 mA to 60 Amps with a resolution of 1 mA. Figure 7-10 Low Amp Current Probe 7.1.3 Menu Options, Scope Multimeter... -
Page 90: Navigation
Scope Multimeter Navigation Help A variety of utilities and additional resources are available through the Help menu: User Manual • Version Info • Activation Status • • Scope About The User Manual, Version Info, and Activation Status options are the same as explained previously, see “Menu Options”... - Page 91 Scope Multimeter Navigation 1— Scope Multimeter toolbar 2— Main body 3— Trace Details 4— Record/Playback Control toolbar Figure 7-11 Scope Multimeter screen layout...
- Page 92 Scope Multimeter Navigation Scope Multimeter Toolbar The Scope Multimeter toolbar is used to set up the tool for testing and to configure the settings for each trace. The table below gives brief descriptions of the control icons on the toolbar: Table 7-4 Scope Multimeter toolbar icons Name Icon...
- Page 93 Scope Multimeter Navigation Adjustments are made by selecting the item to be changed on the touch screen. A dash (–) indicates a function that is not selected, and an icon displays to indicate an active function (Figure 7-12). 1— Peak Detect on 2—...
- Page 94 Scope Multimeter Navigation Record/Playback Control Toolbar The record/playback control toolbar at the base of the screen is used for recording data and for reviewing paused data files. Use the touch screen select the icons. A position counter in the toolbar displays a numerical value of where the current screen is in relation to the entire recorded file.
-
Page 95: Making Selections
Scope Multimeter Navigation Table 7-5 Data buffer toolbar icons (part 2 of 2) Name Icon Description Expands and collapses the Trace Detail area on the Touch and Grow display screen to allow for easier touch control Zoom Increase or decrease the magnification of the graph 7.2.2 Making Selections Most selections for setting up and operating the scope are made using the stylus and the scope toolbar. -
Page 96: Operations
Use the following procedure to set up the scope multimeter for performing tests. To start the scope multimeter: 1. Select the Scope Multimeter icon on the VERUS Home screen. The Scope Multimeter main menu, a list of setup options, displays;... - Page 97 Scope Multimeter Operations • Injector Pulse Width Duty Cycle • Low Amps (20) • Low Amps (40) • • Low Amps (60) • MC Dwell (60) • MC Dwell (90) • 100 PSI Vacuum 100 PSI Pressure • 500 PSI Pressure •...
-
Page 98: Measurement Out Of Range
Scope Multimeter Operations 7.3.2 Measurement Out of Range A group of arrows display when a measurement is out of range for the scale selected: • Arrows pointing UP—measurement over maximum range • Arrows pointing DOWN—measurement under minimum range Voltage measurements also display arrows in place of live values when the voltage exceeds the input rating of the meter. - Page 99 Scope Multimeter Operations 1— Trace tabs 2— Trace Probe icon 3— Trace Scale icon 4— Trace characteristics check boxes 5— Baseline position 6— Auto Find icon 7— Back icon 8— Exit icon Figure 7-14 Traces dialog box 4. Select the Trace Probe icon to open the menu. 5.
- Page 100 Scope Multimeter Operations Sweep Controls Sweep is the amount of time represented by the screen, or the horizontal scale of the display. To adjust Sweep controls: 1. Select Setup from the Scope Multimeter toolbar. The Scope Multimeter Preferences dialog box opens. 2.
- Page 101 Scope Multimeter Operations 1— Source—selects the triggering event: - Trace 1—sets the trigger to channel 1. - Trace 2—sets the trigger to channel 2. - Trace 3—sets the trigger to channel 3. - Trace 4—sets the trigger to channel 4. - Cylinder—sets triggering to the firing of a cylinder detected by the optional RPM Pickup or Secondary Ignition Adapter.
- Page 102 Scope Multimeter Operations View Controls Use the view controls to set display attributes. To adjust view controls: 1. Select Setup from the Scope Multimeter toolbar. The Scope Multimeter Preferences dialog box opens. 2. Select View to open a submenu. 3. Select an option from the submenu dialog box. Option details are explained below. Four options are available on the submenu: Display—use to adjust what information displays and how it appears –...
- Page 103 Scope Multimeter Operations • Show Digital KV—available only in ignition scope, adds a kilovolt reading to the screen. Show Grid—switches grid lines on the screen off and on (Figure 7-19). • Figure 7-19 Sample grid selected • Invert Colors—switches the screen background to white, this saves ink when printing. Layout Settings The selected radio knob on the Layout dialog box shows which setting is active.
- Page 104 Scope Multimeter Operations Figure 7-21 Sample 2 Windows vertical display • 3 windows—shows three traces, one below another, on the same screen (Figure 7-22). Figure 7-22 Sample 3 Windows display • 4 windows—shows four traces, one below another, on the same screen.
- Page 105 Scope Multimeter Operations Units Settings The Units dialog box allows you to switch between Full Scale or Per Division settings for the trace setup and the display settings. Selecting Full Scale configures the units to the full viewing area of the screen, while Per Division adjusts the units to a single division (one tenth) of the screen.
- Page 106 Scope Multimeter Operations Unit Setup The units of measurement can be changed between US standard or metric units of measure for pressure and vacuum readings. The table below shows available unit values. Abbreviation Description inHg inches of mercury kg/cm2 kilograms per centimeter squared kilopascal mmHg millimeters of mercury...
- Page 107 Scope Multimeter Operations Snapshot The Snapshot tab of the Setup dialog box opens a window that allows you to select how much data is captured after a triggering event (Figure 7-25). Available selections, which range from ten to ninety percent in ten-percent increments, are shown as icons with the current setting highlighted.
- Page 108 Scope Multimeter Operations To setup Ignition tests 1. Select the Setup icon to open the Setup dialog box. 2. Select the Ignition tab of the dialog box. 3. Highlight the ignition system for the test vehicle in the “Type” field: –...
- Page 109 Scope Multimeter Operations Cursor Controls The cursor controls include a Show Cursors check box plus a slide control and arrows for moving the cursor position left or right. Select Cursors from the toolbar to open the Cursors dialog box (Figure 7-27).
- Page 110 Selecting Print from the toolbar opens a standard Windows Print dialog box set up to print the current screen. A printer must be connected and setup on the VERUS Diagnostic Tool. If not, the “Add Printer Wizard” opens and guides you through the procedure. Select from the menus as...
-
Page 111: Chapter 8: Information
Although these dialog boxes are typically of little concern, a response is required to continue. In the above example, the choices presented offer the following results: Retry—advances to the selected page. If the VERUS is actively connected to the internet the •... -
Page 112: Vehicle Identification
Information Vehicle Identification 8.1 Vehicle Identification What happens when the Information icon is selected from the VERUS Home screen depends upon whether or not a test vehicle has been identified: • With no active vehicle, the first in a series of vehicle identification screens that allow you to select the year, make, model, and other pertinent information for the test vehicle opens. -
Page 113: Diagnostic Trouble Codes
Information Diagnostic Trouble Codes Table 8-1 Information icon descriptions Name Icon Description Provides graphics and text for locating various Component vehicle components. See “Component Locations” on Locations page 111. Provides instant access to a wiring diagram for the Wiring Diagrams test vehicle. -
Page 114: Diagnostic Trouble Codes Screen
Information Diagnostic Trouble Codes 8.2.1 Diagnostic Trouble Codes Screen The DTC screen is divided into two main fields; the selection field on the left hand side and the information field on the right hand side. The selection field, which determines what information is shown in the information field, typically offers the following choices: Data Link Connector—this is the default screen when diagnostic trouble codes is selected. -
Page 115: Engine Management Component Testing
Information Engine Management Component Testing 8.3 Engine Management Component Testing Procedures for diagnosing, evaluating, and testing engine management system components are found in this section. Information is specific to the identified vehicle. To access engine management component testing: 1. Double click the Engine Management Component Testing icon. A category list displays (Figure 8-4). -
Page 116: Engine Management Component Testing Screen
Information Engine Management Component Testing 8.3.1 Engine Management Component Testing Screen There are three main screen fields for engine management component testing (Figure 8-7): 1— Toolbar—located at the top of the screen, the toolbar allows you to quickly navigate between different functions and operations. See “Toolbar”... - Page 117 Information Engine Management Component Testing indicated by an “X” in the upper-left corner of the icon. Icon operation is described in the table below. Table 8-2 Information icon descriptions Name Icon Description Help Opens a help file that details tool operations. Opens a print dialog box that allows you to add Print customer information to the displayed article and...
-
Page 118: Engine Management Pin Data
Information Engine Management Pin Data Component Test Information Articles that display on the right side of the component test screen contain detailed test procedures, specifications, and other resource information used to make repairs. Illustrations related to the article are shown in the lower portion of the menu field. A scroll bar appears along the right margin of the field for lengthily article that do not fit on a single screen. -
Page 119: View Tabs
Information Component Locations 8.4.1 View Tabs The View Tabs determine which perspective of the ECM connector diagram displays. Two choices are available: • Terminal Side—shows the connector as if it were disconnected from the ECM and you are looking into the face (open terminal side) of the connector. Wire Side—shows the connector as if were connected to the ECM and you are looking at the •... - Page 120 Information Component Locations Figure 8-9 Sample Component Locations category menu The categories vary, but typically include: • Engine Management—provides engine control system component location information. Antilock Brake Systems—provides ABS component location information. • Fuse Boxes/Relay Plates—provides power distribution component location information. •...
-
Page 121: Wiring Diagrams
Information Wiring Diagrams A toolbar, located above the diagram, offers shortcuts to certain operations. Toolbar icon operations are the same as for Engine management Component Testing, see “Toolbar” on page 108 for descriptions. which toolbar icons display varies by category. A component selection menu appears between the toolbar and the main screen on some diagrams. -
Page 122: Toolbar
Information Wiring Diagrams 8.6.1 Toolbar Most of the toolbar icon are the same as for Engine management Component Testing, see “Toolbar” on page 108 for descriptions. However, there are some icons that only appear on wiring diagrams. These are explained in the table below. Table 8-3 Information icon descriptions Name Icon... -
Page 123: Chapter 9 Vehicle History Operations
Vehicle History refers to any work in progress, such as a repair order, estimate or invoice, that has customer, vehicle, and repair information for a vehicle in your shop. The Vehicle History is the starting point for using the VERUS system. The Scan Module and Guided Component Test software gets vehicle information from the Vehicle History, and can only start after a Vehicle History is opened. -
Page 124: Vehicle History Main Body
Vehicle History Operations Screen Layout 9.1.1 Vehicle History Main Body The main body of the screen lists all of the available Vehicle History items. By default, items are shown in the order in which they are entered. However, you can resort them by any of the categories shown as column headings. - Page 125 Use this icon to load an existing vehicle history when servicing a vehicle that you have previously worked on. VERUS uses the identification characteristics stored in the vehicle history to load the correct database, so you do not need to identify the vehicle to begin testing.
- Page 126 Vehicle History Operations Screen Layout NOTE: The virtual keyboard automatically opens the first time you touch within one of the data fields. 3. Use the virtual keyboard to enter information in the data fields. 4. Select Save & Close on the toolbar to save the changes you made and return to the Vehicle History screen.
- Page 127 Vehicle History Operations Screen Layout 3. Enter the search criteria using the keyboard. There is no need to identify the category, just enter the search item. 4. Select Search twice. The first tap closes the keyboard, the second tap starts the search. The display returns to the Vehicle History screen with only the records fitting the search criteria showing.
-
Page 128: Chapter 10: Data Manager
Data Manager Chapter 10 The Data Manager module is used to store, sort, and review saved files. Most operations are controlled through the toolbar. 10.1 Screen Layout Select Data Manager on the Module toolbar to open the file system. Use the toolbar at the top of the screen to navigate through the data. -
Page 129: My Data
Data Manager Screen Layout The Data Manager module is used to store, sort, and review saved files. Most operations are controlled through the toolbar. Toolbar functions in the table below and explained in the following sections: Table 10-1 Data Manager toolbar icons Name Icon Description... -
Page 130: Open
Data Manager Screen Layout 10.1.2 Open The Open icon is only active (displays in color) when an item in the folders panel is highlighted. To open a folder: 1. Highlight the file to open in the folders panel. 2. Select the Open icon to load the highlighted file. Figure 10-2 Sample open folder showing information The screen advances and the contents of the open folder are shown in folders panel. -
Page 131: New
Data Manager Screen Layout 10.1.3 New The New icon allows you to create a new folder. This option is only available when the icon displays in color. To create a new folder: 1. Select the New icon on the toolbar. The New Folder Name dialog box opens (Figure 10-3). -
Page 132: Delete
Data Manager Screen Layout 10.1.4 Delete The Delete icon moves folders or items within folders to the Recycle Bin. To delete an item: 1. Touch to highlight the item or folder to be deleted. 2. Select the Delete icon on the toolbar. A confirmation message displays (Figure 10-4). -
Page 133: Rename
Data Manager Screen Layout 10.1.5 Rename The Rename icon allows you to change the name of a folder or items within a folder. To rename an item: 1. Touch to highlight the item or folder to be renamed. 2. Select the Rename icon on the toolbar. The New Name dialog box opens (Figure 10-3). -
Page 134: Properties
Data Manager Screen Layout 10.1.6 Properties The Properties icon function allows you to change the name and assign identifying attributes to saved Scope Multimeter files. Operation is similar to renaming a file as discussed above, except there are additional fields for entering descriptive information. To assign properties to an item: 1. -
Page 135: Saved File Structure
Data Manager Saved File Structure 10.2 Saved File Structure The Diagnostic Suite automatically creates folders to manage saved files. Whenever 60 files are saved into any of the Data Manager menu option folders, a new folder is created. Folders may contain files for a day, week, month, or a year. -
Page 136: Chapter 11 Help Operations
Help Operations Chapter 11 Selecting Help from the Home screen opens this manual in a dedicated screen viewer. Navigate through the file either by gesture scrolling on the touch screen, or with the scroll bar along the right edge of the viewing screen. A left-to-right scroll bar appears at the bottom of the screen when magnification is increased. - Page 137 Help Operations Using the Help Toolbar Table 11-1 Help toolbar icons (sheet 2 of 2) Name Icon Description Hide TOC Closes the contents and search column so the document fills the screen. Show TOC Opens the contents and search column if they have been hidden.
-
Page 138: Chapter 12 System Settings Operations
System Settings Operations Chapter 12 Selecting System Settings from the Home screen opens a menu with two options: "Paired Devices" • "Shop Information" • Paired Devices allows you to check the status of and to pair wireless devices, such as the Scan Module, to the Diagnostic Tool. -
Page 139: Pairing The Wireless Scan Module
6. From the Paired Devices screen select Add from the toolbar. 7. When prompted select OK from the toolbar. The Diagnostic Tool searches for compatible wireless devices, then displays the results. The Scan Module is listed as “VERUS” plus a partial serial number (Figure 12-2). - Page 140 12-1) displays once the procedure completes. Figure 12-3 Sample pairing in progress message 9. Select the Home icon on the VERUS toolbar to return to the Home screen. 10. Disconnect the data cable from the vehicle. The Scan Module and Diagnostic Tools are now synchronized for wireless communication and...
-
Page 141: Shop Information
System Settings Operations Paired Devices 12.1.2 Shop Information This option allows you to add personalized shop information that can be included on printed data files. Selecting opens a form that can be filled in using the virtual keyboard. Select OK when the form iscomplete and the information is saved. -
Page 142: Chapter 13 Maintenance
The sensitivity and accuracy of the touch screen should be calibrated before you begin using you VERUS Diagnostic Tool. Adjustments can be made to the touch screen calibration to maintain your personal settings. The touch screen can also be set to recognize the stylus being held in place for five seconds as a right-click of a mouse. -
Page 143: Cleaning And Inspecting The Diagnostic Tool
Check the housing, wiring, and connectors for dirt and damage before and after each use. • Inspect the fan filter. Replace the filter if it is torn, severely dirty, or otherwise damaged. • At the end of each working day, clean the VERUS housing, wiring, and connectors with a • clean damp cloth. IMPORTANT: Do not use any abrasive cleansers or automotive chemicals on the VERUS Diagnostic Tool. -
Page 144: Battery Pack Service
• Do not short circuit battery pack terminals. • Do not immerse the VERUS Diagnostic Tool or battery pack in water, or allow water to enter the Diagnostic Tool or battery pack. • Do not crush, disassemble, or tamper with the battery pack. -
Page 145: Replacing The Battery Pack
To prolong the life of your battery, power off the Diagnostic Tool or place it into hibernation mode when not in use. The VERUS Diagnostic Tool has a built in charger that recharges the battery on demand whenever it is connected to a power source. A Smart Battery Charger, which prolongs battery life and improves performance, is available as an option. -
Page 146: Battery Pack Calibration
IMPORTANT: All data on the VERUS hard disk drive is erased during a system restore. If at all possible, make a back up copy of any personal or saved data before proceeding. -
Page 147: Wireless Scan Module
Once the reseal completes, the dialog box closes, Windows starts, and the VERUS Diagnostic Tool is ready for use. If you receive an error message while starting the VERUS software, the license key may need to be updated or replaced. Contact your sales representative or Customer Care. -
Page 148: Appendix A Troubleshooting Bluetooth Communication Issues
Troubleshooting Bluetooth Appendix A Communication Issues The Scan Module is a wireless communications device that uses Bluetooth technology to transmit vehicle data to the Diagnostic Tool without a physical connection. The working range of the transmitter is about 30 feet (9.14 m). Scan Module operations can be impacted when signal interference, or some other condition, disrupts or impairs the wireless communication network. - Page 149 Troubleshooting Bluetooth Communication Issues Recovery Procedure 1— Vehicle Power—green LED, flashes during wireless communications 2— Communication—red LED, illuminates if there is a communications failure 3— Bluetooth—green LED, flashes during wireless communications Figure A-1 Scan Module LEDs Recovery Procedure This is a quick and easy method that reestablishes connectivity between the Diagnostic Tool and the Scan Module.
- Page 150 Troubleshooting Bluetooth Communication Issues Alternate Procedures Alternate Procedures Use these methods as an option to the Recovery Procedure, or when recovery fails to restore the wireless connection. USB Procedure This method establishes a “hard-wired” USB cable connection between the modules. To create a USB connection: 1.
- Page 151 Troubleshooting Bluetooth Communication Issues Alternate Procedures Windows Reboot Procedure This method, which completely shuts down the Diagnostic Tool, takes several minutes to complete. To reboot the Diagnostic Tool: 1. Disconnect the Scan Module from the vehicle. 2. Navigate to the Home Screen on the Diagnostic Tool. 3.
-
Page 152: Index
Index Numerics 10-Minute Electronic Class 67 Data Display 34 – 15-Minute Ignition Class 67 Data Graph 36 20-Minute current ramp classes 67 Data Manager 120 properties 126 data parameters displaying 33 AC/DC power supply 10 delete 118 actuator tests 33 demonstration programs 20 alarms 48 diagnostic connector... - Page 153 Index maintenance battery pack 136 Safety iv maintenance tips 134 Scale 53 Making Selections 87 Scan Module Scanner 32 disconnecting 21 manual conventions 1 – handgrip replacement 139 Measurement Out of Range 90 introduction 11 menu button 15 operations 19 Messages scale 53 confirmation 32...
- Page 154 117 screen layout 115 search 118 settings 119 toolbar 116 view 117 vehicle identification 115 – VERUS toolbar 15 – View 117 Viewing component information 70 weight, display device 7 weight, Scan Module 12 wireless pairing devices 130 –...
Need help?
Do you have a question about the VERUS and is the answer not in the manual?
Questions and answers