Table of Contents
Advertisement
Advertisement
Table of Contents

Related Manuals for Snap-On Verus


Summary of Contents for Snap-On Verus
- Page 1 User Manual EAZ0061B58A Rev. E...
- Page 2 Agreement is provided with the diagnostic tool and the device should not be initially operated until the End User License Agreement is read. Use of the device acknowledges your acceptance of the End User License Agreement. Patent Information For a listing of Snap-on products that are protected by patents in the United States and elsewhere, visit: https://patents.snapon.com...
- Page 3 Contact Information (United Kingdom) Visit our websites at: https://www1.snapon.com/diagnostics/UK/Diagnostics.htm ShopStream Connect https://www1.snapon.com/ukssc For Technical Assistance Phone / E-mail: +44 (0) 845 601 4736 / diagnosticsUKproductsupport@snapon.com For technical assistance in all other markets, contact your selling agent. Regulatory Information This product has been tested to the requirements of CAN/CSA-C22-2 No. 61010-1, second edition, including Amendment 1, or a later version of the same standard incorporating the same level of testing requirements.
-
Page 5: Safety Information
Safety Information READ ALL INSTRUCTIONS For your own safety, the safety of others, and to prevent damage to the product and vehicles upon which it is used, it is important that all instructions and safety messages in this manual and the accompanying Important Safety Instructions manual be read and understood by all persons operating, or coming into contact with the product, before operating. - Page 6 Safety Information Safety Signal Words Safety Signal Words All safety messages contain a safety signal word that indicates the level of the hazard. An icon, when present, gives a graphical description of the hazard. Safety Signal words are: Indicates an imminently hazardous situation which, if not avoided, will result in death or serious injury to the operator or to bystanders.
-
Page 7: Table Of Contents
Contents Safety Information ........................v Contents ............................ vii Chapter 1: Using This Manual ....................1 Conventions..........................1 Bold Text ..........................1 Symbols ..........................1 Terminology ........................... 1 Notes and Important Messages ..................... 2 Procedures..........................2 Hyperlinks ..........................2 Tool Help..........................2 Chapter 2: Introduction...................... - Page 8 Contents Basic Operation and Navigation ....................21 Screen Messages ........................ 21 Making Selections ........................ 22 Scanner Screen Layout ....................... 22 Menu Options........................32 Scanner Operation ........................34 Vehicle Identification ......................35 Connecting to a Vehicle ....................... 36 Vehicle System Selection ....................38 Vehicle Test Selection ......................
- Page 9 Contents Operations ..........................97 Starting the Scope and Multimeter..................97 Measurement Out of Range....................99 Scope and Multimeter Setup....................99 Chapter 9: Information ......................111 Vehicle Identification......................... 111 Diagnostic Trouble Codes ......................113 Diagnostic Trouble Codes Screen ..................113 Printing Diagnostic Trouble Code Information ..............114 Engine Management Component Testing ................
- Page 10 Contents Image Viewer ........................... 153 Chapter 12: Help Operations ....................154 Using the Help Toolbar......................154 Chapter 13: System Settings Operations................155 Paired Devices ......................... 155 Pairing the Wireless Scan Module ..................156 Shop Information ........................157 Data Backup ..........................158 Backup ..........................
-
Page 11: Chapter 1 Using This Manual
Using This Manual Chapter 1 This manual contains basic operating instructions and is structured in a manner to help you become familiar with your diagnostic tool features and perform basic operations. The illustrations in this manual are intended as reference only and may not depict actual screen results, information, functions or standard equipment. -
Page 12: Notes And Important Messages
Using This Manual Conventions 1.1.4 Notes and Important Messages The following messages are used. Note A note provides helpful information such as additional explanations, tips, and comments. Example: NOTE: For additional information refer to... Important Important indicates a situation which, if not avoided, may result in damage to the test equipment or vehicle. -
Page 13: Chapter 2: Introduction
This manual describes the operation of these devices and how they work together to deliver diagnostic solutions. There are two versions of the VERUS Diagnostic Tool: (operation and function are similar for both) Standard Version On early-model VERUS Diagnostic Tools the Scanner is built (integrated) into the Diagnostic Tool. -
Page 14: Features And Specifications
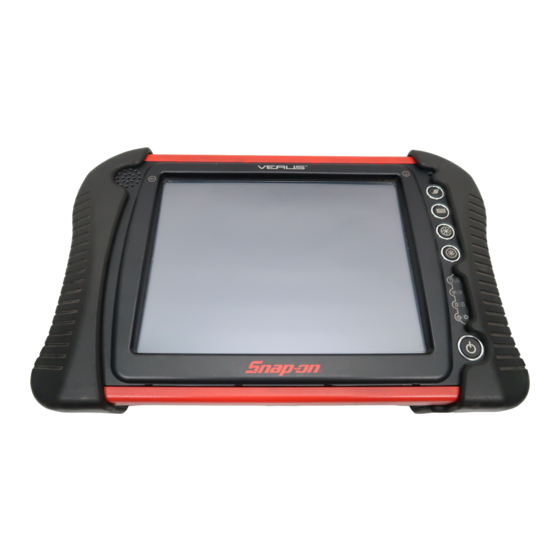
Introduction Features and Specifications 2.1 Features and Specifications 2.1.1 Diagnostic Tool 1— Audio Speaker 2— Touch Screen Display 3— Microphone 4— S (Shortcut) Button 5— Virtual Keyboard Button 6— Brightness Up Button 7— Brightness Down Button 8— Hard Drive Activity LED 9—... - Page 15 Introduction Features and Specifications Standard Version (Early-Models) 1— VGA (video graphics array) Connector 2— LAN (local area network) Jack 3— USB (universal serial bus) Jack 4— Audio (head phone) Jack 5— DC Power Supply Input Jack 6— Fan Filter 7— Data Cable Connector 8—...
- Page 16 Introduction Features and Specifications Wireless Version (Later-Models) 1— VGA (video graphics array) Connector 2— LAN (local area network) Jack 3— USB (universal serial bus) Jacks (2) 4— Audio (head phone) Jack 5— DC Power Supply Input Jack 6— Fan Filter 7—...
-
Page 17: Technical Specifications
Introduction Features and Specifications 2.1.2 Technical Specifications Item Description / Specification Touch Screen 5-Wire Resistive Touch Panel 10.4 inch, outdoor enhanced, TFT LCD Display 1024 x 768 resolution, 262,144 Colors Standard: 600MHz Intel Celeron M Processor WIreless: Intel Atom 1.6GHz Operating System Microsoft Windows Embedded Standard XPe SP3 802.11 b/g/n Wireless... -
Page 18: Power Conservation
Introduction Features and Specifications Tool falling off a vehicle due to vibrations or other movement, and also prevents you from accidentally dropping the Diagnostic Tool. 2.1.5 Power Conservation To conserve power, the Diagnostic Tool uses a power saving strategy when left idle. Standby mode engages following a period of inactivity. - Page 19 Introduction Features and Specifications Docking Station (Optional) The Diagnostic Tool can be powered and operated when installed on the optional docking station. The docking station also powers the internal battery pack charging process and allows USB connectivity for attaching peripherals. Contact your sale representative for additional details. AC/DC Power Supply The Diagnostic Tool can be powered from a wall socket using the AC/DC power supply and power cord.
-
Page 20: Scan Module (Wireless)
The wireless Scan Module is provided as standard equipment on all late-model VERUS Diagnostic Tools. Early VERUS Diagnostic Tools, which are designed to operate with a cable connection to the test vehicle, can also be converted to operate with the wireless Scan Module. -
Page 21: Technical Specifications
Introduction Scan Module (Wireless) 2.2.2 Technical Specifications Item Description / Specification ® Communications Wireless Bluetooth 2.0 Technology USB Power 5V @ 500mA Data Cable Connector 8V to 32V, Maximum 12 Watts Power Width 8.04 in. (204.3 mm) Height 3.82 in. (97 mm) Depth 1.66 in. -
Page 22: Chapter 3 Basic Operation And Navigation
Basic Operation and Chapter 3 Navigation This chapter describes the basic operation, controls and navigation of the diagnostic tool. 3.1 Turning On/Off and Emergency Shutdown The following sections describe how to turn the diagnostic tool on and off and how to perform an emergency shutdown. -
Page 23: Controls And Indicators
S (Shortcut) Button Use the S Button to quickly capture an image of the current screen with a single button press. This screen capture function is available at all times, even when operating outside of the VERUS diagnostic tool software. -
Page 24: Basic Navigation
Basic Operation and Navigation Basic Navigation 3.3 Basic Navigation 3.3.1 Starting the ShopStream Diagnostic Suite Program The ShopStream Diagnostic Suite program is automatically started when the diagnostic tool is turned on through the Windows “start up” folder function. After the program has started, the ShopStream Diagnostic Suite Home Screen displays, see “Home Screen Layout”... -
Page 25: Function Icons
Basic Operation and Navigation Basic Navigation 3.3.3 Function Icons The Function Icons configure the diagnostic tool for the type of test to be performed. Table 3-1 gives brief descriptions of the available icons, which operations are available depends upon the individual configuration of your system. -
Page 26: Toolbar
Basic Operation and Navigation Basic Navigation 3.3.4 Toolbar Operation of the icons located on the toolbar are described in the table below: Table 3-2 Name Icon Description Selecting this icon returns you to the Home Home screen from any test. Selecting this icon opens and closes the standard Windows toolbars at the top and Desktop... -
Page 27: Windows Toolbar
Basic Operation and Navigation Basic Navigation User Manual This option opens this document, which provides overall navigation and operation information for the diagnostic tool. Version Info This option opens a window showing the version of the software and a copy of the Software License Agreement. -
Page 28: Virtual Keyboard
Basic Operation and Navigation Virtual Keyboard 3.4 Virtual Keyboard The Virtual Keyboard allows you to type characters and key in information to complete form and data entry fields, similar to a physical keyboard. The Virtual Keyboard is normally running in the Windows background and can be opened by pressing the Virtual Keyboard button on the diagnostic tool. -
Page 29: Wi-Fi Setup
Basic Operation and Navigation Wi-Fi Setup 1— Settings icon - opens the Virtual Keyboard settings window (Figure 3-5) 2. Expand icon - expands the Virtual Keyboard to full display (press again to return to standard display) 3. Top - moves the keyboard to top of screen 4—... -
Page 30: Chapter 4 Scanner Operations
Scanner Operations Chapter 4 There are two versions of the VERUS Diagnostic Tool; operation and function are similar for both. The information in this chapter applies to both, unless otherwise specified. Standard Version On early-model VERUS Diagnostic Tools the Scanner is built (integrated) into the Diagnostic Tool. -
Page 31: Basic Operation And Navigation
Scanner Operations Basic Operation and Navigation Figure 4-1 Sample demonstration selection 2. Select the Demonstration icon. A menu of demonstration choices may display one of the following: 2009 Peugeot 407—contains simulated data for a 407 Diesel – OBD Training Mode—provides simulated data for an OBD-II/EOBD vehicle that allows –... -
Page 32: Making Selections
Scanner Operations Basic Operation and Navigation 4.2.2 Making Selections The Scanner software is a menu driven program that presents a series of choices one at a time. As you select from a menu, the next menu in the series displays. Each selection narrows the focus and leads to the desired test. - Page 33 Scanner Operations Basic Operation and Navigation Scanner Toolbar The Scanner toolbar contains a number of icons that allow you to configure the displayed data and to exit. The table below provides a brief explanation of the Scanner toolbar icon operations: Table 4-1 Scanner toolbar icons Name Icon...
- Page 34 Scanner Operations Basic Operation and Navigation Custom The Custom icon on the Scanner Toolbar is used to determine which specific parameters display. Minimizing the number of parameters on the data list allows you to focus on any suspicious or symptom-specific data parameters. You can add or remove most parameters from the list. Any parameter that has a lock icon next to it cannot be removed from the list.
- Page 35 Scanner Operations Basic Operation and Navigation NOTE: Graph View is only available when 16 or fewer parameters (the number that can display on a single screen) were selected for the custom list. Make sure that no more than 16 parameters are highlighted if the screen displays a single graph when the Graph View icon is selected.
- Page 36 Scanner Operations Basic Operation and Navigation Properties The Properties icon on the Scanner Toolbar is used to configure certain characteristics of the parameter graph display. Selecting opens a Properties dialog box that allows you to adjust colors, settings, and sweep (Figure 4-5).
- Page 37 Scanner Operations Basic Operation and Navigation Graph View Graph View allows you to simultaneously display up to 16 parameter graphs (Figure 4-6). The graphs must first be opened in the data list in order to be included when Graph View is selected from the toolbar.
- Page 38 Scanner Operations Basic Operation and Navigation Save The Save icon is used to record movies of vehicle datastream values. Saved files and be helpful when trying to isolate an intermittent problem or to verify a repair during a road test. To save a movie: Select Save.
- Page 39 Scanner Operations Basic Operation and Navigation If the Diagnostic Tool is connected to a printer, the current frame of data is printed. If the Diagnostic Tool is not connected to a printer, the frame of data is saved as an “XPS” file. A dialog box opens so that you can name the print file and specify the location that it is saved to, follow the on-screen instructions.
- Page 40 Scanner Operations Basic Operation and Navigation Sweep The Sweep option switches the sweep values, displayed below the data graphs, on and off (Figure 4-10). The dropdown menu closes once a selection is made. Figure 4-10 Sample data graph sweep Main Body The main body of the screen varies depending on the stage of operation.
- Page 41 Scanner Operations Basic Operation and Navigation Table 4-2 Data buffer toolbar icons (sheet 2 of 2) Name Icon Description Go To End Moves to the last frame in the data buffer Clear Erases data in the data buffer Step Back Moves to the previous frame in the data buffer Frame Counter Indicates the data buffer frame currently displayed...
-
Page 42: Menu Options
Scanner Operations Basic Operation and Navigation 4.2.4 Menu Options The Toolbar Menu icon at the base of the screen opens a menu near the top of the display. Figure 4-12 Sample Scanner Menu icon options The following Menu options are available: Safety Information—opens the Important Safety Instructions explained previously. - Page 43 Scanner Operations Basic Operation and Navigation Units Setup The units of measurement can be changed for temperature, vehicle speed, air pressure and other pressure readings. Choose between US customary or metric units of measure. NOTE: All measurement units return to their default values when different software is selected. To change the units setup: 1.
-
Page 44: Scanner Operation
Scanner Operations Scanner Operation User’s Manuals This option opens a menu of additional support documentation, such as vehicle communication software manuals, available to assist in your diagnosis. These manuals provide connection information, detailed test procedures, and other resource material for specific vehicles. Figure 4-14 Sample User’s Manuals menu Select Exit to close the Help module and return to the Scanner. -
Page 45: Vehicle Identification
Scanner Operations Scanner Operation 4.3.1 Vehicle Identification The Scanner information presented is provided by a direct link to the ECM of the test vehicle. Therefore, certain attributes of the test vehicle must be entered into the Diagnostic Tool so that the data displays correctly. -
Page 46: Connecting To A Vehicle
Scanner Operations Scanner Operation 4. Select OK and a list of systems available for testing on the vehicle displays (Figure 4-16). Figure 4-16 Sample available tests list 5. Select a test to continue. The identification sequence is now complete. Alternative Vehicle Identification Occasionally, you may identify a test vehicle that the Scanner does not recognize, the database does not support, or has some unique characteristics that prevent it from communicating with the Scanner through the normal channels. - Page 47 Scanner Operations Scanner Operation connects to the DA-5 adapter, the DA-5 adapter connects to the manufacturer specific adapter and then connects to the vehicle DLC. The cable connectors are secured with captive screws. On-screen cable and adapter connection instructions are provided while using the Scanner and OBD-II/EOBD functions.
-
Page 48: Vehicle System Selection
Scanner Operations Scanner Operation Scan Module Connection (wireless version) The Scan Module is a wireless device that is connected (using the vehicle data cable) to the vehicle and transmits vehicle data to the Diagnostic Tool. To use the Scanner function the Scan Module must be paired with the Diagnostic Tool. - Page 49 Scanner Operations Scanner Operation Code Scan Option (Systems Menu-Wireless Only) NOTE: Depending on the vehicle, the Code Scan option may be available from the systems menu (Figure 4-19). Figure 4-19 Systems Menu - Code Scan Code Scan is used to scan all available vehicle control modules for DTC’s at once. This time saving feature displays the following information progressively as the modules are scanned.
- Page 50 Scanner Operations Scanner Operation Figure 4-20 Code Scan Features 1— SureTrack Common Replaced Parts Graph 2— Code Scan Summary 3— Progressive status indicator 4— Systems Summary List (with DTC totals) 5— Individual System DTC Reports 6— SureTrack Fix It! icon...
- Page 51 Scanner Operations Scanner Operation Select Print from the toolbar to print the Code Summary Report. Figure 4-21 Printed Code Summary Report...
-
Page 52: Vehicle Test Selection
Scanner Operations Scanner Operation 4.3.4 Vehicle Test Selection Selecting a vehicle test: 1. After a system is selected and the Scanner establishes communication with the vehicle, the Scanner Main menu displays available tests. Select a menu item to continue. Figure 4-22 Scanner Main menu Main menu options vary slightly by year, make, and model. - Page 53 Scanner Operations Scanner Operation Data Display Depending upon the test vehicle, this selection may appear as Data, Data Display, Data Only, Data (No Codes), or something similar. All are similar. Selecting has one of the following results: A submenu of data viewing choices displays. •...
- Page 54 Scanner Operations Scanner Operation Data Graphs Select the Graph icon to open a data graph for that parameter (Figure 4-24). Selecting a parameter for graph view moves it to the top of the list. Select the Graph icon again to close the graph for that parameter and return to a data list view.
- Page 55 Scanner Operations Scanner Operation To adjust the amount of data collected after a trigger: 1. Select the Properties icon on the Scanner toolbar to open the dialog box. 2. Highlight one of the Samples After Trigger options: 3. Select the Accept icon to close the dialog box. NOTE: You can also adjust the amount of data collected after a triggering event using the Properties icon on the Scanner toolbar.
- Page 56 Scanner Operations Scanner Operation Once all of the data is compiled, data collection pauses and the information is saved as a movie. A confirmation screen displays to let you know the name automatically assigned to the saved file and where to locate it. Figure 4-27 Sample saved movie confirmation screen 8.
- Page 57 Scanner Operations Scanner Operation Figure 4-28 Sample manual scale selection The dialog box closes and the parameter scale is now at the set values. Using Zoom The zoom options on the Data Buffer toolbar allow you to change the magnification level of the sweep when viewing data graphs.
- Page 58 Scanner Operations Scanner Operation A code list includes the DTC and a brief description, and a SureTrack Fix It! icon that opens a submenu allowing you additional information about the DTC (Figure 4-29). Figure 4-29 Sample code list Clear Codes The Scanner clears trouble codes from the electronic control module memory on some vehicles.
- Page 59 Scanner Operations Scanner Operation DTC Status This selection allows you to view the records of a particular DTC. To check DTC status 1. Select DTC Status from the Codes Menu. The DTC Status entry field displays and the virtual keyboard opens (Figure 4-30).
- Page 60 Scanner Operations Scanner Operation Functional Tests The Functional Tests selection is used to access vehicle-specific subsystem and guided component tests. Available tests vary by manufacturer, year, and model, and only the available tests display in the menu. There are four general types of functional test operations: Information Tests—are read-only tests, like selecting “VIN”...
- Page 61 Scanner Operations Scanner Operation Functional test controls allow you manipulate the test signal as shown in Table 4-4. Table 4-4 Functional test control icons Name Icon Description Test Activates the test. Return Moves focus back to the data list. Change List Allows you to switch data lists.
- Page 62 Scanner Operations Scanner Operation Troubleshooter information is organized into a series of diagnostic tips that are designed to quickly lead you to the root cause of a particular problem. The tips are vehicle-specific, which means only tips that relate to the identified vehicle are presented. Selecting opens a menu that may include: Code Tips—provides detailed information on setting conditions, testing, and interpreting test •...
-
Page 63: Stopping Communication And Exiting The Scanner
Scanner Operations Stopping Communication and Exiting the Scanner 4.4 Stopping Communication and Exiting the Scanner The Scanner remains open as long as there is an active communication link with the vehicle. You must first stop communication with the vehicle in order to exit from the Scanner function. A warning message displays if you attempt to exit from the Scanner while it is communicating with the vehicle ECM. -
Page 64: Chapter 5 Scan Module Operation
Scan Module Operation Chapter 5 This chapter describes the connection, operation, troubleshooting and updating of the Scan Module. 5.1 Overview The Scan Module is a wireless device that is connected to the vehicle and transmits vehicle data to the diagnostic tool. The Scan Module operates on 12 or 24VDC vehicle power, supplied through the vehicle’s data link connector (DLC). -
Page 65: Pairing The Scan Module
Scan Module Operation Pairing The Scan Module 5.2 Pairing The Scan Module To use the Scan Module with the Scanner or OBD-II/EOBD functions, it must first be paired with the diagnostic tool. Pairing is the wireless connection (identification) process used to connect the Scan Module to your diagnostic tool. -
Page 66: Checking Scan Module Paired Status
Scan Module Operation Checking Scan Module Paired Status NOTE: Search results include all compatible wireless devices detected, and may include multiple Scan Modules if you are in a shop environment where more than one unit is powered on. Available module listings include a partial serial number. Make sure the screen listing matches the last six digits of the serial number of your Scan Module before continuing. -
Page 67: Data Cable Connection
Scan Module Operation Data Cable Connection Figure 5-4 Typical Paired Devices screen 2. Verify the Scan Module is in the list of paired devices. 5.4 Data Cable Connection To use the Scan Module for Scanner and OBD-II/EOBD testing, it must first be connected to the vehicle’s data link connector (DLC). -
Page 68: Troubleshooting
Scan Module Operation Troubleshooting For data cable vehicle power connection information, see Vehicle Power on page 9. To connect the data cable to the vehicle: 1. While using the Scanner or OBD-II/EOBD function, follow the on-screen instructions for connecting the cable and/or any adapters required to the vehicle (Figure 5-5). -
Page 69: Checking Hardware Status
Scan Module Operation Troubleshooting 5.5.3 Checking Hardware Status Verifying the Hardware Status is always the first step in troubleshooting a wireless connection issue. The Hardware Status indicators in the lower-right corner of the Home screen provide a quick reference to wireless operations. The background color of the status indicator icon represents the condition of the wireless connectivity to that device. - Page 70 Scan Module Operation Troubleshooting 1— Vehicle Power—green LED, flashes during wireless communications 2— Communication—red LED, illuminates if there is a communications failure 3— Bluetooth—green LED, flashes during wireless communications Figure 5-6 Scan Module LEDs Each LED can be in one of three states; off, lit solid, or flashing. Interpret as follows: Vehicle Power •...
-
Page 71: Recovery Procedure
Scan Module Operation Troubleshooting 5.5.4 Recovery Procedure This is a quick and easy method that reestablishes connectivity between the diagnostic tool and the Scan Module in most instances. If bluetooth connectivity remains unavailable following recovery, use one of the alternate procedures to restart the system. NOTE: This product is intended to be used by professional technicians in a garage environment. - Page 72 Scan Module Operation Troubleshooting Figure 5-8 Scan Module USB jack, handgrip removed 3. Plug the small end of the USB cable into the USB jack on the Scan Module. 4. Plug the large end of the USB cable into a USB jack on the diagnostic tool. Scanner functionality should be restored immediately once the USB connection is complete.
-
Page 73: Updating Scan Module Firmware
Scan Module Operation Updating Scan Module Firmware 5.6 Updating Scan Module Firmware The internal programming (firmware) of the Scan Module, may require periodic updates. These firmware updates (when available) are delivered with diagnostic software updates/upgrades. Firmware updates increase the Scan Module’s diagnostic capabilities, typically by adding support for new tests, vehicles and enhanced applications to the vehicle databases. - Page 74 Scan Module Operation Updating Scan Module Firmware Figure 5-10 Sample update in progress screen A “successfully updated” message displays once the installation process is complete (Figure 5-11). Figure 5-11 Sample firmware update complete message 2. Select OK to close the message and return to Scanner operations. The updated Scan Module, is ready to use.
- Page 75 Scan Module Operation Updating Scan Module Firmware IMPORTANT: The Scan Module data cable must be disconnected from the vehicle during the update process. a. From the bottom of the Scan Module, gently lift up and out on the sides of the handgrip to free it from housing (Figure 5-12).
- Page 76 Scan Module Operation Updating Scan Module Firmware A “successfully updated” message displays once the installation process is complete (Figure 5-14). Figure 5-14 Firmware update complete message 6. Select OK to close the message and return to the Scanner function. The updated Scan Module, is ready to use.
-
Page 77: Chapter 6 Obd Direct Operations
OBD Direct Operations Chapter 6 This Home screen option allows you to access Generic OBD-II/EOBD Scanner tests without completing a vehicle identification. OBD Direct presents a quick way to check for diagnostic trouble codes (DTCs), isolate the cause of an illuminated malfunction indicator lamp (MIL), check monitor status prior to emissions certification testing, verify repairs, and perform a number of other services that are emissions-related. -
Page 78: Obd Health Check
OBD Direct Operations OBD Health Check 6.1 OBD Health Check The OBD Health Check offers a way to quickly check for and clear generic diagnostic trouble codes (DTCs) and to check readiness monitors. Selecting OBD Health Check opens a submenu of options (Figure 6-2). -
Page 79: Global Obd Ii Clear Codes
OBD Direct Operations OBD Health Check Pending Codes The purpose of this service is to enable the scan tool to obtain “pending” or maturing diagnostic trouble codes. These are codes whose setting conditions were met during the last drive cycle, but need to be met on two or more consecutive drive cycles before the DTC actually sets. -
Page 80: Mil Status
OBD Direct Operations OBD Diagnose 6.1.4 MIL Status This item is used to check the current condition of the malfunction indicator lamp (MIL). Additional information, such as which ECM commanded the MIL on and the distance driven while the MIL is on (if supported), can also be displayed. - Page 81 OBD Direct Operations OBD Diagnose 2. Select Continue. A communications message that shows how many ECMs were detected, which ECM is communicating, and which communication protocol is being used displays (Figure 6-5). Figure 6-5 Sample communication message 3. Select Continue and a menu of available tests displays (Figure 6-6).
- Page 82 OBD Direct Operations OBD Diagnose Readiness Monitors Use this menu item to check the status of the monitored system. If a monitored system is not supported, it is not displayed. Scroll, if needed, to view the entire list of monitors. Selecting Readiness Monitors opens a submenu with two choices: Monitors Complete Since DTC Cleared—displays the results of all monitor tests that have •...
- Page 83 OBD Direct Operations OBD Diagnose ($04) Clear Emissions Related Data This item is used to clear all emission related diagnostic data such as, DTCs, freeze frame data, and test results from the memory of the selected ECM. ($05, 06, 07) Display Test param./Results This option opens a submenu of test parameters and test results from various sensors, monitor test results, and a record of DTCs detected during the last drive cycle.
-
Page 84: Connector Information
OBD Direct Operations OBD Diagnose 6.2.2 Connector Information This option opens a database of vehicle diagnostic connector locations that includes most makes and models. To locate a vehicle diagnostic connector: 1. Select Connector Information from the System menu. 2. Select a manufacturer from the list presented. 3. -
Page 85: Chapter 7 Guided Component Test Operations
Guided Component Test Chapter 7 Operations The Guided Component Test software is a component-testing powerhouse, providing you with a robust diagnostic database for use with scopes and meters. It is like having access to a complete library of shop manuals for testing engine-management components, transmission sensors and components, and ABS systems. -
Page 86: Menu Options, Guided Component Test
Guided Component Test Operations Vehicle Identification 7.1.1 Menu Options, Guided Component Test Selecting the Toolbar Menu icon at the base of the screen offers the following options: Safety Information—opens the Important Safety Instructions document. • File—allows you to print or save the data being viewed. •... -
Page 87: Creating A Favorites List
Guided Component Test Operations Vehicle Identification Power User Tests The Power User Tests option gives you quick access to a pre-configured meter for conducting a number of control system tests. Tests are available with or without on-screen help. Help typically provides a description of the test along with expected results and a link to the pre-set meter. - Page 88 Guided Component Test Operations Vehicle Identification Figure 7-1 Sample manufacturer list To configure a favorites list: 1. Select Configure Favorites on the toolbar. A list of selectable manufacturers displays. Figure 7-2 Sample Configure Favorites screen 2. Select each manufacturer you want to include, selected manufactures are highlighted. NOTE: Manufacturers appear on the favorites list in the order in which they are selected.
-
Page 89: Identifying A Test Vehicle
Guided Component Test Operations Vehicle Identification 4. Select Full List on the toolbar to view the complete list of manufacturers. 5. Select Back on the toolbar at any time to return to the previous screen. Your favorites list is what will display whenever a Guided Component Test database is started in the future. - Page 90 Guided Component Test Operations Vehicle Identification Figure 7-4 Sample available tests list 8. Select ENGINE and a component test menu displays (Figure 7-5). Figure 7-5 Sample available component tests list 9. Select a test to continue. The identification sequence is now complete, refer to the Operations section that follows for details on how to navigate through the Guided Component Test information and perform tests.
-
Page 91: Operations
Guided Component Test Operations Operations 7.2 Operations The Guided Component Test software provides vehicle specific g component test uided procedures and information that aid in setting up scopes and meters. Once a test vehicle is identified, you can select a g component test from the list of available tests. -
Page 92: Tests
Guided Component Test Operations Operations NOTE: An additional selection, such as front or rear for an oxygen sensor (O2S), may be required before advancing to the component information screen. The component information screen displays (Figure 7-6). Always Gesture sweep to view any additional information below what is visible. 4. - Page 93 Guided Component Test Operations Operations 3. Select a test option and the test screen displays (Figure 7-8). Figure 7-8 Sample Test screen 4. Gesture sweep to view any additional information. 5. Select Back at any time to return to the previous screen, or select Exit to return to the main component menu.
- Page 94 Guided Component Test Operations Operations View Meter A Meter icon, which is only available in the Guided Component Test view meter mode, appears on the upper toolbar (Figure 7-9). Figure 7-9 Sample view meter window Three view meter options are available: 1.
- Page 95 Guided Component Test Operations Operations Selecting the Close icon (red box with an X) when viewing the meter in a separate window closes the meter and returns you to the Guided Component Test screen. 3. Select the Meter icon a third time to close the separate window and return to the standard meter view as shown in Figure 7-9.
-
Page 96: Chapter 8 Scope Multimeter
Scope Multimeter Chapter 8 This Scope Multimeter module provides all the tools needed for performing electrical and electronic circuit tests and for monitoring signals and circuit activity. The Scope Multimeter works interactively with other modules. Selecting “View Meter” from a Guided Component Test or Scanner Test starts the Scope Multimeter module. - Page 97 Scope Multimeter Getting Started Table 8-1 Scope Function Range Accuracy/Comments Ch. 1—yellow banana jack Each channel input is referenced to Ch. 2—green banana jack Signal Measurement common ground input (GND—black banana Ch. 3—blue banana jack jack) Ch. 4—red banana jack Single trace mode = 6 MSPS (Ch.
-
Page 98: Leads, Probes And Adapters
Scope Multimeter Getting Started 8.1.2 Leads, Probes and Adapters The Scope Multimeter uses standard safety banana plugs that are compatible with many accessories. The various leads, probes, clips, and adapters that are supplied with or available for the Diagnostic Tool explained in this section. IMPORTANT: When removing leads from their sockets, do not pull on the wire because it can damage the leads. - Page 99 Scope Multimeter Getting Started Channel 3 Lead Figure 8-3 Blue Channel 3 lead The non-shielded blue lead (Figure 8-3) is used for either Channel 3 or Digital Meter minus (–). The lead color matches the color of socket 3 on the diagnostic tool, as well as the color of trace 3 on the test screen.
- Page 100 Scope Multimeter Getting Started Secondary Coil Adapter Lead (optional) Figure 8-7 Secondary Coil Adapter lead The optional Secondary Coil Adapter lead (Figure 8-7) connects to the clip-on secondary wire adapter, coil-in-cap adapter or coil-on-plug adapter to display secondary waveforms. Secondary Ignition Clip-on Wire Adapter (optional) Figure 8-8 Secondary Ignition Clip-on Wire Adapter The optional Secondary Ignition Clip-on Wire Adapter (Figure...
-
Page 101: Menu Icon Options, Scope Multimeter
Scope Multimeter Getting Started Low Amp Current Probe (optional) The optional Low Amp Current Probe provides accurate and reliable non-intrusive testing of ignition coils, fuel injectors, fuel pumps, relays, electric motors, and parasitic draw. The optional Low Amp Current Probe measures current from 10 mA to 60 Amps. Figure 8-10 Low Amp Current Probe 8.1.3 Menu Icon Options, Scope Multimeter... -
Page 102: Navigation
Scope Multimeter Navigation Help A variety of utilities and additional resources are available through the Help menu: User Manual • Version Info • Activation Status • Scope About • Scope About This option opens a dialog box that contains the software version and other specific details about the Scope module. - Page 103 Scope Multimeter Navigation 1— Scope Multimeter Toolbar 2— Main Body 3— Trace Details 4— Record/Playback Control Toolbar Figure 8-11 Scope Multimeter screen layout Scope Multimeter Toolbar The Scope Multimeter toolbar is used to set up the tool for testing and to configure the settings for each trace.
- Page 104 Scope Multimeter Navigation Table 8-4 Scope Multimeter toolbar icons (part 2 of 2) Name Icon Description Opens a dialog box that allows you to select options File for saving data. Opens a dialog box that allows you to configure and Print print data.
- Page 105 Scope Multimeter Navigation 1— Peak Detect on 2— Filter on 3— Inverted trace 4— Coupling AC on 5— Sweep setting 6— Trigger setup 7— Trigger set on the rising slope Figure 8-12 Sample data detail display The following trace adjustments and settings are available: Profile—switches the trace for the selected channel on and off.
- Page 106 Scope Multimeter Navigation Record/Playback Control Toolbar The record/playback control toolbar at the base of the screen is used for recording data and for reviewing paused data. Use the stylus or your finger tip to activate the icons. A position counter in the toolbar displays a numerical value of where the current screen is in relation to the entire recorded file.
-
Page 107: Making Selections
Scope Multimeter Operations Use the slider in the middle of the toolbar to quickly move through paused data. Figure 8-13 Sample data buffer slider 8.2.2 Making Selections Most selections for setting up and operating the scope are made using the stylus and the scope toolbar. - Page 108 Scope Multimeter Operations Lab Scope Options The following options are available for testing: 4 Channel Lab Scope • Volts DC • Low Amps (20) • Low Amps (40) • Low Amps (60) • Ignition Probe • 100 PSI Vacuum • 100 PSI Pressure •...
-
Page 109: Measurement Out Of Range
Scope Multimeter Operations Digital Multimeter Options The following options are available for testing: Volts DC • Volts DC Average • Volts AC RMS • Ohms • Diode/Continuity • Low Amps (20) • Low Amps (40) • Low Amps (60) • Presets Presets are factory configured meter settings for common component tests. - Page 110 Scope Multimeter Operations Trace Controls The Traces controls are used to adjust individual characteristics of how the signal is sampled and displayed for each of the four traces. To adjust trace controls: 1. Select Setup from the Scope Multimeter toolbar. The Scope Multimeter Preferences dialog box opens.
- Page 111 Scope Multimeter Operations Coupling AC—check when sampling an AC signal, uncheck for DC signals. – Peak Detect—use when trying to capture a fast event or signal glitch. – Filter—use when radio frequency interference (RFI) may be disrupting the signal. – 9.
- Page 112 Scope Multimeter Operations Trigger Controls Triggering allows you to set the scope so that it only begins displaying a trace once predetermined signal conditions, or triggers, are met. The trigger point is indicated by a plus sign (+) on the scope grid.
- Page 113 Scope Multimeter Operations View Controls Use the view controls to set display attributes. To adjust view controls: 1. Select Setup from the Scope Multimeter toolbar. The Scope Multimeter Preferences dialog box opens. 2. Select View to open a submenu. Three types of adjustment are available on the submenu: Display—use to adjust what information displays and how it appears –...
- Page 114 Scope Multimeter Operations Show Digital KV—available only in ignition scope, adds a kilovolt reading to the screen. • Show Grid—switches grid lines on the screen off and on (Figure 8-19). • Figure 8-19 Sample grid selected Invert Colors—switches the screen background to white. •...
- Page 115 Scope Multimeter Operations Figure 8-21 Sample 2 Windows vertical display 3 windows—shows three traces, one below another, on the same screen (Figure 8-22). • Figure 8-22 Sample 3 Windows display 4 windows—shows four traces, one below another, on the same screen. •...
- Page 116 Scope Multimeter Operations Units Settings The Units dialog box allows you to switch between Full Scale or Per Division settings for the trace setup and the display settings. Selecting Full Scale configures the units to the full viewing area of the screen, while Per Division adjusts the units to a single division (one tenth) of the screen.
- Page 117 Scope Multimeter Operations Abbreviation Description kg/cm2 kilograms per centimeter squared kilopascal mmHg millimeters of mercury pounds per square inch Selecting Units opens the Setup dialog box. The selected radio knobs on the Setup dialog box show which settings are active (Figure 8-24).
- Page 118 Scope Multimeter Operations Ignition The Ignition tab of the Setup dialog box is used to configure the scope for displaying secondary ignition patterns. There are two main selection fields (Type and Cylinders) and two fields that vary depending upon the type of ignition system selected in dialog box (Figure 8-26).
- Page 119 Scope Multimeter Operations Data The Data icon on the toolbar switches the trace details information at the base of the screen as previously in Trace Details on page 94. Cursor Controls The cursor controls include a Show Cursors check box plus a slide control and arrows for moving the cursor position left or right.
- Page 120 Scope Multimeter Operations File Controls Selecting File from the toolbar opens a dialog box with a menu of save options: Figure 8-28 Sample file setup dialog box Save Configuration—saves the current setup values as a preset. • Save Single Frame—saves the data currently on the screen only. •...
-
Page 121: Chapter 9: Information
Information Chapter 9 After using the Scanner function, Guided Component Test, and Scope Multimeter to diagnose and locate the source of problem, select Information on the Home screen to link to resources that help you fix the problem and get the vehicle back in service Figure 9-1 Figure 9-1 Sample Home screen Information icon A built in repair information database is available. - Page 122 Information Vehicle Identification The Information main menu options are detailed in the table below: Table 9-1 Information icon descriptions Name Icon Description Provides information on retrieving, diagnosing, and Diagnostic Trouble repairing diagnostic trouble code (DTC) problems. Codes “Diagnostic Trouble Codes” on page 113.
-
Page 123: Diagnostic Trouble Codes
Information Diagnostic Trouble Codes 9.2 Diagnostic Trouble Codes Information for locating, diagnosing, and repairing diagnostic trouble code (DTC) problems is located here. Information is specific to the identified vehicle. To access DTC information: 1. Double tap the Diagnostic Trouble Codes icon. A Data Category list displays (Figure 9-3). -
Page 124: Printing Diagnostic Trouble Code Information
Information Diagnostic Trouble Codes NOTE: There may be more than one Trouble Code Identification selection available, as the information is broken down into subcategories when there is a large amount of data or there are different types of codes available. A search feature, available for all of the trouble code identification selections, is available to help you quickly find the code information you need. -
Page 125: Engine Management Component Testing
Information Engine Management Component Testing 9.3 Engine Management Component Testing Procedures for diagnosing, evaluating, and testing engine management system components are found in this section. Information is specific to the identified vehicle. To access engine management component testing: 1. Double tap the Engine Management Component Testing icon. A category list displays (Figure 9-3). -
Page 126: Engine Management Component Testing Screen
Information Engine Management Component Testing 9.3.1 Engine Management Component Testing Screen There are three main screen fields for engine management component testing (Figure 9-6): 1— Toolbar—located at the top of the screen, the toolbar allows you to quickly navigate between different functions and operations. See “Toolbar”... - Page 127 Information Engine Management Component Testing Table 9-2 Information icon descriptions (part 2 of 2) Name Icon Description Advances to show the next illustration in the Next Illustration displayed article. Opens a wiring diagram for the test vehicle. This is the same diagram available from the Wiring Wiring Diagram Diagrams module, see “Wiring Diagrams”...
-
Page 128: Engine Management Pin Data
Information Engine Management Pin Data 9.4 Engine Management Pin Data An electronic control module (ECM) connector diagram with pin assignments and test conditions are contained in this section. Double tap the Engine Management Pin Data icon to view the information (Figure 9-7). -
Page 129: Information Tabs
Information Component Locations 9.4.2 Information Tabs The Information Tabs determine how the ECM connector pin information displays. There are three information options: By Component—only the data for the selected component is shown in the table. Component • selections are listed by name only in alphabetical order, there are no pin numbers on the list. By Pin Number—only the data for the selected pin is shown in the table. - Page 130 Information Component Locations Engine Management—provides engine control system component location information. • Antilock Brake Systems—provides ABS component location information. • Fuse Boxes/Relay Plates—provides power distribution component location information. • General Components—provides major component location information for the entire vehicle. • Airbags—provides supplemental restraint system component location information.
-
Page 131: Wiring Diagrams
Information Wiring Diagrams 9.6 Wiring Diagrams This home page selection contains system wiring diagrams for the identified test vehicle, the number of diagrams available varies by year and model. Selecting the Wiring Diagrams icon opens a data category menu. Select a menu item with the stylus to open the wiring diagram. A typical wiring diagram screen is shown in Figure 9-10. -
Page 132: Component Selection Menu
Information Wiring Diagrams Table 9-3 Information icon descriptions Name Icon Description Expands the wiring diagram to full-page size, scroll Full Size bars appear for moving up and down and left and right through the diagram. Cancels the full-size diagram and return to the Fit to Window split-screen display. -
Page 133: Chapter 10 Vehicle History Operations
Vehicle History Operations Chapter 10 Vehicle History allows you to manage and retrieve vehicle records, for vehicles that have been scanned or identified previously. You can also activate a vehicle, so there is no need to go through the complete vehicle identification sequence when performing a retest after repairs have been made. -
Page 134: Vehicle History Toolbar
Vehicle History Operations Screen Layout To resize a column: 1. Select the line separating two columns. A line with arrowheads appears to show the column is ready for resizing. 2. Drag the line left or right to increase or decrease the column width. 10.1.2 Vehicle History Toolbar The table below gives brief descriptions of the control icons on the toolbar: Table 10-1 Toolbar icons... - Page 135 Vehicle History Operations Screen Layout View Select View to open, edit, add notes, and print a vehicle record. To open and/or modify a vehicle record: 1. Highlight the desired vehicle record from the vehicle records list screen, then double click it, or select View from the toolbar.
- Page 136 Vehicle History Operations Screen Layout Manage Select Manage to quickly remove individual records, or all the vehicle records from the vehicle records list. Highlight the record to remove, then select Delete, or use the Select All or Deselect All options to remove all records (Figure 10-3).
- Page 137 Vehicle History Operations Screen Layout Figure 10-4 Sample Search dialog box 3. Select Search twice. The first tap closes the keyboard, the second tap starts the search. The display returns to the vehicle records list screen with only the records found in the search criteria showing.
- Page 138 Vehicle History Operations Screen Layout 2. Select or deselect the desired categories: Highlighted items - do not display – Non-highlighted items - display – 3. Select OK on the toolbar to accept the changes, and return to the previous screen.
-
Page 139: Chapter 11: Data Manager Operations
Data Manager Operations Chapter 11 The Data Manager is used to store, sort, and review saved files. Most operations are controlled through the toolbar. 11.1 Screen Layout Select Data Manager on the Module toolbar to open the file system. Use the toolbar at the top of the screen to navigate through the data. -
Page 140: Navigation
Data Manager Operations Navigation Scope Multimeter Data Folder—contains files saved while working with the Scope Multimeter. • Scope Viewer on page 152. Screenshots—contains images saved by pressing the Shortcut (S) button. See Image Viewer • on page 153. 11.2 Navigation Use the toolbar icons as shown in the table below to navigate through the Data Manager: Table 11-1 Data Manager toolbar icons Name... -
Page 141: Operations
Data Manager Operations Operations 11.3 Operations Data Manager operations based on toolbar selections are explained in the following sections. 11.3.1 My Data The My Data icon is a shortcut that quickly returns you to the main Data Manager screen. Select the icon at any time to instantly return. -
Page 142: New
Data Manager Operations Operations The screen advances and the contents of the open folder are shown in the folders panel. Highlight an item in the folders panel and the information or preview displays, if available, in the lower portion of the screen (Figure 11-2). -
Page 143: Delete
Data Manager Operations Operations 11.3.5 Delete The Delete icon moves folders or items within folders to the Recycling bin. A confirmation displays when a file is selected for deletion. Select Yes to delete the file or Cancel to exit. To delete an item: 1. -
Page 144: Rename
Data Manager Operations Operations 11.3.6 Rename The Rename icon allows you to change the name of a folder or items within a folder. To rename an item: 1. Highlight the item or folder to be renamed. 2. Select the Rename icon on the toolbar. The New Name dialog box opens (Figure 11-3). -
Page 145: Properties
Data Manager Operations Operations 11.3.7 Properties The Properties icon function allows you to change the name and assign identifying attributes to saved Scope Multimeter files. Operation is similar to renaming a file as discussed above, except there are additional fields for entering descriptive information. To assign properties to an item: 1. -
Page 146: Email
Data Manager Operations Operations 11.3.9 Email Selecting the Email icon from the Data Manager toolbar allows you to send a saved data or image file as an attachment using e-mail. To use this feature, you must install an e-mail client, and then either link your existing e-mail address to the client, or create a new address. - Page 147 Data Manager Operations Operations attachment Figure 11-8 4. Enter the e-mail address of the recipient, and any other information needed. 5. Select the Send icon to send the e-mail. NOTE: You must have an Internet connection to send e-mail. E-mail client installation and setup (Example): The following instructions are intended as a guide only, as e-mail client setup procedures vary.
- Page 148 Data Manager Operations Operations 2. Install the software following the screen prompts (Figure 11-10). Figure 11-10 3. Continue through the setup. If available choose “set as my default mail application” (Figure 11-11). Figure 11-11...
- Page 149 Data Manager Operations Operations 4. Choose to use your existing email address, or create a new email address with the email client (Figure 11-12). Figure 11-12 5. Enter your e-mail information as required (Figure 11-13). NOTE: E-mail client configuration settings should automatically be set during installation. If problems arise with the setup and manual configuration is needed, refer to the e-mail client help information and the Windows help information.
- Page 150 Data Manager Operations Operations 6. If your existing email provider login screen displays, enter your email address and password to allow the client to continue the setup with your provider (Figure 11-14). Figure 11-14 7. Follow the screen prompts to allow the client to link to your email address. 8.
-
Page 151: Viewing Saved Files
Data Manager Operations Viewing Saved Files 11.4 Viewing Saved Files As mentioned in the beginning of this section, the data and image files in the Data Manager folders are also accessible from the Windows My Documents > ShopStream folder. You may access, copy or move the files you save in the ShopStream Diagnostic Suite program from the folder at anytime. -
Page 152: Scanner Dataviewer Operation
Data Manager Operations Scanner DataViewer Operation 11.6 Scanner DataViewer Operation The Scanner DataViewer allows you to review saved scanner data files (Figure 11-17). To open saved Scanner data files, select the Scanner Data Folder menu option from the Data Manager main menu. -
Page 153: Menu Bar
Data Manager Operations Scanner DataViewer Operation 11.6.1 Menu Bar The menu bar at the top of the screen contains the File, View, Tools, and Help menus. File Menu The File menu offers the following selections: Load—locate and open data files, launches a navigation window •... - Page 154 Data Manager Operations Scanner DataViewer Operation Figure 11-19 Print preview window (text list and graphs examples) View Menu The View menu allows you to change how data is displayed on the screen (Figure 11-20). Figure 11-20 Scanner DataViewer View menu Select from the following menu options: Text Only—shows all parameters and their values as text only •...
- Page 155 Data Manager Operations Scanner DataViewer Operation Tools Menu The Tools menu opens the Properties dialog box. The Properties dialog box has two sections (Figure 11-21); Shared Graph Properties and Individual Properties. Shared Graph Properties apply to all graphs and Individual Properties apply to the selected graph only.
-
Page 156: Display Toolbar
Data Manager Operations Scanner DataViewer Operation Help Menu The Help menu provides Scanner Viewer software version information. 11.6.2 Display Toolbar The Display toolbar provides the following controls (Figure 11-22). Exit—closes Scanner DataViewer. • Hide PID List—toggles display between parameter text and graph views. •... -
Page 157: Navigation Tools
Data Manager Operations Scanner DataViewer Operation 11.6.3 Navigation Tools Playback Controls The playback controls allow you to navigate through saved data (Figure 11-23). 1— Skip Back—Allows backward movement in multiple steps. 2— Step Back—Allows backward movement in singular steps. 3— Play—Select to play. 4—... - Page 158 Data Manager Operations Scanner DataViewer Operation Slider / Scroll Bars and Cursor Use the slider bar to quickly navigate through the data (Figure 11-25). During playback the number displayed on the left side of the slider bar indicates the current position of the cursor in the data file.
-
Page 159: Customizing The Display
Data Manager Operations Scanner DataViewer Operation 11.6.4 Customizing the Display The parameter text list (left side) displays parameter names and current values. The display can be customized by selecting and dragging parameters from the text list or graph display to a different location in the text list or in the graph display (Figure 11-26). -
Page 160: Customizing The Parameter List
Data Manager Operations Scanner DataViewer Operation 11.6.5 Customizing the Parameter List 1. The parameter configuration tabs allow you to choose between displaying all available parameters (Complete List), or only those from a (Custom List) (Figure 11-27). To customize the parameter list: 1. - Page 161 Data Manager Operations Scanner DataViewer Operation A list of available parameters displays (Figure 11-28). 3. Select the parameters to include in your custom list. Select All and Deselect All controls are also available to assist in the selection process. Figure 11-28 Creating a custom parameter list 4.
-
Page 162: Scope Viewer
Data Manager Operations Scope Viewer 11.7 Scope Viewer This section is intended as an introduction of the Scope Viewer, as many features are similar to the Scope module features. The Scope Viewer allows you to print and playback recorded trace signals captured on your diagnostic tool. -
Page 163: Image Viewer
Data Manager Operations Image Viewer 11.8 Image Viewer The Image Viewer allows you to open and view image files and screenshots. Figure 11-30 1— Exit - closes the Image Viewer 2— Print - prints the image 3— Captured Screen Image... -
Page 164: Chapter 12 Help Operations
Help Operations Chapter 12 Selecting Help from the Home screen opens this manual in a dedicated screen viewer. Navigate through the file either by gesture scrolling on the touch screen, or with the scroll bar along the right edge of the viewing screen. A left-to-right scroll bar appears at the bottom of the screen when magnification is increased. -
Page 165: Chapter 13 System Settings Operations
System Settings Operations Chapter 13 Selecting System Settings from the Home screen opens a menu with two options: Paired Devices - Paired Devices allows you to check the status and pair wireless devices to • the Diagnostic Tool. Shop Information - Shop Information allows you to create and edit a personalized header that •... -
Page 166: Pairing The Wireless Scan Module
System Settings Operations Paired Devices The Hardware Status indicators in the lower-right corner of the Home screen provide a quick reference to wireless device operations. The background color of the status indicator icon represents the condition of the wireless connectivity to that device. Icon status is shown in the table below: Hardware Background... -
Page 167: Shop Information
System Settings Operations Shop Information 13.2 Shop Information This option allows you to add personalized shop information that can be included on printed data files. Selecting opens a form that can be filled in using the virtual keyboard. Select OK when the form is complete and the information is saved. -
Page 168: Data Backup
System Settings Operations Data Backup 13.3 Data Backup Selecting Data Backup from the Systems Settings main menu provides two options, backup and restore. 13.3.1 Backup The Backup option allows you to back up your saved data to a file on the internal hard drive, or to an external drive (e.g. -
Page 169: Restore
System Settings Operations Data Backup 13.3.2 Restore The Restore option is used to restore your backed up data, in the event that the data is lost or if a system restore (recovery) has been performed. This function is only applicable when a backup file has been previously saved (file extension .sna). "Backup‚"... -
Page 170: Chapter 14 Suretrack
(Figure 14-1). To purchase software upgrades or join the software subscription program, see your Snap-on Representative. Selecting OK will close the message box until the beginning of the next month when it will appear to remind you again. Selecting Snooze 1 Week will close the message box for approximately one week and then it will re-appear. -
Page 171: Suretrack Status Messages
- indicates your access to SureTrack will be expiring soon and you should contact your sales representative to purchase the current software upgrade. Your SureTrack access has expired. See your Snap-on representative to renew. - • indicates your access to SureTrack has expired and you should contact your sales representative to purchase the current software upgrade. -
Page 172: Common Replaced Parts Graph
SureTrack® Using SureTrack 14.2.1 Common Replaced Parts Graph The Common Replaced Parts graph (Figure 14-3) shows the percentage of verified fixes (using the parts listed) derived from the total number of repairs by mileage. One example in the illustration below indicates that based on 37 repairs involving vehicles with up to 200k miles, approximately 16% of the repairs (spark plug replacement) occurred at 125k miles. - Page 173 SureTrack® Using SureTrack NOTE: The Fixed It! numbers shown (e.g. +28) in Figure 14-4 indicate the total number of repairs surveyed that replaced the #1 ignition coil to fix the vehicle. Menu options are also provided for the following: Related Tips—opens a list of tips that may include information that is related to the current DTC (Figure 14-5).
- Page 174 SureTrack® Using SureTrack Repair Information—opens the Information function (Figure 14-8). The Information program is a built in repair information database. For additional information, see “Information” on page 111. Figure 14-7 Figure 14-8 Information Main Menu...
-
Page 175: Chapter 15 Shopstream Update Tool (Sst)
ShopStream Update Tool Chapter 15 (SST) The ShopStream Update Tool (SST) is a maintenance program that automatically keeps your diagnostic software up-to-date. The following terms are used in this section and throughout this manual as described below: Software Upgrade - a new diagnostic software version. Software upgrades include new and •... - Page 176 ShopStream Update Tool (SST) Basic Operation Figure 15-1 SST Icon in system tray Selecting the SST icon from the system tray provides the following menu choices: Check for Updates - Allows you to manually check for software updates anytime. See •...
-
Page 177: Manual Software Download
ShopStream Update Tool (SST) Manual Software Download 15.2 Manual Software Download This section describes the basic procedures for manually downloading software updates and upgrades. Normally, the SST will automatically detect and download software. If necessary, use the following procedure to manually check for and download software. NOTE: It is recommend that you download software upgrades when not actively using the diagnostic tool. - Page 178 ShopStream Update Tool (SST) Manual Software Download 2. Select Check for Updates from the menu. A series of message boxes will display as the SST searches for updates (Figure 15-4). Figure 15-4 Typical - Checking for Updates message Once the search is complete, one of two results are expected: If no updates are found, the message box closes and a “No updates available”...
-
Page 179: Installing Software Updates
ShopStream Update Tool (SST) Installing Software Updates Cancel—stops and cancels the download and closes the message box. If you select – Cancel, and choose to re-start the download again, the download will start from the beginning. 4. Once the download completes, it must be installed. See the applicable instructions for Installing Software Updates on page 169 or Installing Software Upgrades... - Page 180 ShopStream Update Tool (SST) Installing Software Updates Figure 15-7 Typical update installation window 2. Select an installation option to continue: Install Now—starts the software update installation. Proceed to step 3. – Install Later—closes the message. The message will reappear at a later time as a –...
-
Page 181: Installing Software Upgrades
ShopStream Update Tool (SST) Installing Software Upgrades 15.4 Installing Software Upgrades NOTE: If applicable, before installing a software upgrade, have your Scan Module and USB cable available. The software upgrade may include firmware updates that need to be installed to the Scan Module. - Page 182 ShopStream Update Tool (SST) Installing Software Upgrades 2. Select an installation option to continue: Upgrade Detail—opens a PDF file describing the details of the software upgrade, – including any accessories that may be required. Install Now—starts the software upgrade installation. Proceed to step 3. –...
-
Page 183: Chapter 16 Maintenance
Maintenance Chapter 16 This section covers how to care for your diagnostic tool. 16.1 Cleaning the Touch Screen The touch screen can be cleaned with a soft cloth and alcohol or a mild window cleaner. IMPORTANT: Do not use any abrasive cleansers or automotive chemicals on the touch screen. 16.2 Calibrating the Touch Screen The sensitivity and accuracy of the touch screen should be calibrated before you begin using your diagnostic tool. -
Page 184: Cleaning And Inspecting The Diagnostic Tool
Maintenance Cleaning and Inspecting the Diagnostic Tool 5. Select OK to close the Calibration Options dialog box. 6. Select the Calibration Target to begin the calibration process. 7. As targets appear on the screen, select the center of the target with the tip of the stylus. Hold the stylus on the target until the release instruction appears. -
Page 185: Battery Pack Service
Maintenance Battery Pack Service 16.5 Battery Pack Service Follow all safety guidelines when handling the battery pack. Risk of electric shock. • Prior to recycling batteries, protect exposed terminals with heavy insulating tape to prevent shorting. • Disconnect all test leads and turn diagnostic tools off before removing end grips. •... -
Page 186: Replacing The Battery Pack
If the battery pack no longer holds a charge, contact your sales representative to order a new one. IMPORTANT: Replace the battery pack with original Snap-on replacement parts only. To replace the battery pack: 1. Remove the right-side handgrip from the diagnostic tool. -
Page 187: Battery Pack Calibration
The optional Smart Battery Charger automatically cycles the battery pack to calibrate it. 16.6 System Restore The diagnostic tool contains Snap-on System Restore software that returns the tool to original factory condition following a catastrophic failure. Use the procedure below to restore the system if your diagnostic tool does not start the Windows operating system, or if the hard disk drive or other system files have become corrupted. -
Page 188: Scan Module
Contact your sales representative or Customer Care. NOTE: After using the Snap-on System Restore software, the diagnostic tool is restored to original factory condition. In addition, if you have purchased and installed any of the “Bundle” updates, the most current Snap-on Bundle update will also be re-installed.
Need help?
Do you have a question about the Verus and is the answer not in the manual?
Questions and answers