Table of Contents
Advertisement
Quick Links
Advertisement
Table of Contents

Related Manuals for Snap-On VERDICT


Summary of Contents for Snap-On VERDICT
-
Page 1: User Manual
User Manual EAZ0063L05G Rev. E... - Page 2 Trademarks Snap-on, ShopStream Connect, SureTrack, Fast-Track Troubleshooter, ProDemand, ShopKey Pro and VERDICT are trademarks registered in the United States and other countries of Snap-on Incorporated. All other marks are trademarks or registered trademarks of their respective holders. The Bluetooth word mark and logos are registered trademarks owned by Bluetooth SIG, Inc. and any use of such marks by Snap-on Incorporated is under license.
-
Page 3: Safety Information
Safety Information READ ALL INSTRUCTIONS For your own safety, the safety of others, and to prevent damage to the product and vehicles upon which it is used, it is important that all instructions and safety messages in this manual and the accompanying Important Safety Instructions manual be read and understood by all persons operating, or coming into contact with the product, before operating. -
Page 4: Important Safety Instructions
Safety Information Safety Signal Words Safety Signal Words All safety messages contain a safety signal word that indicates the level of the hazard. An icon, when present, gives a graphical description of the hazard. Safety Signal words are: Indicates an imminently hazardous situation which, if not avoided, will result in death or serious injury to the operator or to bystanders. -
Page 5: Table Of Contents
Contents Chapter 1: Using This Manual ....................1 Conventions..........................1 Bold Text ..........................1 Symbols ..........................1 Terminology ........................... 1 Notes and Important Messages ..................... 2 Procedures..........................2 Hyperlinks ..........................2 Tool Help..........................2 Chapter 2: Introduction......................3 Features and Specifications ......................3 Diagnostic Tool ........................ - Page 6 Contents Vehicle Identification ......................36 Vehicle System Selection ....................38 Vehicle Test Selection ......................42 Stopping Communication and Exiting the Scanner ..............54 Chapter 5: Scan Module Operation ..................55 Overview............................. 55 Pairing The Scan Module ......................56 Checking Scan Module Paired Status ..................57 Data Cable Connection ......................
- Page 7 Contents Remote Functions Setting....................107 Pairing the M2 Scope/Meter ....................108 Remote Operation (Once paired)..................111 Chapter 9: Scope Multimeter Operations................114 Getting Started ......................... 115 Capabilities ........................115 Leads and Adapters ......................116 Menu Options, Scope Multimeter..................119 Navigation..........................120 Screen Layout ........................
- Page 8 Contents Chapter 13: Help Operations ....................169 Using the Help Toolbar......................169 Chapter 14: System Settings Operations................170 Paired Devices ......................... 170 Scan Module Pairing ......................171 M2 Scope/Meter Pairing ....................171 Shop Information ........................172 Data Backup ..........................174 Backup ..........................
-
Page 9: Chapter 1 Using This Manual
Using This Manual Chapter 1 This manual contains basic operating instructions and is structured in a manner to help you become familiar with your diagnostic tool features and perform basic operations. The illustrations in this manual are intended as reference only and may not depict actual screen results, information, functions or standard equipment. -
Page 10: Notes And Important Messages
Using This Manual Conventions 1.1.4 Notes and Important Messages The following messages are used. Note A note provides helpful information such as additional explanations, tips, and comments. Example: NOTE: For additional information refer to... Important Important indicates a situation which, if not avoided, may result in damage to the test equipment or vehicle. -
Page 11: Chapter 2 Introduction
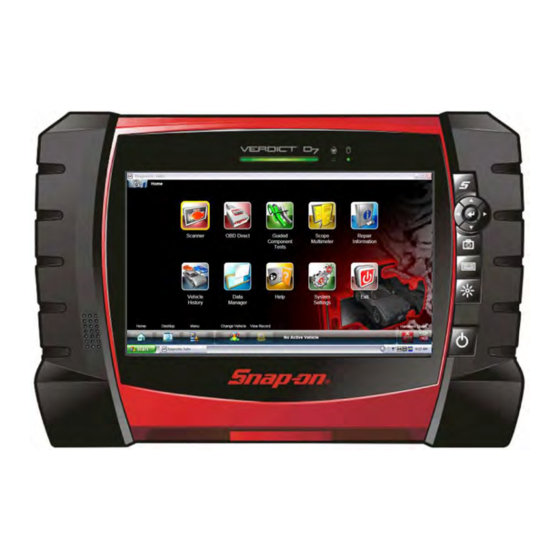
Introduction Chapter 2 This chapter introduces the basic features of the Diagnostic Tool, including the control buttons, data ports, battery pack, and power sources. Your Diagnostic Tool is a specialized personal automotive diagnostic solution that combines information with test instrumentation to help you diagnose symptoms, codes, and complaints quickly and efficiently. - Page 12 Introduction Features and Specifications 1— USB (universal serial bus) Ports (2) 2— Head Phone Jack 3— Microphone Jack 4— DC Power Supply Input Jack 5— SD (secure digital) Card Port 6— Mini USB Client Jack Figure 2-2 Model D7 side views 1—...
- Page 13 Introduction Features and Specifications Technical Specifications Item Description / Specification Touch Screen Resistive Touch Panel 7 inch diagonal, LCD TFT Display 1024 x 600 resolution SWVGA, 16 bit color Processor Intel Atom Operating System Microsoft Windows Embedded Standard SP3 802.11 b/g/n Wireless Communications ®...
- Page 14 Introduction Features and Specifications Internal Battery Pack The Diagnostic Tool can be powered from the internal rechargeable battery pack. A fully charged standard battery pack provides sufficient power for about 4 hours of continuous operation. A LED on the front of the Diagnostic Tool indicates the battery charge state. AC/DC Power Supply The Diagnostic Tool can be powered from a standard AC outlet using the AC/DC power supply.
-
Page 15: Scan Module (Wireless)
Introduction Features and Specifications 2.1.2 Scan Module (Wireless) 1— Data cable connector 2— Memory card port (remove protective hand grip for access) 3— Bluetooth LED (green) 4— Communication issue LED (red) 5— Vehicle power LED (green) 6— Universal serial bus (USB) jack (remove protective hand grip for access) Figure 2-4 Scan Module Wireless Communication The Scan Module is a wireless communications device that transmits vehicle data to the... - Page 16 Introduction Features and Specifications Technical Specifications Item Description / Specification ® Communications Wireless Bluetooth 2.0 Technology USB Power 5V @ 500mA Data Cable Connector 8V to 32V, Maximum 12 Watts Power Width 8.04 in. (204.3 mm) Height 3.82 in. (97 mm) Depth 1.66 in.
-
Page 17: M2 Scope/Meterm2 Scope/Meter (Wireless)
Introduction Features and Specifications 2.1.3 M2 Scope/MeterM2 Scope/Meter (Wireless) 1— DC Power Supply Input Jack 2— Color Graphic Display Screen 3— Soft Keys for Selecting Additional Functions 4— Rotary Switch for Selecting Primary Functions 5— Common (Ground) Lead Input Jack 6—... - Page 18 Introduction Features and Specifications Technical Specifications Item Description / Specification Display Color graphical display Battery Pack 4 1.2V Ni-Mh (nickel-metal hydride) Width 9.125 in. (231.8 mm) Height 4.25 in. (107.9 mm) Depth 2.00 in. (50.8 mm) Weight 1.9 lb (0.86 kg) Operating Temperature At 0 to 90% relative humidity (non-condensing) Range (ambient)
-
Page 19: Chapter 3 Basic Operation And Navigation
Basic Operation and Chapter 3 Navigation This chapter describes the basic operation, controls and navigation of the Diagnostic Tool. 3.1 Turning On/Off and Emergency Shutdown The following sections describe how to turn the Diagnostic Tool on and off and how to perform an emergency shutdown. -
Page 20: Controls And Indicators
Basic Operation and Navigation Controls and Indicators 3.2 Controls and Indicators The external controls on the Diagnostic Tool are simple because most operations are controlled through the touch screen. Touch screen navigation is menu driven, which allows you to quickly locate the test, procedure, or data that you need through a series of choices and questions. -
Page 21: Led Indicators
Basic Operation and Navigation Basic Navigation 3.2.2 LED Indicators There are two light-emitting diodes (LEDs) on the front face of the Diagnostic Tool (see Figure 2-1 on page 3 for locations): Battery Status Indicator LED—this Diagnostic Tool uses three colors to show the battery and •... -
Page 22: Home Screen Layout
Table 3-2 gives brief descriptions of the available Function icons, which operations are available depends upon the individual configuration of your VERDICT system. Use the stylus or your finger tip to select from the Function icons. Table 3-2 (sheet 1 of 2) -
Page 23: Toolbar
System Settings the Scan Module and the M2 Scope/Meter. System Settings Operations page 170. Closes the VERDICT Diagnostic Tool Exit software and returns the display to the Windows desktop. 3.3.4 Toolbar Operation of the icons located on the toolbar are described in the table below:... - Page 24 Basic Operation and Navigation Basic Navigation Table 3-3 (sheet 2 of 2) Name Icon Description The currently identified vehicle is shown to Change Vehicle the right of the icons, selecting allows you to change the identified test vehicle. Selecting the icon opens an editable View Record worksheet of vehicle records.
-
Page 25: Windows Toolbar
Basic Operation and Navigation Basic Navigation Activation Status This option opens a dialog box with version and licensing details for the system, and activation status for the Diagnostic Tool and all other modules. 3.3.5 Windows Toolbar This is the standard Windows toolbar. Your Diagnostic Tool is a fully functional personal computer based on the Windows Embedded Standard operating system. -
Page 26: Virtual Keyboard
Basic Operation and Navigation Virtual Keyboard 3.4 Virtual Keyboard The Virtual Keyboard allows you to type characters and key in information to complete form and data entry fields, similar to a physical keyboard. The Virtual Keyboard is normally running in the Windows background and can be opened by pressing the Virtual Keyboard button on the Diagnostic Tool. - Page 27 Basic Operation and Navigation Virtual Keyboard 1. Settings icon - opens the Virtual Keyboard settings window (Figure 3-5) 2. Expand icon - expands the Virtual Keyboard to full display (press again to return to standard display) 3. Top - moves the keyboard to top of screen 4.
-
Page 28: Camera Operation
Basic Operation and Navigation Camera Operation 3.5 Camera Operation 3.5.1 Operating the Camera Figure 3-6 Camera button A single press of the Camera button on the front of the Diagnostic Tool activates the camera. With the camera active, the touch screen becomes the view finder and is also used for reviewing photographs that are taken. -
Page 29: Viewing Pictures
Basic Operation and Navigation Wi-Fi Setup Table 3-4 Camera icons (sheet 2 of 2) Name Icon Description Displays in Gallery mode. Selecting opens the Previous picture prior to the current image in the gallery. Displays in Gallery mode. Selecting opens the Next picture after the current image in the gallery. -
Page 30: Chapter 4 Scanner Function
Scanner Function Chapter 4 The Scanner function allows your Diagnostic Tool to communicate with the electronic control modules (ECMs ) of the vehicle being serviced. This allows you to perform tests, view diagnostic trouble codes (DTCs), and view live data parameters from various vehicle systems such as the engine, transmission, antilock brake system (ABS) and more. -
Page 31: Basic Operation And Navigation
Scanner Function Basic Operation and Navigation 2. Select the Demonstration icon. A menu of demonstration choices now displays: US Domestic—contains actual data captured while driving a Chevrolet Tahoe. Look for – the throttle position (TP) sensor dropout while analyzing the data in Graphing mode. OBD Training Mode—provides simulated data for an OBD-II/EOBD vehicle that allows –... -
Page 32: Scanner Screen Layout
Scanner Function Basic Operation and Navigation 4.2.3 Scanner Screen Layout The Scanner screens typically include three sections (Figure 4-2): 1— Scanner Toolbar 2— Main Body 3— Lower Toolbar Figure 4-2 Scanner screen layout Scanner Toolbar The Scanner toolbar contains a number of icons that allow you to configure the displayed data and to exit. - Page 33 Scanner Function Basic Operation and Navigation Table 4-1 Scanner toolbar icons (sheet 2 of 2) Name Icon Description Saves a copy of the current frame of Save data that can be viewed using Data Manager. Opens a standard Windows Print Print dialog box for saving a print copy of the current frame of data.
- Page 34 Scanner Function Basic Operation and Navigation Figure 4-3 Sample custom configuration screen Keep the following in mind when configuring a custom data list: Gesture scroll if the list of parameters is longer than what is shown on the screen. – Use the Select All icon to display the complete list.
- Page 35 Scanner Function Basic Operation and Navigation Alarm indicators now appear next to the selected parameters in the Data List (Figure 4-4). Figure 4-4 Sample alarm indicators NOTE: Alarms can only be set for certain parameters. If the Alarm List dialog box is empty, no parameters are available and alarms cannot be set.
- Page 36 Scanner Function Basic Operation and Navigation Selecting either color option, Edit Plot Color or Edit Background Color opens a standard color selection dialog box. Select a color, then select OK to close the dialog box. The Show Grid icon is used to switch a background grid pattern on the data graphs on and off: To switch the grid on;...
- Page 37 Scanner Function Basic Operation and Navigation Save The Save icon is used to record movies of vehicle datastream values. Saved files can be helpful when trying to isolate an intermittent problem or to verify a repair during a road test. To save a movie: Select Save.
- Page 38 Scanner Function Basic Operation and Navigation If the Diagnostic Tool is connected to a printer, the current frame of data is printed. If the Diagnostic Tool is not connected to a printer, the frame of data is saved as an “XPS” file. A dialog box opens so that you can name the print file and specify the location that it is saved to, follow the on-screen instructions.
- Page 39 Scanner Function Basic Operation and Navigation Sweep The Sweep option switches the sweep values, displayed below the data graphs, on and off (Figure 4-10). The dropdown menu closes once a selection is made. Figure 4-10 Sample data graph sweep Main Body The main body of the screen varies depending on the stage of operation.
- Page 40 Scanner Function Basic Operation and Navigation Lower Toolbar Whenever communication is established with a vehicle, the Scanner continuously records data transmitted by the ECM in the data buffer. The toolbar below the main body of the screen contains the icons for navigating the buffered data and other options (Table 4-2).
-
Page 41: Menu Options
Scanner Function Basic Operation and Navigation 4.2.4 Menu Options The Toolbar Menu icon at the base of the screen opens a menu near the top of the display. Figure 4-12 Sample Scanner Menu icon options The following Menu options are available: Safety Information—opens the Important Safety Instructions document. - Page 42 Scanner Function Basic Operation and Navigation Units Setup The units of measurement can be changed for temperature, vehicle speed, air pressure and other pressure readings. Choose between US customary or metric units of measure. To change the units setup: 1. Select Tools > Units Setup. The Measurement Units Setup dialog box opens.
- Page 43 Scanner Function Basic Operation and Navigation User’s Manuals This option opens a menu of additional support documentation, such as vehicle communication software manuals, available to assist in your diagnosis. These manuals provide connection information, detailed test procedures, and other resource material for specific vehicles. Figure 4-14 Sample User’s Manuals menu Select Exit to close the Help module and return to the Scanner.
-
Page 44: Scanner Operation
Scanner Function Scanner Operation 4.3 Scanner Operation The Scanner function communicates with vehicle control modules, to provide you with DTCs, parameter data (PIDs), applicable functional tests, and troubleshooting information.: Basic Scanner Operation Steps NOTE: Menus, options and procedures may vary by vehicle. 1. - Page 45 Scanner Function Scanner Operation Instant ID Instant vehicle identification is a built-in (default) Scanner feature that will save you time when identifying a vehicle, by automatically communicating with the vehicle to complete the vehicle identification process. Depending on the vehicle, Instant ID may occur automatically and only ask you to confirm the vehicle, or additional screen prompts may be displayed to enter vehicle information.
-
Page 46: Vehicle System Selection
Scanner Function Scanner Operation A confirmation page showing the identified vehicle displays once all the required data has been entered. Review the information to make sure it is correct. 4. Select OK. Alternative Vehicle Identification Occasionally, you may try to identify a test vehicle that the Scanner does not recognize, the database does not support, or has some unique characteristics that prevents it from communicating with the Scanner. - Page 47 Scanner Function Scanner Operation Code Scan Option (Systems Menu) NOTE: Depending on the vehicle, the Code Scan option may be available from the systems menu (Figure 4-17). Figure 4-17 Systems Menu - Code Scan Code Scan is used to scan all available vehicle control modules for DTC’s at once. This time saving feature displays the following information progressively as the modules are scanned.
- Page 48 Scanner Function Scanner Operation Figure 4-18 Code Scan Features 1— SureTrack Common Replaced Parts Graph 2— Code Scan Summary 3— Progressive status indicator 4— Systems Summary List (with DTC totals) 5— Individual System DTC Reports 6— SureTrack Fix It! icon...
- Page 49 Scanner Function Scanner Operation Select Print from the toolbar to print the Code Summary Report. Figure 4-19 Printed Code Summary Report Clear All Codes Read by Code Scan Selecting Clear All Codes Read by Code Scan erases all DTCs from all vehicle system modules that were read by Code Scan.
-
Page 50: Vehicle Test Selection
Scanner Function Scanner Operation 4.3.4 Vehicle Test Selection Selecting a vehicle test: 1. After a system is selected and the Scanner establishes communication with the vehicle, the Scanner Main menu displays available tests. Select a menu item to continue. Figure 4-20 Scanner Main menu Main menu options vary slightly by year, make, and model. - Page 51 Scanner Function Scanner Operation Codes Menu This selection may appear as Codes, Codes Menu, Codes Only, Codes (No Data), or something similar on the menu. Selecting opens a list of data parameter viewing options that may include: Display Codes Selecting opens either a list of diagnostic trouble codes (DTCs) stored in the selected electronic control module (ECM), or a submenu of DTC viewing options.
- Page 52 Scanner Function Scanner Operation Clear Codes The Scanner clears trouble codes from the ECM memory on some vehicles. If this function is not available on the test vehicle, Clear Codes does not appear as a menu option. To clear codes: 1.
- Page 53 Scanner Function Scanner Operation The DTC status report displays (Figure 4-23). Figure 4-23 Sample DTC status report 5. Select Exit to return to the DTC status entry screen. 6. Select Exit again to return to the Codes menu. Data Display Depending upon the test vehicle, this selection may appear as Data, Data Display, Data Only, Data (No Codes), or something similar.
- Page 54 Scanner Function Scanner Operation 1— Graph icon 2— Parameter name 3— Parameter value Figure 4-24 Sample data screen Data Graphs Select the Graph icon to open a data graph for that parameter (Figure 4-25). Selecting a parameter for graph view moves it to the top of the list. Select the Graph icon again to close the graph for that parameter and return to a data list view.
- Page 55 Scanner Function Scanner Operation The icons that display on each data graph allow you configure settings for the selected graph only: Table 4-3 Data graph icon operations Name Icon Description Select to expand the graph to fill the entire screen, Expand/Collapse select again to collapse the graph to the standard view.
- Page 56 Scanner Function Scanner Operation The area between the upper and lower trigger lines establishes the triggering condition. Any data points that register outside of the set trigger conditions initiates a snapshot. Figure 4-26 Sample Graph Properties dialog box 7. Select Snapshot on the Data Buffer Toolbar to arm the snapshot. The Snapshot icon changes color to indicate it has been armed (Figure 4-27).
- Page 57 Scanner Function Scanner Operation 8. Select OK to close the confirmation screen. 9. Select the Play icon on the toolbar to resume viewing live data. NOTE: Selecting an armed Snapshot icon disarms it. Scale Scale adjusts the upper and lower values displayed on the vertical axis of a data graph. Two scale modes are available;...
- Page 58 Scanner Function Scanner Operation Functional Tests The Functional Tests selection is used to access vehicle-specific subsystem and guided component tests. Available tests vary by manufacturer, year, and model, and only the available tests display in the menu. There are four general types of functional test operations: Information Tests—are read-only tests, like selecting “VIN”...
- Page 59 Scanner Function Scanner Operation Functional test controls allow you manipulate the test signal as shown in the table below. . Table 4-4 Functional test control icons Name Icon Description Test Activates the test. Return Moves focus back to the data list. Change List Allows you to switch data lists.
- Page 60 Scanner Function Scanner Operation Troubleshooter Fast-Track® Troubleshooter is a database of experience-based information of validated real-world repair strategies that have been compiled by top-notch technicians. Troubleshooter simplifies the diagnosis process, as it contains information on virtually all common diagnostic trouble code (DTC) problems and driveability symptoms. Troubleshooter information is organized into a series of diagnostic tips that are designed to quickly lead you to the root cause of a particular problem.
- Page 61 Scanner Function Scanner Operation Certain live data parameter values display directly within the tip when performing Troubleshooter tests and procedures. A tip may also contain a hyperlink to a Troubleshooter Reference, another test or procedure, or a supplemental operation, such as Clear Codes. Hyperlinks are shown in blue, and selecting them opens the link.
-
Page 62: Stopping Communication And Exiting The Scanner
Scanner Function Stopping Communication and Exiting the Scanner 4.4 Stopping Communication and Exiting the Scanner The Scanner remains open as long as there is an active communication link with the vehicle. You must first stop communication with the vehicle in order to exit from the Scanner function. A warning message displays if you attempt to exit from the Scanner while it is communicating with the vehicle ECM. -
Page 63: Chapter 5 Scan Module Operation
Scan Module Operation Chapter 5 This chapter describes the connection, operation, troubleshooting and updating of the Scan Module. 5.1 Overview The Scan Module is a wireless device that is connected to the vehicle and transmits vehicle data to the diagnostic tool. The Scan Module operates on 12 or 24VDC vehicle power, supplied through the vehicle’s data link connector (DLC). -
Page 64: Pairing The Scan Module
Scan Module Operation Pairing The Scan Module 5.2 Pairing The Scan Module To use the Scan Module with the Scanner or OBD-II/EOBD functions, it must first be paired with the diagnostic tool. Pairing is the wireless connection (identification) process used to connect the Scan Module to your diagnostic tool. -
Page 65: Checking Scan Module Paired Status
Scan Module Operation Checking Scan Module Paired Status NOTE: Search results include all compatible wireless devices detected, and may include multiple Scan Modules if you are in a shop environment where more than one unit is powered on. Available module listings include a partial serial number. Make sure the screen listing matches the last six digits of the serial number of your Scan Module before continuing. -
Page 66: Data Cable Connection
Scan Module Operation Data Cable Connection Figure 5-4 Typical Paired Devices screen 2. Verify the Scan Module is in the list of paired devices. 5.4 Data Cable Connection To use the Scan Module for Scanner and OBD-II/EOBD testing, it must first be connected to the vehicle’s data link connector (DLC). -
Page 67: Troubleshooting
Scan Module Operation Troubleshooting For data cable vehicle power connection information, see Vehicle Power on page 6. To connect the data cable to the vehicle: 1. While using the Scanner or OBD-II/EOBD function, follow the on-screen instructions for connecting the cable and/or any adapters required to the vehicle (Figure 5-5). -
Page 68: Checking Hardware Status
Scan Module Operation Troubleshooting 5.5.3 Checking Hardware Status Verifying the Hardware Status is always the first step in troubleshooting a wireless connection issue. The Hardware Status indicators in the lower-right corner of the Home screen provide a quick reference to wireless operations. The background color of the status indicator icon represents the condition of the wireless connectivity to that device. - Page 69 Scan Module Operation Troubleshooting 1— Vehicle Power—green LED, flashes during wireless communications 2— Communication—red LED, illuminates if there is a communications failure 3— Bluetooth—green LED, flashes during wireless communications Figure 5-6 Scan Module LEDs Each LED can be in one of three states; off, lit solid, or flashing. Interpret as follows: Vehicle Power •...
-
Page 70: Recovery Procedure
Scan Module Operation Troubleshooting 5.5.4 Recovery Procedure This is a quick and easy method that reestablishes connectivity between the diagnostic tool and the Scan Module in most instances. If bluetooth connectivity remains unavailable following recovery, use one of the alternate procedures to restart the system. NOTE: This product is intended to be used by professional technicians in a garage environment. - Page 71 Scan Module Operation Troubleshooting Figure 5-8 Scan Module USB jack, handgrip removed 3. Plug the small end of the USB cable into the USB jack on the Scan Module. 4. Plug the large end of the USB cable into a USB jack on the diagnostic tool. Scanner functionality should be restored immediately once the USB connection is complete.
-
Page 72: Updating Scan Module Firmware
Scan Module Operation Updating Scan Module Firmware 5.6 Updating Scan Module Firmware The internal programming (firmware) of the Scan Module, may require periodic updates. These firmware updates (when available) are delivered with diagnostic software updates/upgrades. Firmware updates increase the Scan Module’s diagnostic capabilities, typically by adding support for new tests, vehicles and enhanced applications to the vehicle databases. - Page 73 Scan Module Operation Updating Scan Module Firmware Figure 5-10 Sample update in progress screen A “successfully updated” message displays once the installation process is complete (Figure 5-11). Figure 5-11 Sample firmware update complete message 2. Select OK to close the message and return to Scanner operations. The updated Scan Module, is ready to use.
- Page 74 Scan Module Operation Updating Scan Module Firmware IMPORTANT: The Scan Module data cable must be disconnected from the vehicle during the update process. a. From the bottom of the Scan Module, gently lift up and out on the sides of the handgrip to free it from housing (Figure 5-12).
- Page 75 Scan Module Operation Updating Scan Module Firmware A “successfully updated” message displays once the installation process is complete (Figure 5-14). Figure 5-14 Firmware update complete message 6. Select OK to close the message and return to the Scanner function. The updated Scan Module, is ready to use.
-
Page 76: Chapter 6 Obd Direct Operations
OBD Direct Operations Chapter 6 This Home screen option allows you to access Generic OBD-II/EOBD Scanner tests without completing a vehicle identification. OBD Direct presents a quick way to check for diagnostic trouble codes (DTCs), isolate the cause of an illuminated malfunction indicator lamp (MIL), check monitor status prior to emissions certification testing, verify repairs, and perform a number of other services that are emissions-related. -
Page 77: Obd Health Check
OBD Direct Operations OBD Health Check 6.1 OBD Health Check The OBD Health Check offers a way to quickly check for and clear generic diagnostic trouble codes (DTCs) and to check readiness monitors. Selecting OBD Health Check opens a submenu of options (Figure 6-2). -
Page 78: Global Obd Ii Clear Codes
OBD Direct Operations OBD Health Check Pending Codes The purpose of this service is to enable the scan tool to obtain “pending” or maturing diagnostic trouble codes. These are codes whose setting conditions were met during the last drive cycle, but need to be met on two or more consecutive drive cycles before the DTC actually sets. -
Page 79: Mil Status
OBD Direct Operations OBD Diagnose 6.1.4 MIL Status This item is used to check the current condition of the malfunction indicator lamp (MIL). Additional information, such as which ECM commanded the MIL on and the distance driven while the MIL is on (if supported), can also be displayed. - Page 80 OBD Direct Operations OBD Diagnose 2. Select Continue. A communications message that shows how many ECMs were detected, which ECM is communicating, and which communication protocol is being used displays (Figure 6-5). Figure 6-5 Sample communication message 3. Select Continue and a menu of available tests displays (Figure 6-6).
- Page 81 OBD Direct Operations OBD Diagnose Readiness Monitors Use this menu item to check the status of the monitored system. If a monitored system is not supported, it is not displayed. Scroll, if needed, to view the entire list of monitors. Selecting Readiness Monitors opens a submenu with two choices: Monitors Complete Since DTC Cleared—displays the results of all monitor tests that have •...
- Page 82 OBD Direct Operations OBD Diagnose ($04) Clear Emissions Related Data This item is used to clear all emission related diagnostic data such as, DTCs, freeze frame data, and test results from the memory of the selected ECM. ($05, 06, 07) Display Test param./Results This option opens a submenu of test parameters and test results from various sensors, monitor test results, and a record of DTCs detected during the last drive cycle.
-
Page 83: Connector Information
OBD Direct Operations OBD Diagnose 6.2.2 Connector Information This option opens a database of vehicle diagnostic connector locations that includes most makes and models. To locate a vehicle diagnostic connector: 1. Select Connector Information from the System menu. 2. Select a manufacturer from the list presented. 3. -
Page 84: Chapter 7 Guided Component Test Operations
Guided Component Test Chapter 7 Operations The Guided Component Test software is a component-testing powerhouse, providing you with a robust diagnostic database for use with scopes and meters. It is like having access to a complete library of shop manuals for testing engine-management components, transmission sensors and components, and ABS systems. -
Page 85: Menu Options, Guided Component Test
Features Benefits • How To • Power User Tests • Snap-on Automotive Theory • Features Benefits Selecting Features Benefits opens a menu page that includes: 5-Minute Walk Thru With Demo Board—explains how to use the optional demonstration • board to generate sample signals. - Page 86 Theory And Operation—provides basic theory and operation information for related • components. Snap-on Automotive Theory Selecting the Snap-on Automotive Theory option provides you basic operation, theory and testing information on various systems such as: Air Conditioning • Diesel Particulate Filters •...
-
Page 87: Creating A Favorites List
Guided Component Test Operations Vehicle Identification 7.1.2 Creating a Favorites List Once a Guided Component Test database is loaded, a list of manufacturers displays. This list is often long and includes makes that are not frequently used. A toolbar at the top of the screen allows you to custom configure the manufacturer list to display only the makes you frequently service. -
Page 88: Identifying A Test Vehicle
Guided Component Test Operations Vehicle Identification NOTE: Manufacturers appear on the favorites list in the order in which they are selected. Therefore, if you select the makes you work on most frequently first, they will appear at the top of the list. 3. - Page 89 Guided Component Test Operations Vehicle Identification A list of tests available for the identified vehicle displays (Figure 7-4). Figure 7-4 Sample available tests list 8. Select FUEL INJECTION and a fuel injection component test menu displays (Figure 7-5). Figure 7-5 Sample available component tests list 9.
-
Page 90: Operations
Guided Component Test Operations Operations 7.2 Operations The Guided Component Test software provides vehicle specific Guided Component Test procedures and information that aid in setting up scopes and meters. Once a test vehicle is identified, you can select a Guided Component Test from the list of available tests. For most selections two main choices are available on the component menu: 1. -
Page 91: Tests
Guided Component Test Operations Operations NOTE: An additional selection, such as front or rear for an oxygen sensor (O2S), may be required before advancing to the component information screen. The component information screen displays (Figure 7-6). Always Gesture sweep to view any additional information below what is visible. 4. - Page 92 Guided Component Test Operations Operations 3. Select a test option and the test screen displays (Figure 7-8). Figure 7-8 Sample Test screen 4. Gesture sweep to view any additional information. 5. Select Back at any time to return to the previous screen, or select Exit to return to the main component menu.
- Page 93 Guided Component Test Operations Operations View Meter A Meter icon, which is only available in the Guided Component Test view meter mode, appears on the upper toolbar (Figure 7-9). Figure 7-9 Sample view meter window Three view meter options are available: 1.
- Page 94 Guided Component Test Operations Operations Selecting the Close icon (red box with an X) when viewing the meter in a separate window closes the meter and returns you to the Guided Component Test screen. 3. Select the Meter icon a third time to close the separate window and return to the standard meter view as shown in Figure 7-9.
-
Page 95: Chapter 8 M2 Scope/Meter
8.1 Overview The M2 Scope/Meter is a digital graphing multimeter and wireless communications device. The unit can be used as a stand-alone meter, or configured to transmit data to the VERDICT D7 Diagnostic Tool without a physical connection. The M2 Scope/Meter is powered by it’s internal battery pack, or can be powered using the supplied AC/DC power supply. -
Page 96: M2 Scope/Meter Controls, And Features
1— Soft Keys—select test functions, which vary depending upon the Rotary Switch position 2— Rotary Switch—establishes the primary operation of the unit Figure 8-2 VERDICT M2 controls The following sections describe the external controls and features of the M2 Scope/Meter. -
Page 97: Rotary Selector Switch
M2 Scope/Meter M2 Scope/Meter Controls, and Features 8.2.1 Rotary Selector Switch The M2 Scope/Meter is a combination digital-multimeter (DMM) and waveform viewer, capable of reading volts (AC and DC), resistance (ohms), capacitance (farads), continuity, diode forward voltages, and external auxiliary probes, as well as viewing dynamic voltage graphs (waveforms). The Rotary Selector Switch on the front panel determines which measurements are taken. -
Page 98: M2 Scope/Meter Soft Keys
M2 Scope/Meter M2 Scope/Meter Controls, and Features 8.2.2 M2 Scope/Meter Soft Keys The eight soft keys located above the rotary dial on the M2 Scope/Meter are used to initiate a variety of additional functions while performing meter tests. The functionality of the soft keys varies according to what type of tests are being performed, as determined by the position of the rotary switch. -
Page 99: M2 Scope/Meter Operations
M2 Scope/Meter M2 Scope/Meter Operations 8.3 M2 Scope/Meter Operations This section details the digital multi-meter (DMM) features available based on the Rotary Selector Switch position. 8.3.1 Volts DC The Volts DC setting is used for measuring direct current (DC) voltages within a range of zero to 1000 volts, frequency, duty cycle, and pulse width. - Page 100 M2 Scope/Meter M2 Scope/Meter Operations F1 Key, Relative The lower numbers shown in Figure 8-4 do not display when you first select the Volts DC function. The DMM takes a “snapshot” of the current reading and holds it on the display when the F1 key is momentarily pressed.
- Page 101 M2 Scope/Meter M2 Scope/Meter Operations F2 Key, Freeze A press of the F2 key freezes, or so that the displayed value remains static. A second press of the F2 key returns to unit to normal operation. This function is available in normal and relative modes. F3 Key and Range Key Pressing the F3 and Range keys changes the measuring range.
- Page 102 M2 Scope/Meter M2 Scope/Meter Operations NOTE: Press and hold the S key at any time to instantly return the display to a voltage reading. In this special time measurement mode, the readings shown on the screen are integrated, or filtered. This means that the displayed values show average time-based measurements with great accuracy, but do not capture fast signal anomalies such as instantaneous “glitches”...
-
Page 103: Volts Ac
M2 Scope/Meter M2 Scope/Meter Operations Graphing Time-Based Measurement Screens To access time-based measurement graphs: 1. Press the Graph key. 2. Press the S key. The M2 Scope/Meter is now in time-based measurement mode. In this mode, the M2 Scope/Meter uses a specialized strategy called “cycle-by-cycle” (C-B-C) time-based measurements to capture signal glitches. - Page 104 M2 Scope/Meter M2 Scope/Meter Operations F1 Key The F1 key switches between normal and relative readings. A short push of the key resets the reading, a long push opens the alternate menu. F2 Key A single press of the F2 key pauses, or freezes, the displayed voltage. A second press returns the display to normal mode.
-
Page 105: Resistance
M2 Scope/Meter M2 Scope/Meter Operations 8.3.3 Resistance This setting allows you to measures the DC resistance to current in Ohms. When sampling resistance the soft keys function much the same as for DC or AC voltage. Brief explanations are provided below, refer to Volts DC on page 91 for more detailed descriptions. -
Page 106: Continuity And Diode Check
M2 Scope/Meter M2 Scope/Meter Operations 8.3.4 Continuity and Diode Check This setting allows you to perform circuit continuity tests, and perform a forward drop test to check the operation of a diode. Figure 8-9 Continuity and diode check selected The S key is the only soft key that is operational in continuity and diode mode. Pressing the S key switches between the continuity test and diode test settings. - Page 107 M2 Scope/Meter M2 Scope/Meter Operations Brief explanations of the soft key functions are provided below, refer to Volts DC on page 91 for more detailed descriptions. F1 Key The F1 key switches between normal and relative readings. A short push of the key resets the reading, a long push opens the alternate menu.
-
Page 108: Capacitance
M2 Scope/Meter M2 Scope/Meter Operations 8.3.6 Capacitance This selection is used to measure capacitance. Figure 8-11 Sample capacitance selected F1 Key Relative readings are not available in this mode. A short push of the F1 key does cause a beep to sound, but the display remains unchanged. -
Page 109: Oscilloscope
M2 Scope/Meter M2 Scope/Meter Operations 8.3.7 Oscilloscope The M2 Scope/Meter has the ability to provide a two-channel oscilloscope, or waveform viewer. The viewer becomes active when the rotary switch is turned to the “scope” position. Figure 8-12 Sample oscilloscope rotary switch icon Figure 8-13 Sample scope setting Soft key functions are unique when performing oscilloscope tests. - Page 110 M2 Scope/Meter M2 Scope/Meter Operations Display Selections With the scope in the display mode the soft keys perform the following functions: F2—the first press pauses data collection to allow closer examination of the waveform, the • second press restores data collection. F3 and Range—each press of the F3 key advances up to the next available scale, which is •...
- Page 111 M2 Scope/Meter M2 Scope/Meter Operations Trigger Selections Triggering allows you to set the scope so that it begins sampling and displaying a trace once predetermined signal conditions, or triggers, are met. Triggering produces a much more stable waveform. The trace always begins at the trigger point, so the image does not appear to flicker or drift as it updates.
- Page 112 M2 Scope/Meter M2 Scope/Meter Operations Preset Selections These options allow you to select from already configured scope setups for commonly tested items. Six preset configurations are available; three for Preset A and three for Preset B. These preset conditions are permanent and cannot be erased or modified. However, you can construct and store additional presets within the D7 Diagnostic Tool as explained in the Scope and Multimeter chapter of this manual.
- Page 113 M2 Scope/Meter M2 Scope/Meter Operations Selection Position Timebase Scale Trigger Coupling Slope F2 (PCI&S) 10 mS 50 Volts 8 Volt Positive Preset B F3 (LF DS) 50 mS 20 Volts 3 Volt Positive F4 (HFDS) 10 mS 20 Volts 3 Volt Positive Special Selections The Special settings allow you to alter the way the trace is displayed in order to readily spot signal...
- Page 114 M2 Scope/Meter M2 Scope/Meter Operations Position Selections The Position selections allow you to reposition the baselines of the channel 1 and channel 2 traces vertically on the screen. Figure 8-18 Sample screen with both traces repositioned Channel 1 Trace Use the F2 and Min/Max keys to reposition the channel 1 trace as follows: Short pushes of the F2 key moves the trace incrementally up.
-
Page 115: M2 Scope/Meter Remote Operation
M2 Scope/Meter M2 Scope/Meter Remote Operation Channel Selections The channel selection mode allows you to switch the trace on and off. The F2 key controls the channel 1 trace and the F3 key controls the channel 2 trace. Pressing the key the first time turns this channel “off”... -
Page 116: Pairing The M2 Scope/Meter
M2 Scope/Meter M2 Scope/Meter Remote Operation Figure 8-20 Remote Functions setting 8.4.2 Pairing the M2 Scope/Meter Pairing is the wireless connection (identification) process used to connect the M2 Scope/Meter to your Diagnostic Tool. The M2 Scope/Meter needs to be paired (connected) to the Diagnostic Tool for remote operation. - Page 117 8. From the Paired Devices menu select Add from the toolbar. 9. When prompted select OK from the toolbar. The Diagnostic Tool searches for compatible wireless devices, then displays the results. The M2 Scope/Meter is typically listed as “VERDICT M2-” plus six digits of the unit’s serial number.
- Page 118 M2 Scope/Meter M2 Scope/Meter Remote Operation 10. Select the M2 Scope/Meter from the search results list (Figure 8-23). Figure 8-23 Typical Device selection A “in progress” message displays during the pairing procedure, which takes several seconds. The Paired Devices screen displays once the procedure completes (Figure 8-24).
-
Page 119: Remote Operation (Once Paired)
M2 Scope/Meter M2 Scope/Meter Remote Operation Once the M2 Scope/Meter is initially paired with the Diagnostic Tool, additional pairing is not necessary. Although the discovery mode has been disabled, the two-paired devices automatically seek and find each other when they are both powered on. The M2 Scope/Meter becomes “invisible”... - Page 120 M2 Scope/Meter M2 Scope/Meter Remote Operation Figure 8-26 Remote functions setting When the M2 Scope/Meter is connected to the Diagnostic Tool, all soft key controls on the M2 Scope/Meter are inoperative, as all controls of the M2 Scope/Meter are transferred to the Diagnostic Tool.
- Page 121 M2 Scope/Meter M2 Scope/Meter Remote Operation Remote Working Range / Communication Screens When the M2 Scope/Meter Rotary Switch is positioned in the Remote Functions position and the Diagnostic Tool is turned on, a communication indicator screen is displayed. One of two screens are used to indicate the current communication status of the M2 Scope/Meter: The working range of the transmitter is about 30 feet (9.14 m).
-
Page 122: Chapter 9 Scope Multimeter Operations
40 volts DC or 24 volts AC. • Use only appropriate (Category III or IV) Snap-on components, such as test leads, scope leads and auxiliary components with meter and scope products. Do not use aftermarket “equivalents”... -
Page 123: Getting Started
Scope Multimeter Operations Getting Started 9.1 Getting Started The Scope and Multimeter module enables the VERDICT to function as a digital multimeter (DMM), a graphing multimeter, and a 2-channel oscilloscope when the Diagnostic Tool is wirelessly linked to the M2 Scope/Meter. -
Page 124: Leads And Adapters
The Scope Multimeter uses standard safety banana plugs that are compatible with many accessories. The various leads, clips, and adapters that are supplied with or available for the VERDICT M2 unit explained in this section. IMPORTANT: When removing leads from their sockets, do not pull on the wire because it can damage the leads. - Page 125 Scope Multimeter Operations Getting Started Figure 9-1 Red Channel 1 Lead Channel 2 Lead The shielded green lead (Figure 9-2) with an integrated probe is used for Channel 2. The lead color matches the color of socket 2 on the Scope Multimeter and the color of trace 2 on the test screens.
- Page 126 Scope Multimeter Operations Getting Started Secondary Coil Adapter Lead (optional) The optional Secondary Coil Adapter lead (Figure 9-5) connects to the clip-on secondary wire adapter, coil-in-cap adapter or coil-on-plug adapter to display secondary waveforms. Figure 9-5 Secondary Coil Adapter lead Secondary Ignition Clip-on Wire Adapter (optional) The optional Secondary Ignition Clip-on Wire Adapter (Figure...
-
Page 127: Menu Options, Scope Multimeter
Scope Multimeter Operations Getting Started 9.1.3 Menu Options, Scope Multimeter The Menu icon on the Toolbar at the base of the screen opens a menu with the following options: Safety Information—opens the Important Safety Instructions document. • File—allows you to print or save the data or meter setup being viewed. •... -
Page 128: Navigation
Scope Multimeter Operations Navigation 9.2 Navigation The following section describes how to navigate the screen interface when viewing on the Diagnostic Tool. When using the M2 Scope/Meter as a stand-alone test meter refer to M2 Scope/ Meter Controls, and Features on page 88 for navigation instructions. - Page 129 Scope Multimeter Operations Navigation Scope Multimeter Toolbar The Scope Multimeter toolbar is used to set up the tool for testing and to configure the settings for each trace. The table below gives brief descriptions of the control icons on the toolbar. Table 9-3 Scope Multimeter toolbar icons Name Icon...
- Page 130 Scope Multimeter Operations Navigation Trace Details The Trace Details section displayed at the base of the screen can be used to quickly adjust settings for capturing the trace. The Trace details are accessed using either the Data icon on the upper toolbar or the Touch and Grow icon (fingerprint) icon on the Playback toolbar.
- Page 131 Scope Multimeter Operations Navigation The following trace adjustments and settings are available: Profile—switches the trace for the selected channel on and off. • Channel—opens a dialog box that allows you to configure the trace setup (see Trace Controls • on page 128 for details). Probe—opens a dialog box that allows you to select the type of test probe being used.
- Page 132 Scope Multimeter Operations Navigation Record/Playback Control Toolbar The record/playback control toolbar at the base of the screen is used for recording data and for reviewing paused data. Use the stylus or your finger tip to activate the icons. A position counter in the toolbar displays a numerical value of where the current screen is in relation to the entire recorded file.
-
Page 133: Making Selections
Use the following procedure to set up the scope multimeter for performing tests. To start the scope multimeter: 1. Select the Scope Multimeter icon on the VERDICT Home screen. The Scope Multimeter main menu, a list of setup options, displays;... - Page 134 Scope Multimeter Operations Operations Lab Scope Options The following options are available for testing: 2 Channel Lab Scope • Volts DC • Low Amps (20) • Low Amps (40) • Low Amps (60) • Ignition Probe • 100 PSI Vacuum •...
-
Page 135: Measurement Out Of Range
Scope Multimeter Operations Operations Digital Multimeter Options The following options are available for testing: Volts DC • Volts AC RMS • Ohms • Diode/Continuity • Capacitance • Low Amps (20) • Low Amps (40) • Low Amps (60) • Presets Presets are factory configured meter settings for common component tests. -
Page 136: Scope And Multimeter Setup
Scope Multimeter Operations Operations 9.3.3 Scope and Multimeter Setup The following sections explain how to adjust the scope and multimeter for the specific type of signal being sampled. Most of these setup operations are available from the toolbar. Trace Controls The Traces controls are used to adjust individual characteristics of how the signal is sampled and displayed for each trace. - Page 137 Scope Multimeter Operations Operations 4. Select the Trace Probe icon to open the menu. 5. Highlight a probe on the list and select OK to close the window. 6. Select the Trace Scale icon to adjust the vertical scale, of the display. A dropdown menu opens, menu options vary depending upon which test lead is selected.
- Page 138 VERDICT buffers data in order to capture rapidly occurring signal glitches. The trigger point is indicated by a plus sign (+) on the scope grid. The plus sign can be dragged across the grid with your finger or the stylus to roughly position it.
- Page 139 Scope Multimeter Operations Operations To adjust trigger controls: 1. Select Setup from the Scope Multimeter toolbar. The Scope Multimeter Preferences dialog box opens 2. Select Trigger to open the Trigger Setup dialog box (Figure 9-13). 3. Use the dialog box controls to establish the position for triggering. 4.
- Page 140 Scope Multimeter Operations Operations View Controls Use the view controls to set display attributes. To adjust view controls: 1. Select Setup from the Scope Multimeter toolbar. The Scope Multimeter Preferences dialog box opens. 2. Select View to open a submenu. 3.
- Page 141 Scope Multimeter Operations Operations Layout Settings The selected radio knob on the Layout dialog box shows which setting is active: 1 window—shows all traces on the same screen. • 2 windows—shows two separate horizontal traces, one below the other. • 2 windows—shows two separate vertical traces, side-by-side.
- Page 142 Scope Multimeter Operations Operations Unit Setup The units of measurement can be changed between US standard or metric units of measure for pressure and vacuum readings. Selecting Units opens the Setup dialog box (Figure 9-16). Figure 9-16 Sample Setup Units dialog box Snapshot The Snapshot tab of the Setup dialog box opens a window that allows you to select how much data is captured after a snapshot is triggered...
- Page 143 Selecting Print from the toolbar opens a standard Windows Print dialog box set up to print the current screen. A printer must be connected and setup on the VERDICT Diagnostic Tool. If not, the “Add Printer Wizard” opens and guides you through the procedure. Select from the menus as...
-
Page 144: Chapter 10: Repair Information
Repair Information Chapter 10 The Repair Information icon (Figure 10-1) can be used to: ® ® Access the SureTrack Community within ShopKey Pro that is included with current • diagnostic tool software, see SureTrack on page 176 for additional information. ®... - Page 145 ShopKey Pro Vintage—ShopKey Pro Vintage includes an extensive library of engine and • chassis repair information, along with wiring diagrams, and other information for vehicles back to 1960. ® Contact your Snap-on representative to learn more about ShopKey Pro or visit the following web pages: Snap-on Diagnostics ShopKeyPro Page •...
-
Page 146: Chapter 11 Vehicle History Operations
Vehicle History Operations Chapter 11 Vehicle History allows you to manage and retrieve vehicle records, for vehicles that have been scanned or identified previously. You can also activate a vehicle, so there is no need to go through the complete vehicle identification sequence when performing a retest after repairs have been made. -
Page 147: Vehicle History Toolbar
Vehicle History Operations Screen Layout To resize a column: 1. Select the line separating two columns. A line with arrowheads appears to show the column is ready for resizing. 2. Drag the line left or right to increase or decrease the column width. 11.1.2 Vehicle History Toolbar The table below gives brief descriptions of the control icons on the toolbar: Table 11-1 Toolbar icons... - Page 148 Vehicle History Operations Screen Layout View Select View to open, edit, add notes, and print a vehicle record. To open and/or modify a vehicle record: 1. Highlight the desired vehicle record from the vehicle records list screen, then double click it, or select View from the toolbar.
- Page 149 Vehicle History Operations Screen Layout Manage Select Manage to quickly remove individual records, or all the vehicle records from the vehicle records list. Highlight the record to remove, then select Delete, or use the Select All or Deselect All options to remove all records (Figure 11-3).
- Page 150 Vehicle History Operations Screen Layout Figure 11-4 Sample Search dialog box 3. Select Search twice. The first tap closes the keyboard, the second tap starts the search. The display returns to the vehicle records list screen with only the records found in the search criteria showing.
- Page 151 Vehicle History Operations Screen Layout 2. Select or deselect the desired categories: Highlighted items - do not display – Non-highlighted items - display – 3. Select OK on the toolbar to accept the changes, and return to the previous screen.
-
Page 152: Chapter 12: Data Manager Operations
Data Manager Operations Chapter 12 The Data Manager is used to store, sort, and review saved files. Most operations are controlled through the toolbar. 12.1 Screen Layout Select Data Manager on the Module toolbar to open the file system. Use the toolbar at the top of the screen to navigate through the data. -
Page 153: Navigation
Data Manager Operations Navigation Scope Multimeter Data Folder—contains files saved while working with the Scope Multimeter. • Scope Viewer on page 167. Screenshots—contains images saved by pressing the Shortcut (S) button. See Image Viewer • on page 168. 12.2 Navigation Use the toolbar icons as shown in the table below to navigate through the Data Manager: Table 12-1 Data Manager toolbar icons Name... -
Page 154: Operations
Data Manager Operations Operations 12.3 Operations Data Manager operations based on toolbar selections are explained in the following sections. 12.3.1 My Data The My Data icon is a shortcut that quickly returns you to the main Data Manager screen. Select the icon at any time to instantly return. -
Page 155: New
Data Manager Operations Operations The screen advances and the contents of the open folder are shown in the folders panel. Highlight an item in the folders panel and the information or preview displays, if available, in the lower portion of the screen (Figure 12-2). -
Page 156: Delete
Data Manager Operations Operations 12.3.5 Delete The Delete icon moves folders or items within folders to the Recycling bin. A confirmation displays when a file is selected for deletion. Select Yes to delete the file or Cancel to exit. To delete an item: 1. -
Page 157: Rename
Data Manager Operations Operations 12.3.6 Rename The Rename icon allows you to change the name of a folder or items within a folder. To rename an item: 1. Highlight the item or folder to be renamed. 2. Select the Rename icon on the toolbar. The New Name dialog box opens (Figure 12-3). -
Page 158: Properties
Data Manager Operations Operations 12.3.7 Properties The Properties icon function allows you to change the name and assign identifying attributes to saved Scope Multimeter files. Operation is similar to renaming a file as discussed above, except there are additional fields for entering descriptive information. To assign properties to an item: 1. -
Page 159: Email
Data Manager Operations Operations 12.3.9 Email Selecting the Email icon from the Data Manager toolbar allows you to send a saved data or image file as an attachment using e-mail. To use this feature, you must install an e-mail client, and then either link your existing e-mail address to the client, or create a new address. - Page 160 Data Manager Operations Operations attachment Figure 12-8 4. Enter the e-mail address of the recipient, and any other information needed. 5. Select the Send icon to send the e-mail. NOTE: You must have an Internet connection to send e-mail. E-mail client installation and setup (Example): The following instructions are intended as a guide only, as e-mail client setup procedures vary.
- Page 161 Data Manager Operations Operations 2. Install the software following the screen prompts (Figure 12-10). Figure 12-10 3. Continue through the setup. If available choose “set as my default mail application” (Figure 12-11). Figure 12-11...
- Page 162 Data Manager Operations Operations 4. Choose to use your existing email address, or create a new email address with the email client (Figure 12-12). Figure 12-12 5. Enter your e-mail information as required (Figure 12-13). NOTE: E-mail client configuration settings should automatically be set during installation. If problems arise with the setup and manual configuration is needed, refer to the e-mail client help information and the Windows help information.
- Page 163 Data Manager Operations Operations 6. If your existing email provider login screen displays, enter your email address and password to allow the client to continue the setup with your provider (Figure 12-14). Figure 12-14 7. Follow the screen prompts to allow the client to link to your email address. 8.
-
Page 164: Viewing Saved Files
Data Manager Operations Viewing Saved Files 12.4 Viewing Saved Files As mentioned in the beginning of this section, the data and image files in the Data Manager folders are also accessible from the Windows My Documents > ShopStream folder. You may access, copy or move the files you save in the ShopStream Diagnostic Suite program from the folder at anytime. -
Page 165: Scanner Dataviewer Operation
Data Manager Operations Scanner DataViewer Operation 12.6 Scanner DataViewer Operation The Scanner DataViewer allows you to review saved scanner data files (Figure 12-17). To open saved Scanner data files, select the Scanner Data Folder menu option from the Data Manager main menu. -
Page 166: Menu Bar
Data Manager Operations Scanner DataViewer Operation 12.6.1 Menu Bar The menu bar at the top of the screen contains the File, View, Tools, and Help menus. File Menu The File menu offers the following selections: Load—locate and open data files, launches a navigation window •... - Page 167 Data Manager Operations Scanner DataViewer Operation Figure 12-19 Print preview window (text list and graphs examples) View Menu The View menu allows you to change how data is displayed on the screen (Figure 12-20). Figure 12-20 Scanner DataViewer View menu Select from the following menu options: Text Only—shows all parameters and their values as text only •...
- Page 168 Data Manager Operations Scanner DataViewer Operation Tools Menu The Tools menu opens the Properties dialog box. The Properties dialog box has two sections (Figure 12-21); Shared Graph Properties and Individual Properties. Shared Graph Properties apply to all graphs and Individual Properties apply to the selected graph only.
-
Page 169: Display Toolbar
Data Manager Operations Scanner DataViewer Operation Help Menu The Help menu provides Scanner Viewer software version information. 12.6.2 Display Toolbar The Display toolbar provides the following controls (Figure 12-22). Exit—closes Scanner DataViewer. • Hide PID List—toggles display between parameter text and graph views. •... -
Page 170: Navigation Tools
Data Manager Operations Scanner DataViewer Operation 12.6.3 Navigation Tools Playback Controls The playback controls allow you to navigate through saved data (Figure 12-23). 1— Skip Back—Allows backward movement in multiple steps. 2— Step Back—Allows backward movement in singular steps. 3— Play—Select to play. 4—... - Page 171 Data Manager Operations Scanner DataViewer Operation Slider / Scroll Bars and Cursor Use the slider bar to quickly navigate through the data (Figure 12-25). During playback the number displayed on the left side of the slider bar indicates the current position of the cursor in the data file.
-
Page 172: Customizing The Display
Data Manager Operations Scanner DataViewer Operation 12.6.4 Customizing the Display The parameter text list (left side) displays parameter names and current values. The display can be customized by selecting and dragging parameters from the text list or graph display to a different location in the text list or in the graph display (Figure 12-26). -
Page 173: Customizing The Parameter List
Data Manager Operations Scanner DataViewer Operation 12.6.5 Customizing the Parameter List 1. The parameter configuration tabs allow you to choose between displaying all available parameters (Complete List), or only those from a (Custom List) (Figure 12-27). To customize the parameter list: 1. - Page 174 Data Manager Operations Scanner DataViewer Operation A list of available parameters displays (Figure 12-28). 3. Select the parameters to include in your custom list. Select All and Deselect All controls are also available to assist in the selection process. Figure 12-28 Creating a custom parameter list 4.
-
Page 175: Scope Viewer
Data Manager Operations Scope Viewer 12.7 Scope Viewer This section is intended as an introduction of the Scope Viewer, as many features are similar to the Scope module features. The Scope Viewer allows you to print and playback recorded trace signals captured on your diagnostic tool. -
Page 176: Image Viewer
Data Manager Operations Image Viewer 12.8 Image Viewer The Image Viewer allows you to open and view image files and screenshots. Figure 12-30 1— Exit - closes the Image Viewer 2— Print - prints the image 3— Captured Screen Image... -
Page 177: Chapter 13 Help Operations
Help Operations Chapter 13 Selecting Help from the Home screen opens this manual in a dedicated screen viewer. Navigate through the file either by gesture scrolling on the touch screen, or with the scroll bar along the right edge of the viewing screen. A left-to-right scroll bar appears at the bottom of the screen when magnification is increased. -
Page 178: Chapter 14 System Settings Operations
System Settings Operations Chapter 14 Selecting System Settings from the Home screen opens a menu with two options: Paired Devices - Paired Devices allows you to check the status and pair wireless devices to • the Diagnostic Tool. Shop Information - Shop Information allows you to create and edit a personalized header that •... -
Page 179: Scan Module Pairing
System Settings Operations Paired Devices The Hardware Status indicators in the lower-right corner of the Home screen provide a quick reference to wireless device operations. The background color of the status indicator icon represents the condition of the wireless connectivity to that device. Icon status is shown in the table below: Hardware Background... -
Page 180: Shop Information
System Settings Operations Shop Information 14.2 Shop Information This option allows you to add personalized shop information that can be included on printed data files. Selecting opens a form that can be filled in using the virtual keyboard. Select OK when the form is complete and the information is saved. - Page 181 System Settings Operations Shop Information Figure 14-3 Virtual keyboard Top and Bottom icons 5. Close the virtual keyboard and review the information once all the fields have been filled in. 6. Select OK from the toolbar to save the Shop Information, or Cancel to close the Shop Information dialog box without saving.
-
Page 182: Data Backup
System Settings Operations Data Backup 14.3 Data Backup Selecting Data Backup from the Systems Settings main menu provides two options, backup and restore. 14.3.1 Backup The Backup option allows you to back up your saved data to a file on the internal hard drive, or to an external drive (e.g. -
Page 183: Restore
System Settings Operations Data Backup 14.3.2 Restore The Restore option is used to restore your backed up data, in the event that the data is lost or if a system restore (recovery) has been performed. This function is only applicable when a backup file has been previously saved (file extension .sna). "Backup‚"... -
Page 184: Chapter 15 Suretrack
SureTrack Chapter 15 Designed to help you improve diagnostic accuracy and reduce repair time, SureTrack is a comprehensive source of expert knowledge for professional technicians, combining diagnostic experience and detailed parts replacement records. Your access to SureTrack includes: A Common Replaced Parts (CRP) graph, showing which parts are most frequently replaced •... -
Page 185: Using Suretrack In The Scanner Function
SureTrack Using SureTrack in the Scanner Function 15.2 Using SureTrack in the Scanner Function To access SureTrack information from within the Scanner function you must: Have a Wi-Fi Internet connection • Have the current software version installed on the diagnostic tool •... -
Page 186: Dashboard Feature Information
SureTrack Using SureTrack in the Scanner Function 15.2.2 Dashboard Feature Information Dashboard Feature Information includes: Detailed DTC Information • Related Tips, Real Fixes and Repair Information • SureTrack will display detailed information about the current DTC describing code setting conditions, possible symptoms, system operation and possible solutions (Figure 15-2). -
Page 187: Suretrack Status Messages
- indicates your access to SureTrack will be expiring soon and you should contact your sales representative to purchase the current software upgrade. Your SureTrack access has expired. See your Snap-on representative to renew. - • indicates your access to SureTrack has expired and you should contact your sales representative to purchase the current software upgrade. -
Page 188: Using The Suretrack Community
SureTrack Using the SureTrack Community (within ShopKey Pro) 15.3 Using the SureTrack Community (within ShopKey Pro) The SureTrack Community includes access to the following features on the ShopKey Pro website: 1Search™ Limited - SureTrack Real Fixes, Related Tips, Common Replaced Parts, and –... - Page 189 SureTrack Using the SureTrack Community (within ShopKey Pro) Enter all required information. Choose 3 security questions. See “Finding your SureTrack Authorization Code” on the next page. Find the SureTrack Authorization Code on your sales receipt. 12 digit alpha-numeric code (e.g. 123ABCAP4-US) Figure 15-6...
- Page 190 Figure 15-7 Finding your SureTrack Authorization Code When you purchase a software upgrade, or qualifying platform from your from your Snap-on Representative, you will receive a SureTrack authorization code. The authorization code is printed on your sales receipt. Authorization codes are 12 digit alpha-numeric codes (e.g.
-
Page 191: Logging In (Existing Active Account)
SureTrack Using the SureTrack Community (within ShopKey Pro) Each time you purchase an a diagnostics software upgrade you will be provided a new SureTrack authorization code. The authorization code will expire shortly after the release of the next concurrent software upgrade. To log in with a new authorization code, see Logging In (existing expired account) on page 184. -
Page 192: Logging In (Existing Expired Account)
(Figure 15-10). To purchase software upgrades, or join the software subscription program, see your Snap-on Representative. Selecting OK will close the message box until the beginning of the next month when it will appear to remind you again. Selecting Snooze 1 Week will close the message box for approximately one week and then it will re-appear. -
Page 193: Chapter 16 Shopstream Update Tool (Sst)
The following terms are used in this section and throughout this manual as described below: Software Upgrade - a new diagnostic software version. Software upgrades include new and • enhanced coverage and features for subscribed Snap-on diagnostic tools. Software Update - a service release “update” for a existing diagnostic software version •... - Page 194 ShopStream Update Tool (SST) Basic Operation Figure 16-1 SST Icon in system tray Selecting the SST icon from the system tray provides the following menu choices: Check for Updates - Allows you to manually check for software updates anytime. See •...
-
Page 195: Manual Software Download
ShopStream Update Tool (SST) Manual Software Download 16.2 Manual Software Download This section describes the basic procedures for manually downloading software updates and upgrades. Normally, the SST will automatically detect and download software. If necessary, use the following procedure to manually check for and download software. NOTE: Software Subscription Customers Only - It is recommend that you download software upgrades when not actively using the diagnostic tool. - Page 196 ShopStream Update Tool (SST) Manual Software Download 2. Select Check for Updates from the menu. A series of message boxes will display as the SST searches for updates (Figure 16-4). Figure 16-4 Typical - Checking for Updates message Once the search is complete, one of two results are expected: If no updates are found, the message box closes and a “No updates available”...
-
Page 197: Installing Software Updates
ShopStream Update Tool (SST) Installing Software Updates Cancel—stops and cancels the download and closes the message box. If you select – Cancel, and choose to re-start the download again, the download will start from the beginning. 4. Once the download completes, it must be installed. See the applicable instructions for Installing Software Updates on page 189 or Installing Software Upgrades... - Page 198 ShopStream Update Tool (SST) Installing Software Updates Figure 16-7 Typical update installation window 2. Select an installation option to continue: Install Now—starts the software update installation. Proceed to step 3. – Install Later—closes the message. The message will reappear at a later time as a –...
-
Page 199: Installing Software Upgrades
The installation will take approximately 30 minutes. If the installation is interrupted, Contact Snap-on Diagnostics Customer Care for assistance. See the Snap-on contact information at the front of this manual. NOTE: If applicable, before installing a software upgrade, have your Scan Module and USB cable available. - Page 200 ShopStream Update Tool (SST) Installing Software Upgrades 2. Select an installation option to continue: Upgrade Detail—opens a PDF file describing the details of the software upgrade, – including any accessories that may be required. Install Now—starts the software upgrade installation. Proceed to step 3. –...
-
Page 201: Chapter 17 Maintenance
Maintenance Chapter 17 This section covers how to care for your Diagnostic Tool components. 17.1 Diagnostic Tool This section covers how to care for your Diagnostic Tool. 17.1.1 Cleaning the Touch Screen The touch screen can be cleaned with a soft cloth and alcohol or a mild window cleaner. IMPORTANT: Do not use any abrasive cleansers or automotive chemicals on the touch screen. - Page 202 Maintenance Diagnostic Tool Figure 17-2 Selecting a calibration option Automatic—uses 5 points on the screen to quickly bring the unit into calibration. You can – use your finger to calibrate the screen. Advanced—uses 9, 16, or 25 points on the screen to accurately bring the unit into –...
- Page 203 Maintenance Diagnostic Tool Extended Desktop Touch Screen Calibration Special consideration must be given to calibrating the touch screen when the Extended Desktop feature of the Diagnostic Tool is used with an external monitor and the optional docking cradle. If the standard calibration method does not restore touch screen accuracy to a Diagnostic Tool with extended desktop, use one of the procedures that follow.
-
Page 204: Cleaning And Inspecting The Diagnostic Tool
When using the VERDICT Diagnostic Tool, make sure to do the following: Check the housing, wiring, and connectors for dirt and damage before and after each use. • At the end of each work day, wipe the VERDICT Diagnostic Tool housing, wiring, and • connectors clean with a damp cloth. -
Page 205: Battery Service
Keep the following in mind when using and handling the VERDICT battery pack: Do not short circuit battery pack terminals. • Do not immerse the VERDICT Diagnostic Tool or battery pack in water, or allow water to enter • the Diagnostic Tool or battery pack. - Page 206 30 to 75 percent state of charge to prevent loss of characteristics. To prolong the life of your battery, turn off the Diagnostic Tool when not in use. The VERDICT Diagnostic Tool has a built in charger that recharges the battery on demand whenever it is connected to a power source.
- Page 207 Maintenance Diagnostic Tool Disposing of the Battery Pack Always dispose of a lithium-ion battery pack according to local regulations, which vary for different countries and regions. The battery pack, while non-hazardous waste, does contain recyclable materials. If shipping is required, ship the battery pack to a recyling facility in accordance with local, national, and international regulations.
-
Page 208: Operating System Restore
To restore the operating system 1. Turn on the Diagnostic Tool. 2. Wait for the “Press Up Arrow to run Snap-on System Restore” message to display, then select the Up Arrow icon. A progress indicator displays while the program loads. -
Page 209: Replacing The Protective Handgrip
Maintenance M2 Scope/Meter 17.2.2 Replacing the Protective Handgrip The soft protective handgrip that covers the outer edges of the Scanner is easily replaced should it become worn or damaged. Contact your sales representative for replacement parts. To replace the protective handgrip: 1. - Page 210 Maintenance M2 Scope/Meter Risk of electric shock. • Prior to recycling the battery pack, protect exposed terminals with heavy insulating tape to prevent shorting. • Disconnect all test leads and turn diagnostic tools off before removing the battery pack. • Do not attempt to disassemble the battery or remove any component projecting from or protecting the battery terminals.
- Page 211 Maintenance M2 Scope/Meter 6. Separate the battery pack electrical connector. 7. Connect the new battery pack electrical connector to the M2 Scope/Meter. 8. Fit the battery into the battery compartment. 9. Fit the battery compartment cover. 10. Tighten the captive screw and fold down the hanger.
-
Page 212: Index
Index Numerics Data Manager 144 operations 146 10-Minute Electronic Class 78 properties 150 15-Minute Ignition Class 78 screen layout 144 20-Minute current ramp classes 78 toolbar 145 data parameters displaying 42 delete 140 AC/DC power supply 6 demonstration programs 22 actuator tests 42 diagnostic connector 75 Alarms 26... - Page 213 Index information tests 50 Recording data 124 Repair Information 136 reset tests 50 Layout settings, scope 133 Safety iii Scale 30 Making Selections Scan Module Scanner 23 introduction 7 manual conventions 1 – specifications 8 Measurement Out of Range 127 Troubleshooter 73 Memory Resets 42 wireless communication 7...
- Page 214 Index Scope Multimeter toolbar configuring 125 Scanner 25 cursor controls 135 Trace controls, scope 128 file controls 135 trigger leads 116 – condition 48 making selections 125 Triggers operations 114 – setting 47 playback toolbar 124 trouble codes. See diagnostic trouble codes (DTCs) presets 127 Troubleshooter 42 print controls 135...
Need help?
Do you have a question about the VERDICT and is the answer not in the manual?
Questions and answers