Table of Contents
Advertisement
Advertisement
Table of Contents

Summary of Contents for RigExpert ZOOM series
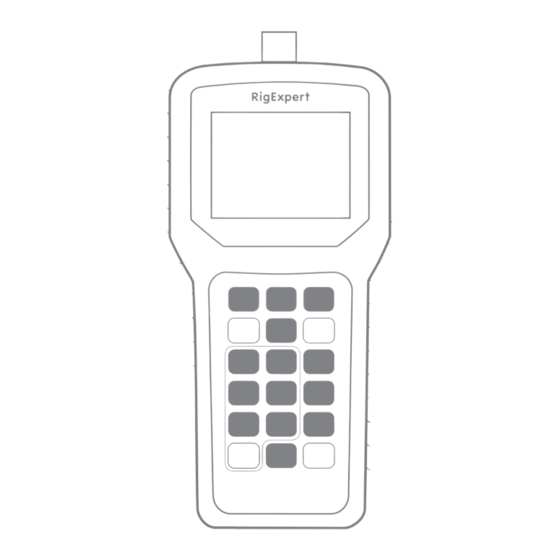
- Page 1 ZOOM series RigExpert ® Antenna and cable analyzer Software manual...
-
Page 3: Table Of Contents
Table of contents 1. Connecting RigExpert Antenna Analyzer to your computer 2. Updating the firmware 3. AntScope program 3.1. Quick start 3.2. Data window 3.3. Saving/loading data 3.4. Saving images 3.5. Screen shots 3.6. Analyzer memory 3.7. AntScope menus 3.8. Time domain reflectometer (TDR) mode... -
Page 4: Connecting Rigexpert Antenna Analyzer To Your Computer
1. Connecting RigExpert Antenna Analyzer to your computer RigExpert Antenna Analyzer can be connected to a computer running Windows 2000/2003/XP/Vista/7/8/10, as well as Mac OS (version 10.6 or higher) operating systems. The latest version of the software may be found at the Downloads section of the rigexpert.com... -
Page 5: Updating The Firmware
You may also download binary files of the firmware for the off-line updating, if necessary. The LCD of the analyzer will flash during the firmware update process. Notice: It is safe for the analyzer to cancel the firmware update process at any time, and then start it over. RigExpert Antenna Analyzer... -
Page 6: Antscope Program
3. AntScope program The main function of the AntScope program is to show measurement results on the “big screen”. The AntScope is a great companion to your RigExpert analyzer which adds functions previously available in expensive, professional grade equipment only. -
Page 7: Data Window
The screen shot below shows a typical AntScope screen: 3.2. Data window You will see a pop-up data window when the cursor is moved over the graph, displaying various parameters of a load: RigExpert Antenna Analyzer... -
Page 8: Saving/Loading Data
3.3. Saving/loading data Go to File – Save as… menu to save current measurement to a file, then select Open… to retrieve the saved data. Please notice that data is saved in native AntScope format (.antdata files or files without extension in older versions of AntScope), which cannot be open in other programs. -
Page 9: Screen Shots
You may download a previously save graph from one of memory slots of your analyzer. Make sure the analyzer is connected to your computer, then select File – Read from analyzer menu. Select a memory slot from the list, then press Choose to download the data. RigExpert Antenna Analyzer... -
Page 10: Antscope Menus
3.7. AntScope menus • File New – discard old measurement, create new Open… – open existing file Save – save measurement results Save as… – save measurement results, give a new name to the file Import from CSV file… – load data from a CSV file exported by other programs Touchstone file…... - Page 11 Zoom in graph, Zoom out graph – zoom the vertical axis of the graph Info under cursor – show numerical values of various parameters (a data window) when the cursor is moved over the graph Show previous graph – put a graph over an old one RigExpert Antenna Analyzer...
- Page 12 • Configure AA-xxx Analyzer – select the corresponding analyzer Imported data – this menu is automatically selected if the data was imported from a CSV or an S1P file COM port… – select virtual COM port number or serial device name, if needed (only for AA-230 ZOOM) Units –...
- Page 13 Set frequency and amplitude – set frequency for single-point or generator mode (Note: amplitude can’t be set) Continuous mode – restart measurement when it finishes Auto start – automatically run measurement • Help About AntScope – output version number and other data RigExpert Antenna Analyzer...
-
Page 14: Time Domain Reflectometer (Tdr) Mode
3.8. Time domain reflectometer (TDR) mode This mode (press F7) displays impulse response and step response graphs which show how electromagnetic wave reflects from discontinuities in a cable. Additionally, a tool tip near the cursor shows estimated value of the impedance of a cable at the corresponding distance. -
Page 15: Calibration Mode
3.9. Calibration mode Although RigExpert analyzers are designed to provide suitable precision without any calibration, a simple “open-short-load” calibration method may be used to improve the result. Moreover, this method may be used to remove the effects of a cable, so accurate measurements at the far end of the cable become possible. - Page 16 Copyright © 2016 Rig Expert Ukraine Ltd. “RigExpert” is a registered trademark of Rig Expert Ukraine Ltd. Made in Ukraine Doc. date: 19-Aug-2016...


Need help?
Do you have a question about the ZOOM series and is the answer not in the manual?
Questions and answers