
Related Manuals for RigExpert AA-600


Summary of Contents for RigExpert AA-600
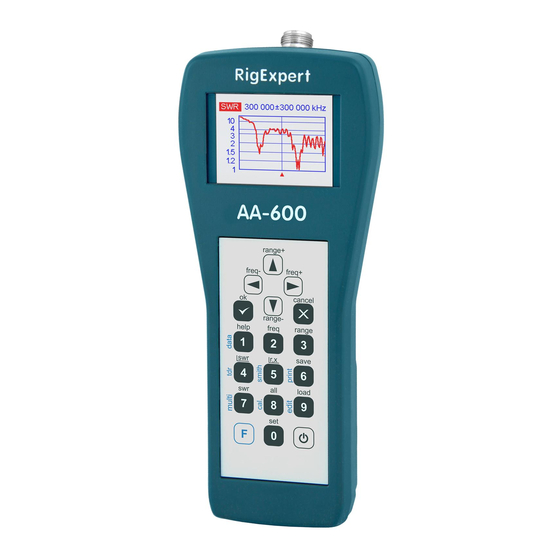
- Page 1 ® RigExpert AA-600 Antenna Analyzer 0.1 to 600 MHz AA-1000 Antenna Analyzer 0.1 to 1000 MHz AA-1400 Antenna Analyzer 0.1 to 1400 MHz User’s manual...
-
Page 3: Table Of Contents
Table of contents 1. Description ......................4 2. Specifications ....................... 5 3. Precautions......................6 4. Operation......................7 4.1. Preparation for use ..................7 4.2. Turning the analyzer on or off................ 7 4.3. Main menu ..................... 8 4.4. Single- and multi-point measurement modes..........9 4.4.1. -
Page 4: Description
1. Description RigExpert AA-600, A-1000 and AA-1400 are powerful antenna analyzers designed for testing, checking, tuning or repairing antennas and antenna feedlines. Graphical SWR (Standing Wave Ratio) and impedance, as well as Smith/polar chart displays are key features of these analyzers which significantly reduce the time required to adjust an antenna. -
Page 5: Specifications
2. Specifications Frequency range: 0.1 to 600 MHz – AA-600 0.1 to 1000 MHz – AA-1000 0.1 to 1400 MHz – AA-1400 Frequency entry: 1 kHz resolution Measurement for 25, 50, 75 and 100-Ohm systems SWR measurement range: 1 to 100 in numerical mode,... -
Page 6: Precautions
3. Precautions Never connect the analyzer to your antenna in thunderstorms. Lightning strikes as well as static discharge may kill the operator. Never leave the analyzer connected to your antenna after you finished operating it. Occasional lightning strikes or nearby transmitters may permanently damage it. -
Page 7: Operation
When this button is pressed, firmware version number as well as battery voltage are displayed on the LCD. The on-screen menu system of RigExpert antenna analyzers provides a simple but effective way to control the entire device. -
Page 8: Main Menu
• The USB icon is displayed when the analyzer is plugged to a personal computer or to a DC adapter with USB socket. Important: RigExpert antenna analyzers are self-documenting. Pressing the (help) key will open a help screen with a list of available hot keys for the current mode. -
Page 9: Single- And Multi-Point Measurement Modes
4.4. Single- and multi-point measurement modes In single-point measurement modes, various parameters of antenna or other load are measured at a given frequency. In multi-point modes, several different frequencies are used. 4.4.1. SWR mode The SWR mode (press the key in the Main menu) displays the SWR bar as well as the numerical value of this parameter: Set the desired frequency (the key) or change it with left or right arrow keys. -
Page 10: Swr2Air Mode
4.4.2. SWR2Air mode RigExpert AA-600, AA-1000 and AA-1400 present a new SWR2Air mode which is designed to help in adjusting antennas connected via long cables. This task usually involves two persons; one adjusting the antenna and the other shouting out the SWR value as it changes at the far end of the feedline. -
Page 11: Multiswr Mode
4.4.3. MultiSWR mode RigExpert AA-600, AA-1000 and AA-1400 have an ability to display SWR for up to five different frequencies at a time. This mode is activated by pressing combination in the Main menu: You may use this feature to tune multi-band antennas. Use... -
Page 12: Show All Mode
4.4.4. Show all mode The Show all mode (the key) will show various parameters of a load on a single screen. Particularly, SWR, return loss (RL), |Z| (magnitude of impedance) as well as its active (R) and reactive (X) components are shown. Additionally, corresponding values of inductance (L) or capacitance (C) are displayed. -
Page 13: Graph Modes
4.5. Graph modes A key feature of RigExpert antenna analyzers is ability to display various parameters of a load graphically. Graphs are especially useful to view the behavior of these parameters over the specified frequency range. 4.5.1. SWR graph In the SWR graph mode (press the... -
Page 14: R,X Graph
4.5.2. R,X graph In the R,X graph mode (press the key in the Main menu), values or R (active part of the impedance) and X (reactive part) are plotted in different colors. In these graphs, positive values of reactance (X) correspond to inductive load, while negative values correspond to capacitive load. -
Page 15: Smith/Polar Chart
4.5.3. Smith/polar chart The Smith/polar chart (press the key combination in the Main menu) is a good way to display reflection coefficient over the specified frequency range: Do not forget to press the (ok) key to start measurement or refresh the graph. As usual, press the key for a help screen. -
Page 16: Memory Operation
4.5.5. Memory operation In all graph modes, press the key, and you will be given a choice of 90 memory slots. Using arrow up or arrow down ( ) keys, select the desired slot number: Press . You will be prompted to edit the selected memory slot name. Follow instructions on the display. -
Page 17: Calibration
4.5.6. Calibration Although RigExpert AA-600, AA-1000 and AA-1400 are designed for high performance without any calibration, an open-short-load calibration may be applied for better precision. The standards used for calibration should be of high quality. This requirement is especially important for high frequencies (100 MHz and upper). Three different calibration standards should be used: an “open”, a “short”... - Page 18 3. By pressing the key combination, open the Calibration screen: 4. Connect an “open” to the analyzer and press the key. The analyzer will rescan the specified frequency range and save calibration data to its memory. 5. Connect a “short” and press the 6.
- Page 19 Changing the center frequency or the sweep range will invalidate calibration. Additionally, pressing the key in the Calibration screen will invalidate the current calibration, and pressing the key will return the analyzer to the center frequency and the sweep range used during the last calibration:...
-
Page 20: Tdr (Time Domain Reflectometer) Mode
4.6. TDR (Time Domain Reflectometer) mode 4.6.1. Theory Time domain reflectometers are electronic instruments used for locating faults in transmission lines. A short electrical pulse is sent over the line, and then a reflected pulse is observed. By knowing the delay between two pulses, the speed of light and the cable velocity factor, the DTF (distance-to-fault) is calculated. - Page 21 Unlike many other commercially-available reflectometers, RigExpert AA-600, AA- 1000 and AA-1400 do not send pulses into the cable. Instead, another technique is used. First, R and X (the real and the imaginary part of the impedance) are measured over the whole frequency range (up to 600, 1000 or 1400 MHz). Then, the IFFT (Inverse Fast Fourier Transform) is applied to the data.
-
Page 23: Practice
4.6.2. Practice Press to open Impulse Response (IR) and Step Response (SR) graphs: The characteristic impedance and the velocity factor of the cable, as well as display units (meters or feet) may be changed in the Settings menu. (ok) key starts a new measurement, which will take about a minute. You may disconnect your antenna or leave it connected to the far end of the cable. -
Page 24: Settings Menu
4.7. Settings menu The Settings menu (press the key in the Main menu) contains various settings for the analyzer. The first page contains the following commands: – language selection – backlight brightness and timer – colour scheme selection – sound on or off –... - Page 25 – select cable velocity factor for the TDR display – select system impedance for SWR, Smith/polar chart and TDR displays – select series or parallel representation (see page 12) for the R,X graph – go to the third page which contains analyzer self-test options –...
- Page 26 If one of the bars of both bars is not filled at all, the RF output stage or/and the detector circuits are not working properly in the analyzer: On the above picture, the first bar indicates no RF signal at one of the legs of the resistive bridge.
- Page 27 AA-600: AA-1000: AA-1400: The voltage curve should stay between horizontal lines. The vertical lines are the bounds of analyzer’s sub-bands. – band-pass filter frequency response graph. With no load at the antenna connector, the display should look like shown on the picture:...
-
Page 28: Computer Connection
– go to the last page of the settings menu 4.8. Computer connection RigExpert AA-600, AA-1000 and AA-1400 antenna analyzers may be connected to a personal computer for displaying measurement results on its screen, taking screen shots of the LCD, as well as for updating the firmware. -
Page 29: Applications
5. Applications 5.1. Antennas 5.1.1. Checking the antenna It is a good idea to check an antenna before connecting it to the receiving or transmitting equipment. The SWR graph mode is good for this purpose: The above picture shows SWR graph of a car VHF antenna. The operating frequency is 160 MHz. -
Page 30: Adjusting The Antenna
5.1.2. Adjusting the antenna When the measurement diagnoses that the antenna is off the desired frequency, the analyzer can help in adjusting it. Physical dimensions of a simple antenna (such as a dipole) can be adjusted knowing the actual resonant frequency and the desired one. Other types of antennas may contain more than one element to adjust (including coils, filters, etc.), so this method will not work. -
Page 31: Cable Length Measurement
5.2.2. Cable length measurement Resonant frequencies of a cable depend on its length as well as on the velocity factor. A velocity factor is a parameter which characterizes the slowdown of the speed of the wave in the cable compared to vacuum. The speed of wave (or light) in vacuum is known as the electromagnetic constant: c=299,792,458 meters per second or 983,571,056 feet per second. -
Page 32: Velocity Factor Measurement
3. Calculate the physical length of the cable by dividing the above speed by the resonant frequency (in Hz) and multiplying the result by the number which corresponds to the location of this resonant frequency (1/4, 1/2, 3/4, 1, 5/4, etc.) Example: 197,863,022 / 9,400,000 ·... -
Page 33: Cable Fault Location
5.2.4. Cable fault location To locate the position of the probable fault in the cable, just use the same method as when measuring its length. Watch the behavior of the reactive component (X) near the zero frequency: • If the value of X is moving from –∞ to 0, the cable is open-circuited. •... -
Page 34: Making 1/4-Λ, 1/2-Λ And Other Coaxial Stubs
5.2.5. Making 1/4-λ, 1/2-λ and other coaxial stubs Pieces of cable of certain electrical length are often used as components of baluns (balancing units), transmission line transformers or delay lines. To make a stub of the predetermined electrical length, 1. Calculate the physical length. Divide the electromagnetic constant by the required frequency (in Hz). -
Page 35: Measuring The Characteristic Impedance
5.2.6. Measuring the characteristic impedance The characteristic impedance is one of the main parameters of any coaxial cable. Usually, its value is printed on the cable by the manufacturer. However, in certain cases the exact value of the characteristic impedance is unknown or is in question. To measure the characteristic impedance of a cable, 1. -
Page 36: Measurement Of Other Elements
Analyzers can measure capacitance from a few pF to about 0.1 µF as well as inductance from a few nH to about 100 µH. Since measuring of capacitance and inductance is not a main purpose of RigExpert analyzers, the user will have to gain some experience in such measurements. - Page 37 1. Enter the R,X graph mode and select a reasonably large scanning range. Perform a scan. Example 1: Example 2: Unknown capacitor Unknown inductor 2. By using left and right arrow keys, scroll to the frequency where X is -25…-100 Ohm for capacitors or 25…100 Ohm for inductors.
-
Page 38: Transformers
5.3.2. Transformers RigExpert analyzers can also be used for checking RF transformers. Connect a 50 Ohm resistor to the secondary coil (for 1:1 transformers) and use SWR graph, R,X graph or Smith/polar chart modes to check the frequency response of the transformer. Similarly, use resistors with other values for non-1:1 transformers. -
Page 39: Rf Signal Generator
5.4. RF signal generator The output signal of RigExpert AA-600, AA-1000 and AA-1400 has rectangular waveform and level of about -10 dBm (at the 50 Ohm load). Therefore these analyzers can be used as sources of RF signal for various purposes. - Page 40 Copyright © 2007-2014 Rig Expert Ukraine Ltd. RigExpert is a registered trademark of Rig Expert Ukraine Ltd. RigExpert AA-600, AA-1000 and AA-1400 Antenna Analyzers are made in Ukraine. Printed in Ukraine 12-Jun-2014...
Need help?
Do you have a question about the AA-600 and is the answer not in the manual?
Questions and answers