
Related Manuals for Kenwood CS-8010


Summary of Contents for Kenwood CS-8010
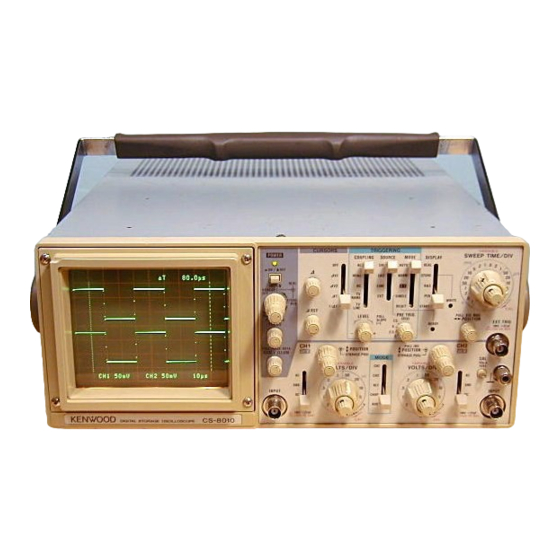
- Page 1 D I G I T A L S T O R A G E O S C I L L O S C O P E CS-8010 INSTRUCTION MANUAL K E N W O O D C O R P O R A T I O N ©PRINTED IN JAPAN B50-7624-30(T)
-
Page 2: Table Of Contents
S A F E T Y Use the Proper Power Cord Symbol in This Manual Use only the power cord and connector specified for your This symbol indicates where applicable cautionary or product. ZIA other imformation is to be found. Use the Proper Fuse Power Source To avoid fire hazard, use a fuse of the correct type. -
Page 3: Features
100 ns/word. With a storage general-use oscilloscope currently in use. capacity of 8 bits x 2048 words, the CS-8010 offers an 6. The readout function displays each scale factor on the easy waveform storage, having been subject to com- CRT, eliminating troublesome confirmation of the range plicated operation heretofore. -
Page 4: Specifications
S P E C I F I C A T I O N S 1 50 mm rectangular with internal graticule C R T 12 kV Acceleration Voltage 8 x 10 div (1 div = 10 mm) Display Area VERTICAL AXIS (CH1 and CH2) 1 mV/div to 5 V/div, ±... - Page 5 A Max. Externa! Trigger Voltage 50 V (DC + AC peak) Coupling AC, HFREJ, DC, TV FRAME, TV LINE Sync sensitivity Sync sensitivity Sync sensitivity Sync sensitivity Sync sensitivity Sync sensitivity At NORM position Sync frequency range: 10 Hz to 20 MHz INT: 1 div, EXT: 0.1 Vp-p Sync frequency range: DC to 20 MHz...
- Page 6 Voltage difference between ^ R E F and A cursors on a CH1 scale factor basis Cursor mode Cursor mode Cursor mode Cursor mode 4 V 1 : Voltage difference between AREF and A cursors on a CH2 scale factor basis AV2: Time difference between AREF and A cursors on the basis of sweep scale factor Frequency between AREF and A cursors on the basis of sweep scale factor...
-
Page 7: Aprecautions
8. To protect against safety hazards always ground the instrument using the GND terminals on the panel. 2. The CS-8010 should be installed at a place meeting the 9. When turning on and off the POWER switch repeated- following conditions: ly, keep an interval of about 5 seconds. -
Page 8: Controls And Indicators
C O N T R O L S AND INDICATORS FRONT PANEL Fig. CH1 $ POSITION © CH1 AC-GND-DC ® This switch is the CH1 vertical axis coupling mode Rotation adjusts vertical position of CH1 waveform on selector, for X-Y operation, the Y-axis coupling mode the screen. - Page 9 (9) CH2 VOLTS/DIV @ POWER Vertical attenuator for CH2. Provides the same func- Power switch. A press of this switch turns the power tion as VOLTS/DIV Control (§) for CH1. In X-Y opera- tion, the control serves as the X-axis attenuator. ®...
- Page 10 Fig. sure to set the COUPLING switch to AC < • POSITION/PULL x 10 MAG position. Horizontal position controller, which provides horizon- tal shift of waveform. By pulling the knob, the sweep EXT: Sweep is triggered by signal applied to EXT TRIG INPUT jack (jjj) .
- Page 11 When the DISPLAY select switch @ is changed to CS-8010 functions as a general-use oscilloscope with another position, data writing into the memory is the trigger point at the left end on the CRT.
- Page 12 Fig. AV'2: NOTE: Setting of the MODE select switch @ Two horizontal cursor lines are displayed on the CRT, and voltage difference and voltage ratio bet- X-Y position disables AT ween them are displayed in the upper right on the mode measurement.
-
Page 13: Rear Panel
C O N T R O L S AND INDICATORS Fig. 5 REAR PANEL © Z AXIS INPUT @> Fuse Holder, Line Voltage Selector External intensity modulation input; TTL compatible. Contains the line fuse. Verify that the proper fuse is in- stalled when replacing the line fuse. -
Page 14: Directions For Use
DIRECTIONS FOR USE READOUT DISPLAY (1) POSITIONS OF THE DISPLAY D i s p l a y s t h e calendar, s c a l e f a c t o r s , cursor measurement data, etc. at the following positions on the C R T . -
Page 15: Operation
OPERATION INITIAL STARTING PROCEDURE refer to the item "Front Panel". In the case of using a pro- be, refer to the Operation Manual attached to the probe as Prior to turning the power ON, set the switches as in the well as the application example "Probe Compensation". -
Page 16: Sweep Magnification Operation
ample. Fig. 8 shows that the sweep circuit is driven • Triggering Level by the gate signal when the gate signal in the burst Trigger point on waveform is adjusted by the signal is applied to the EXT. TRIG INPUT jack. LEVEL/PULL SLOPE ®... -
Page 17: Video Signal Observation
(4) Video signal observation 2 Cursor measurement 4 V 1 : Set the MODE select switch @ to ALT and Setting the COUPLING ® switch, to the TV FRAME or TV the CURSORS select switch @ to 4 V 1 , LINE position permits selection of vertical or horizontal and two horizontal cursor lines are displayed on sync pulses for sweep triggering when viewing composite... - Page 18 Real-time w a v e f o r m Storage w a v e f o r m Fig. 14 Fig. Example: When storing a waveform after the AC- GND-DC switch is set to AC with the Example: When checking that the waveform is present on DISPLAY MODE set to STORE the CRT after setting the AC-GND-DC switch to When the DISPLAY @ is set to R &...
- Page 19 -Storage w a v e f o r m Real-taime "waveform Storage w a v e f o r m Fig. 19 Fig. 16 Example: When freezing the storage waveform using Example: When the storage waveform is clamped by the write pen with the DISPLAY MODE set adjusting the •...
- Page 20 Set the TRIGGERING MODE (§) to SINGLE-RESET to set the oscilloscope to trigger signal waiting status. (After the WRITE @ LED lights, the READY @ LED lights. When the READY LED is lit, it shows that the oscilloscope is in trigger signal waiting mode.) When a trigger signal is generated, the waveform will be written into memory for the specified period, and the storage waveform will be displayed on the CRT...
- Page 21 When storing a waveform with the SWEEP TIME set to When storing a waveform with the SWEEP TIME set to between 20 /xs/div and 0.5 /ts/div between 1 s/div and 50 /ts/div Fig. Fig. Example:When storing a waveform with 20 jtis/div, by Example:When storing a waveform with 1 s/div, by pre-triggering.
- Page 22 Readout to Pen Recorder Set the DISPLAY @ to STORE, and store the input signal to be recorded onto the pen recorder. Connect the input terminal of the pen recorder to the PEN OUT jack @ or @ on the rear panel of the oscilloscope.
-
Page 23: Application
APPLICATIONS PROBE COMPENSATION 3. Set the AC-GND-DC switch to the DC position to observe the input waveform, including its DC compo- For accurate measurement, perform appropriate probe cor- nent. If an appropriate reference level or VOLTS/DIV rection prior to measurement. setting was not made, the waveform may not be visible 1. -
Page 24: Measurements Of The Voltage
(T) When a 10:1 probe is used. (2) CURSOR measurement Volts peak-to-peak 1) Make the GND luminescent line be displayed by means = Vertical distance (div) x (VOLTS/DIV setting) x 10 of ordinary procedures 1) and 2). 2) Set the cursor mode to A V! or A V2 in accordance with (2) With direct measurement the channel to be used. -
Page 25: Elimination Of Undesired Signal Components
3. ELIMINATION OF UNDESIRED SIGNAL COMPONENTS The ADD feature can be conveniently used to cancel out the effect of an undesired signal component which superimposed on the signal you wish to observe. Procedure: 1. Apply the signal containing an undesired component to the CH1 INPUT jack and the undesired signal itself alone to the CH2 INPUT jack. -
Page 26: Time Measurements
(2) Cursor measurement 5. TIME MEASUREMENTS 1. In the same way as the ordinary measurement, adjust (1) Ordinary measurement the waveform to be measured to an easy-to-observe point. Time between two points on a wave can be measured from 2. Set the cursor mode to AT. the SWEET TIME/DIV value and horizontal distance bet- 3. -
Page 27: Pulse Width Measurements
7. PULSE WIDTH MEASUREMENTS [EXAMPLE] For the example, when the horizontal distance between (1) Ordinary measurement two signals is 4.4 divisions. The SWEEP TIME/DIV is 0.2 (ms/div). (See Fig. 40) Pulse width can be measured as follows: Substituting the given value: Procedure: Time = 4.4 (div) x 0.2 (ms/div) = 0.88 ms 1. -
Page 28: Pulse Rise Time And Falltime Measurements28
NOTE: The graticule on the CRT includes the 0, 10, 90, and 100% lines assuming that 5 divisions corres- 12) Cursor measurement pond to 100%. Use them as a reference for ac- 1. In the same way as the ordinary measurement, adjust curate measurements. -
Page 29: Phase Difference Measurements
9. PHASE DIFFERENCE MEASUREMENTS (1) Ordinary measurement Adjust 9 0 % point to the center and measure D Phase difference between two sine waves of the same fre- quency, etc. can be measured as follows: Procedure: 1. Apply the two signals to the CH1 and CH2 INPUT jacks, setting the vertical MODE to either CHOP or ALT mode. -
Page 30: Time Ratio Measurement Using Cursors
Phase difference = Horizontal distance of new sweep range Measured value • (div)x45°/div New SWEEP TIME/DIV setting — - — Original SWEEP TIME/DIV setting Another simple method of obtaining more accuracy quickly is to simply use x 10 MAG for a scale of 4.5°/div. R E F cursor- cursor Fig. -
Page 31: Frequency Measurements
Using the formula: 1 1 . FREQUENCY MEASUREMENTS Frequency measurements are made by measuring the # of cvcles x " x 10 M A G " value period of one cycle of waveform and taking the reciprocal Freq= Horizontal distance (div) x SWEEP TIME/DIV setting of this time value as the frequency. -
Page 32: Relative Measurements
Measured value Reference signal Adjusted reference signal R E F cursor cursor Unknown signal Fig. 54 12. RELATIVE MEASUREMENTS If the frequency and amplitude of some reference signal are known, an unknown signal may be measured for level and frequency without use of the VOLTS/DIV or SWEEP TIME/DIV for calibration. -
Page 33: Application Of X-Y Operation
2. The Sweep (horizontal) calibration coefficient is then [ E X A M P L E ] the period of the reference signal divided by the product S W E E P T I M E / D I V is 0 . 1 m s a n d a p p l y 1 . 7 5 k H z r e f e r e n c e of the number of divisions used in step 1 for setup of the s i g n a l . -
Page 34: Oscilloscope
APPLICATION EXAMPLES DIGITAL STORAGE OSCILLOSCOPE Waveform observation of a low-frequency signal, or single SINE 4> = — phenomenon, etc., that is difficult with a normal <j>= oscilloscope can be made easily, and the applicable range is W h e r e phase angle greatly widened. - Page 35 (2) Low frequency observation In conventional oscilloscopes, the low frequency signal can be observed as a spot and waveform obser- vation is difficult. However, with the storage mode of this unit, the low-frequency waveform can easily be observed. An example of the period measurement and voltage measurement of low frequency signals are shown below: DISPLAY MODE...
-
Page 36: A Maintenance
MAINTENANCE A Caution : Read this page carefully to keep your s a f e t y . For Electric Shock Protection: Be sure to disconnect the power cable from the socket before conducting the following operation. REPLACING THE FUSE CHANGING THE SUPPLY VOLTAGE In case the fuse has blown, locate the cause. -
Page 37: Resetting The Readout Calender And Clock Display
RESETTING THE READOUT CALENDAR AND CLOCK DISPLAY The readout calendar and clock display can be changed and reset with the DATE change switch located on the right end of the rear side on the bottom. (This can be performed without removing the case.) Bottom of the c a s e Fig. -
Page 38: Accessories
ACCESSORIES STANDARD ACCESSORIES INCLUDED OPTIONAL ACCESSORIES Probe (PC-33) 2 pes. Probe Pouch (MC-78) Instruction Manual Replacement Fuse This soft vinyl pouch attaches to the top side oscilloscope 1.2 A 2 pes. housing and provides storage space for two probes and the 0.8 A 2 pes. - Page 40 A product of KENWOOD CORPORATION 17-5. 2-chome, Shibuya, Shibuya-ku, Tokyo 150, Japan...