Table of Contents
Advertisement
Quick Links
Advertisement
Table of Contents

Related Manuals for LeCroy WaveRunner Xi-A


Summary of Contents for LeCroy WaveRunner Xi-A
- Page 1 WaveRunner Xi-A and ® MXi-A Oscilloscopes...
- Page 2 ® UNNER Xi‐A MXi‐A AND ERIES SCILLOSCOPES Getting Started Manual 2009 ARCH ...
- Page 3 © 2009 by LeCroy Corporation. All rights reserved. LeCroy, ActiveDSO, JitterTrack, WavePro, WaveMaster, WaveSurfer, WaveLink, WaveExpert, and Waverunner are registered trademarks of LeCroy Corporation. Other product or brand names are trademarks or requested trademarks of their respective holders. Information in this publication supersedes all earlier versions.
-
Page 4: Table Of Contents
Calibration ..................... 13 Cleaning ...................... 13 Abnormal Conditions .................. 13 .......... 14 HEN OUR SCILLOSCOPE IS ELIVERED Check that You Have Everything .............. 14 Warranty ....................... 14 Maintenance Agreements ................ 15 Windows License Agreement ............... 15 End‐user License Agreement for LeCroy® X‐Stream Software ..... 15 ‐U .............. 15 OWER P AND NSTALLATION Power‐Up ...................... 15 Software ...................... 15 Adding a New Option .................. 15 Restoring Software .................. 16 Restarting the Application ................ 16 ... - Page 5 Xi-A MXi-A S UNNER ERIES Zoom Control Knobs .................. 2 4 Special Features Controls ................ 2 5 .......... 2 6 NDERSTANDING ISPLAY NFORMATION Top Menu Bar (File Menu) ................ 2 6 Grid Area ...................... 2 7 Trace Descriptors ................... 2 8 Dialog Boxes .................... 2 9 Message Bar .................... 2 9 ............. 2 9 ...
- Page 6 ETTING TARTED ANUAL SMART Triggers ..................... 43 ............... 44 ERIAL RIGGER ND ECODE Accessing Serial Decode Triggers .............. 44 Serial Decode and Decode Setup .............. 45 TriggerScan .................... 46 Training TriggerScan .................. 46 Starting TriggerScan .................. 47 Saving TriggerScan Setups ................ 47 ............... 48 AVEFORM EASUREMENTS Measuring with Cursors ................ 48 Overview ...................... 48 Cursor Measurement Icons ................ 48 Cursors Setup .................... 49 Quick Display ..................... 49 Full Setup ...................... 49 ...
- Page 7 Xi-A MXi-A S UNNER ERIES ................ 6 0 ISPLAY ORMATS Display Setup .................... 6 0 Sequence Mode Display .................. 61 Persistence Setup .................. 6 2 Saturation Level .................... 62 3‐Dimensional Persistence ................ 62 Show Last Trace .................... 63 Zooming Waveforms .................. 6 4 Zooming a Single Channel ................. 64 Zooming by Touch‐and‐Drag ................ 65 Turning Zoom Off .................. 6 6 ................ 6 6 ...
- Page 8 ETTING TARTED ANUAL Standards ...................... 86 Program Messages .................. 87 .................. 87 UTOMATION Standards ...................... 87 .................. 87 TILITIES Status ...................... 87 Accessing the Status Dialog ................ 88 Remote communication................ 88 Remote Communication Setup ................ 88 Configuring the Remote Control Assistant Event Log ........ 89 Hardcopy ....................... 89 Printing ...................... 89 Clipboard ...................... 89 File ........................ 90 ...
- Page 9 Xi-A MXi-A S UNNER ERIES Recovery Procedure .................. 1 00 Restarting the Application after Recovery .......... 1 03 Restarting the Operating System .............. 1 03 Windows Activation .................. 103 APPENDIX .................. 1 06 Specifications .................... 1 06 Vertical System .................... 106 Horizontal System ................... 108 Acquisition System .................. 109 Acquisition Modes ................... 110 Acquisition Processing .................. 110 ...
-
Page 10: Introduction
ETTING TARTED ANUAL NTRODUCTION This Getting Started Manual includes important safety and installation information for your WaveRunner Xi Series oscilloscope. Brief operating procedures get you started capturing, viewing, and analyzing your waveforms. If desired, change your user interface language from English by selecting Utilities Preferences on the instrument’s menu bar (top of the screen) and then select Language. The information contained in this guide also appears (with more detail) in the oscilloscope Help files. These files are searchable in the oscilloscope and also supplied on the CD‐ROM shipped with your oscilloscope. AFETY EQUIREMENTS This section contains information and warnings that must be observed to keep the instrument operating in a correct and safe condition. You are required to follow generally‐accepted safety procedures in addition to the safety precautions specified in this section. Safety Symbols and Terms Where the following symbols or terms appear on the instrument’s front or rear panels, or in this manual, they indicate important safety considerations. This symbol is used where caution is required. Refer to the accompanying information or documents in order to protect against personal injury or damage to the instrument. This symbol warns of a potential risk of shock hazard. This symbol is used to denote the measurement ground connection. This symbol is used to denote a safety ground connection. This symbol indicates an On/Standby switch type. When pressed, the instrument’s state toggles between Operating and Standby modes. This ... -
Page 11: Operating Environment
Xi-A MXi-A S UNNER ERIES WARNING The WARNING sign indicates a potential hazard. It calls attention to a procedure, practice or condition which, if not followed, could possibly cause bodily injury or death. If a WARNING is indicated, do not proceed until its conditions are fully understood and met. CAT I Installation (Overvoltage) Category rating per EN 61010‐1 safety standard and is applicable for the oscilloscope front panel measuring terminals. CAT I rated terminals must only be connected to source circuits where measures are taken to limit transient voltages to an appropriately lower level. Operating Environment The instrument is intended for indoor use and should be operated in a clean, WARNING dry environment. Make sure this The oscilloscope must not be operated in product’s operating environment is kept explosive, dusty, or wet/damp within the following parameters prior to atmospheres. use: • Temperature: 5 to 40 °C • Humidity: Maximum relative humidity 80% for temperatures up to 31 °C decreasing linearly to 50% relative humidity at 40 °C. • Altitude: Up to 2,000 m ... -
Page 12: Cooling Requirements
ETTING TARTED ANUAL CAUTION PLEASE NOTE THE FOLLOWING: Do not connect or disconnect probes or • Installation (Overvoltage) Category II test leads while they are connected to a refers to local distribution level, applicable to equipment connected to the voltage source. mains supply (AC power source). • Installation (Overvoltage) Category I refers to signal level, applicable to equipment measuring terminals connected to source circuits where measures are taken to limit transient... -
Page 13: Ac Power Source
Xi-A MXi-A S UNNER ERIES AC Power Source The instrument operates from a Note: The instrument automatically adapts itself to the AC single‐phase, 100 to 240 V (+/‐ line input within the following ranges: 10%) AC power source at 50/60 Voltage Range: 90 to 264 V 90 to 132 V Hz (+/‐5%), or single‐phase 100 Frequency Range: 47 to 63 Hz 380 to 420 Hz to 120 V (+/‐10%) AC power source at 400 Hz (+/‐5%). No manual voltage selection is required because the instrument automatically adapts to line voltage. ... -
Page 14: Calibration
ETTING TARTED ANUAL The oscilloscope should be positioned to allow easy access to the socket‐ CAUTION outlet. Power is completely removed The outer shells of the front panel from the oscilloscope by unplugging terminals (CH1, CH2, CH3, CH4, EXT) are the power cord from the AC outlet. connected to the instrument chassis, and The power cord should be unplugged therefore to the safety ground. from the AC outlet if the instrument is not used for an extended period of time. Calibration The recommended calibration interval is one year. Calibration should be performed by qualified personnel only. Cleaning Clean only the exterior of the instrument, using a damp, soft cloth. WARNING Do not use chemicals or abrasive Electric Shock Hazard! elements. Under no circumstances No operator serviceable parts inside. Do allow moisture to penetrate the not remove covers. instrument. Avoid electric shock by Refer servicing to qualified personnel. unplugging the power cord from the AC outlet before cleaning. Abnormal Conditions Operate the instrument only as intended by the manufacturer. WARNING If you suspect the oscilloscope’s Any use of the oscilloscope in a manner not protection has been impaired, ... -
Page 15: When Your Oscilloscope Is Delivered
Xi-A MXi-A S UNNER ERIES HEN OUR SCILLOSCOPE IS ELIVERED Check that You Have Everything First, verify all items on the packing list or invoice copy have shipped. Contact your nearest LeCroy customer service center or national distributor and report any missing or damaged items. We cannot be responsible for replacement unless contacted immediately. NOTE: THE FOLLOWING WARRANTY REPLACES ALL OTHER WARRANTIES, EXPRESSED OR IMPLIED, INCLUDING BUT NOT LIMITED TO ANY IMPLIED WARRANTY OF MERCHANTABILITY, FITNESS, OR ADEQUACY FOR ANY PARTICULAR PURPOSE OR USE. LECROY SHALL NOT BE LIABLE FOR ANY SPECIAL, INCIDENTAL, OR CONSEQUENTIAL DAMAGES, WHETHER IN CONTRACT OR OTHERWISE. THE CUSTOMER IS RESPONSIBLE FOR THE TRANSPORTATION AND INSURANCE CHARGES FOR THE RETURN OF PRODUCTS TO THE SERVICE FACILITY. LECROY RETURNS ALL PRODUCTS UNDER WARRANTY WITH TRANSPORT PREPAID. Warranty The oscilloscope is warranted for normal use and operation, within specifications, for a period of three years from shipment. LeCroy either repairs or, at our option, replaces any product returned to one of our authorized service centers within this period. However, in order to do this we must first examine the product and find that it is defective due to workmanship or materials and not due to misuse, neglect, accident, or abnormal conditions or operation. LeCroy shall not be responsible for any defect, damage, or failure caused by any of the following: a) attempted repairs or installations by personnel other than LeCroy representatives or b) improper connection to incompatible equipment, or c) for any damage or malfunction caused by the use of non‐LeCroy supplies. Furthermore, LeCroy shall not be obligated to service a product that has been modified or integrated where the modification or integration increases the task duration or difficulty of servicing the oscilloscope. Spare and replacement parts, and repairs, all have a 90‐day warranty. The oscilloscope’s firmware has been thoroughly tested and is presumed to be functional. Nevertheless, it is supplied without warranty of any kind covering ... -
Page 16: Maintenance Agreements
LeCroy's agreement with Microsoft prohibits users from running software on LeCroy X‐Stream oscilloscopes irrelevant to measuring, analyzing, or documenting waveforms. End‐user License Agreement for LeCroy® X‐Stream Software The software in this product is made available under license from LeCroy Corporation. For full details of the End User License Agreement, please refer to the Copyright section of the oscilloscope Help files. ‐U ... -
Page 17: Restoring Software
Xi-A MXi-A S UNNER ERIES Restoring Software Restarting the Application Upon initial power‐up, the oscilloscope loads the instrument application software automatically. • If you exit the application and want to reload it, touch the shortcut icon on the desktop: • If you minimize the application, touch the desktop icon to maximize it: Restarting the Operating System If you need to restart the Windows® operating system, you must reboot the oscilloscope by pressing the power switch, and then turning the power back on after a ten‐second wait. External Monitor Your WaveRunner Xi Series oscilloscope’s motherboard contains a dual‐video chip. This enables extension of the desktop over two monitors or to display a clone of the oscilloscope screen on an external monitor. For example, in extended mode, the scope can be showing the UI on the internal monitor and another application like Excel® on the external monitor, or vice versa. Or, turn the scope monitor off and view the scope UI only from the external monitor if desired. WRXi-A-GSM-E Rev A... -
Page 18: Hardware Connections
ETTING TARTED ANUAL Hardware Connections Numbers on the previous picture correspond as follows: Mouse RS‐232‐C Port Ethernet Port Speakers Keyboard LeCroy Bus (LBus) USB Ports (4) Line In External VGA Monitor Software The oscilloscope’s hardware and software configuration can be seen as follows: 1. In the menu bar, touch Utilities. 2. In the dialog area, touch Status. Adding a New Option New software options can be added after purchasing a code and then enabling the option on the instrument. Call LeCroy Customer Support to place an order and receive the code. Monitor Hookup 1. Connect the external monitor to the VGA port on the side of the instrument (4, as follows). 2. Plug in the monitor's power cord, and turn on the monitor. Video Setup After the system boots, configure the monitors as follows: Note: A mouse is required for dual monitor use. WRXi-A-GSM-E Rev A... - Page 19 Xi-A MXi-A S UNNER ERIES 1. Minimize the oscilloscope UI by selecting File Minimize. 2. In the system tray portion of the task bar, click the Intel® monitor icon. 3. From the Intel® extreme graphics2 for mobile pop‐up menu, select Graphics Properties… 4. From the Display Devices dialog, select a display mode. Note: In these dialogs the oscilloscope monitor is referred to as Notebook, and the external monitor as Monitor. 5. From the Primary Device drop‐ down menu, select the primary display monitor (the one to show the oscilloscope UI). 6. If the external monitor is WRXi-A-GSM-E Rev A...
-
Page 20: Probes
This setting determines mouse The monitors may also be placed pointer movement from one monitor to the other. on top of the other to arrange them vertically. 9. Click Display Settings and set the resolution (screen area) and color palette for the external monitor. CAUTION Do not change these settings for the Notebook (oscilloscope) monitor in order to maintain proper oscilloscope display functionality. 10. Click OK. ROBES Your WaveRunner Xi oscilloscope is supplied with one passive probe for each channel. The supplied passive probe has a high‐input resistance and low capacitance make it ideal for general purpose probing of signals with frequency content from DC through several hundred MHz. The supplied passive probe has a large selection of connection accessories, supplied standard with the probe and available from LeCroy as optional accessories. WRXi-A-GSM-E Rev A... -
Page 21: Probe Compensation
Xi-A MXi-A S UNNER ERIES LeCroy also offers a variety of passive and active probes for use with your WaveRunner Xi Series oscilloscope. Visit www.lecroy.com for specifications and ordering information. Current Probes measure the current passing through a wire. They Current do not use the traditional probing style of placing a tip onto a test Probes point. Instead, a wire is placed inside of the jaw of the probe, which then allows the probe to measure the current (in Amps). There are two different types of active probes: single‐ended and differential. Single‐ended: A single‐ended active probe is associated with measuring voltages at high frequencies. Measurement with an active probe requires a test point and a ground point. The ground Active (also called earth) acts as a zero reference for the test point Probes measurement. Differential: Differential active probes are like two probes in one. Instead of measuring a test point in relation to a ground point (like single‐ended active probes), differential probes measure the difference in voltage of a test point in relation to another test point. Passive probes measure voltages at lower frequencies (<400 MHz). They have higher input capacitance (input C) and do not need power to operate (unlike active probes). At higher frequencies, Passive higher input capacitance loads the test circuit, attenuating the Probes signal. This is why active probes are used in high frequency applications. Passive probes also measure voltage in reference to ground. High These are active single ended probes that are designed to measure Voltage high voltages (safely). They measure the voltage in reference to ... - Page 22 ETTING TARTED ANUAL 3. Adjust the trim pot at the connector end of the probe until the square wave is as flat as possible. WRXi-A-GSM-E Rev A...
-
Page 23: Front Panel Controls
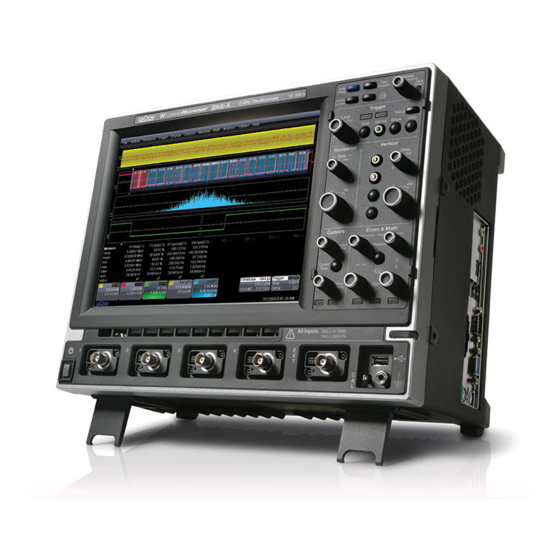
Xi-A MXi-A S UNNER ERIES RONT ANEL ONTROLS WRXi-A-GSM-E Rev A... -
Page 24: Front Panel Buttons And Knobs
ETTING TARTED ANUAL Front Panel Buttons and Knobs The control buttons of the WaveRunner Xi Series front panel are logically grouped into analog and special function areas. Analog functions are included in the Horizontal, Trigger, and Vertical groups of control buttons and knobs. The following table provides an explanation of the front panel push buttons and knobs: Trigger Controls • ‐ Selects the trigger EVEL threshold level. The Level is indicated in the Trigger descriptor label: • Push the L knob to have the oscilloscope find the level automatically. EVEL • ‐ Displays the trigger setup dialog. Push the button again to close the ETUP dialog. • - Triggers the oscilloscope after a time‐out, even if the trigger conditions are not met. • Triggers the oscilloscope each time a signal is present that meets the ORMAL conditions set for the type of trigger selected. • Arms the oscilloscope to trigger once (single‐shot acquisition) when INGLE the input signal meets the trigger conditions set for the type of trigger selected. If the oscilloscope is already armed, it forces a trigger. • ‐ Prevents the oscilloscope from triggering on a signal. Horizontal Controls ... -
Page 25: Vertical Controls
Xi-A MXi-A S UNNER ERIES Vertical Controls • ‐ Adjusts the vertical offset of a channel. FFSET • ‐ Adjusts the Volts/Division setting (vertical OLTS gain) of the channel selected. • ‐ If the channel is already ON, the HANNEL UTTONS channel button makes the channel active. If the channel is OFF, the channel button turns the channel ON. When the channel is active, the channel button is lit, and the Offset and Volts/Div knobs are dedicated to that channel. Zoom Control Knobs • ‐ Automatically displays UICK magnified views of up to four signal inputs on multiple grids. With four input signals, the signals are displayed along with four zoom traces, each on its own grid. This button turns off all other traces and redefines all math functions to be zooms of channels. • ‐ Adjusts the horizontal position OSITION of a zoom trace on the display. The zoom region is highlighted in color on the source trace. Unlike Delay, the position is not calibrated to the trigger ... -
Page 26: Special Features Controls
ETTING TARTED ANUAL Special Features Controls • ‐ This knob adjusts the intensity of your trace. NTENSITY Pushing the button toggles between WaveStream fast‐ viewing mode and real‐time mode. • ‐ This lamp lights when the TREAM oscilloscope is displaying in WaveStream fast‐viewing mode. • ‐ This push button turns on the cursors, then URSOR cycles through the four different cursor types with each additional push: • ‐ This dual‐function knob controls the DJUST INE placement of the top or left cursor. When the knob is in Cursor mode, the CURS lamp is lit. When you click in any data entry field in any dialog, the knob automatically switches from cursor placement mode to adjustment mode, and the ADJ lamp lights. This allows you to dial in fine‐grained values. When you close the dialog, the knob reverts to cursor placement mode. • ‐ This dual‐function knob controls the placement of the bottom DJUST OARSE or right cursor. When the knob is in Cursor mode, the CURS lamp is lit. When you click in any data entry field in any dialog, the knob automatically switches from cursor placement mode to adjustment mode, and the ADJ lamp ... -
Page 27: Understanding Display Information
Xi-A MXi-A S UNNER ERIES NDERSTANDING ISPLAY NFORMATION The WaveRunner Xi‐A oscilloscope’s display contains valuable information about the current settings of your Vertical (channel), Horizontal (Timebase), and Trigger controls. In addition, there are many shortcuts that are available by using the touch screen capability of your display to quickly access information or to open dialogs. Top Menu Bar (File Menu) The top menu bar provides access to various software dialogs. It is very similar to the File menu on any Windows program. For common oscilloscope operations, you don’t need to use the top menu bar (since you can access most dialogs from the Front Panel or from the Descriptor Labels). However, it is the only way to access setup or other dialogs for the following: • Display Setup • Save or Recall Waveform • Save or Recall Setups • Print Setup • Vertical (Channel), Horizontal, or Trigger Status • Memory (Reference Waveform) Setup • Pass/Fail Setup • Utilities and Preferences Setup • Help Access At the right‐hand end of the top menu bar is an Undo button. WRXi-A-GSM-E Rev A... -
Page 28: Grid Area
ETTING TARTED ANUAL This button appears after the AutoSetup front panel button is pressed, and after Zooming. If you want to perform an Undo operation, it must be the very next operation after you perform the Autosetup or Zoom operation. Grid Area The grid area is divided into 8 vertical divisions and 10 horizontal divisions just like any other oscilloscope. There are several indicators on the grid to help you understand the following: • Trigger Delay ‐ This indicator is located along the bottom edge of the grid. Trigger delay allows you to see the signal prior to the trigger time. All trigger delay values (including post‐trigger delay, shown here) are displayed in the Timebase Descriptor Label. Zero delay is the horizontal center of the oscilloscope display. The default setting (Time) is for the delay to be read out in seconds, and to move proportionately when the timebase knob is turned. If you want to set delay (Div) to a fixed position on the grid and then have it stay fixed as the timebase changes, go to Utilities, Preferences, Acquisition. • Post‐trigger Delay ‐ This is indicated by a left‐ pointing arrow below‐left of the grid. Pre‐trigger delay is indicated by a right‐pointing arrow below‐ right of the grid. • Trigger Level ‐ This indicator is located at the right edge of the grid. It tracks the trigger level as you reposition the trace up or down, or change scale. When triggering is stopped, a hollow arrow indicates where the new level ends up when triggering resumes. Push the L knob to reset the level to 50%. EVEL WRXi-A-GSM-E Rev A... -
Page 29: Trace Descriptors
Xi-A MXi-A S UNNER ERIES • Zero Volts Level ‐ This indicator is located at the left edge of the grid. Change the zero volts level by turning the V knob. Push the knob to ERTICAL FFSET reset the indicator to the middle of the grid. Trace Descriptors Vertical and horizontal trace descriptor labels are displayed below the grid. They provide a summary of your channel, timebase, and trigger settings. Adjust these settings by touching the respective label (its corresponding setup dialog is then shown). Channel trace labels show the vertical settings for the trace, as well as cursor information if cursors are in use. In the title bar of the label are also included indicators for (SinX)/X interpolation, waveform inversion (INV), deskew (DSQ), coupling, bandwidth limiting (BWL), and averaging (AVG). These indicators have a long and short form: Besides channel traces, math and memory trace labels are also displayed. Labels are displayed only for traces that are turned on. As a visual aid, an active channel (i.e., the one whose settings can be adjusted by the front panel knobs) is displayed in solid color. The title bar of the TimeBase label shows the trigger delay setting. Time per division and sampling information is given below the title bar. The title bar of the Trigger label shows the trigger mode: Auto, Normal, or Stopped. Below the title bar is given the coupling (DC), trigger type (Edge), source (C1), level (0 mV), and slope (Positive). Shown below the Timebase and Trigger labels is value information for horizontal cursors, including the time ... -
Page 30: Dialog Boxes
ETTING TARTED ANUAL Dialog Boxes The lower portion of the screen contains dialogs where information is shown, selections are made, and data is input. Typically, the dialogs are organized into tabular displays, subtabs, or pop‐up dialogs. The dialog area is controlled by touch screen buttons and front panel buttons. The following Dialog Area controls also provide assistance when entering data: Message Bar The message bar continually displays the time and date. It also displays oscilloscope status and error messages. LTERNATIVE CCESS ETHODS The front panel and display controls provide the most common ways to access your oscilloscope’s capability. However, the instrument often gives you more than one way to access dialogs and to make changes. Top Menu Bar If you prefer to drive the oscilloscope with the familiarity of Windows, you might prefer to access dialogs from the menu bar at the top of the display. This opens dialog boxes at the bottom of the screen, where adjustments can be made. The dialog area occupies the bottom one‐third of the display. Expand the signal display area by minimizing each dialog by touching the Close tab at the right of the dialog box. In some limited cases, the menu bar is the only way to access certain functionality, but generally speaking, the most common oscilloscope functionality can be controlled from the front panel. Mouse and Keyboard Operation In the procedures, we focus on touch‐screen operation. But if you have a mouse connected to the instrument, you can click on objects instead of touching them. Likewise, if you have a keyboard connected, you can use it to enter data instead of using the virtual keyboard provided by the instrument. ‐ ISPLAYING IGNALS RACES ERTICAL ... - Page 31 Xi-A MXi-A S UNNER ERIES If the signal is not on the grid, press the AUTO trigger button and adjust Horizontal and Vertical front panel controls to adjust the settings and display the signal, or simply press the AUTOSETUP button to quickly bring most repetitive signals onto the grid. If you need to change probe attenuation, coupling, or bandwidth limiting, open the channel setup dialog for channel 1 by touching the descriptor label for channel 1. Press this button twice if it is not the active trace. Or, use the Vertical Channel 1 Setup selection from the menu bar to open the channel 1 setup dialog: At this point, the following dialog is shown at the bottom of the display, and the grid area shortens until this dialog is closed (by touching the Close button on the upper right hand corner of this dialog). WRXi-A-GSM-E Rev A...
-
Page 32: Coupling
ETTING TARTED ANUAL Coupling Coupling choices are as follows: • DC 50 Ω • GROUND • DC 1 MΩ • AC 1 MΩ Select coupling by touching inside the Coupling field and choosing a coupling mode from the pop‐up menu. Note: The coupling choices for a channel change if a ProBus probe is connected to a channel. Deskew Deskew allows you to compensate for different lengths of cables, probes, or anything else that might cause timing mismatches between signals. Connect all probes to the desired channels, then probe a common signal with each probe and adjust for timing differences using Deskew. Probe Attenuation If you use a LeCroy ProBus compatible active probe, or a probe compatible with Probe Ring, the attenuation is automatically set by the oscilloscope. If it is not automatically set, select a value here by touching inside the Probe Atten field selecting a value from the pop‐up menu. Bandwidth Limiting You may sometimes want to limit high frequency noise on a very low bandwidth input signal. If this is the case, you can limit the channel bandwidth to less than the full bandwidth of the oscilloscope. Select a different bandwidth by touching inside the Bandwidth field and selecting a value from the pop‐up menu. Averaging Your Signal The WaveRunner Xi‐A oscilloscope allows you the opportunity to continuously average your signal to reduce signal noise and aid in signal evaluation. If you want to use averaging, select a value here by touching inside the Averaging field and entering a value up to 1 million sweeps on the pop‐up keypad. WRXi-A-GSM-E Rev A... -
Page 33: Interpolation Settings
Xi-A MXi-A S UNNER ERIES Interpolation Settings Linear interpolation, which inserts a straight line between sample points, is best used to reconstruct straight‐edged signals such as square waves. (Sinx)/x interpolation, on the other hand, is suitable for reconstructing curved or irregular wave shapes, especially when the sample rate is 3 to 5 times the system bandwidth. Noise Filtering (ERES) The instrument's enhanced resolution feature improves vertical resolution by a fixed amount for each filter. This real increase in resolution occurs whether or not the signal is noisy, or your signal is single‐shot or repetitive. The signal‐to‐noise ratio (SNR) improvement you gain is dependent on the form of the noise in the original signal. The enhanced resolution filtering decreases the bandwidth of the signal, filtering out some of the noise. Using Toolbar Shortcuts These toolbar shortcuts can be used to perform specific actions for the channel corresponding to the current setup dialog. For more information on Measure, Zoom, Math, and Memories (Reference Waveforms), refer to the section dealing with that subject. Opens a Measurement selection pop‐up menu. You can then select up to 6 parameters (measurements) for the active channel from this menu without leaving the Channel Setup dialog. The parameter automatically appears below the grid. Creates a zoom trace of the channel signal. The zoom trace becomes active, and you can use the Vertical and Horizontal controls to modify its scale and position. Opens a Math selection pop‐up menu. You can then select a math function for the active channel from this menu without leaving the Channel Setup dialog. The Math trace is then displayed in its own grid. Copies the channel trace into its corresponding Memory (Reference Waveform) location. For instance, C1 is loaded into M1, C2 is loaded into M2, etc. Automatically performs a vertical scaling that fits the waveform into the grid. Opens a Labeling pop‐up menu that allows user‐defined labels tied to the waveform. WRXi-A-GSM-E Rev A... - Page 34 ETTING TARTED ANUAL Another example is these buttons that appear at the bottom of the Measure Px dialogs. Each button opens a menu from which to choose a math trace (F1 to Fx) to display the functions named in the buttons: By using these buttons you can remain in the Measure dialog to set up other options. The number of parameters and math traces available depends on the software options loaded on your scope. WRXi-A-GSM-E Rev A...
-
Page 35: Turning O N Traces
Xi-A MXi-A S UNNER ERIES URNING N RACES 1. Turn on a channel trace by pushing a front panel channel select button (displaying the trace label for the corresponding input channel). While this turns on the trace, it leaves the current dialog displayed. If you want to also display the vertical setup dialog for the channel trace, touch the trace label twice. The first touch activates the channel, while the second opens its setup dialog. The appearance of the selected trace label becomes a solid color when active: 2. Turn on a math function trace by touching Math Math Setup... on the drop‐down menu. Touch the On checkbox for the trace you want to activate. 3. You can also turn on traces for math functions, parameters, and memory traces without leaving the Vertical Adjust dialog by touching the icons at the bottom of the Vertical Adjust dialog. WRXi-A-GSM-E Rev A... -
Page 36: Vertical Settings And Channel Controls
ETTING TARTED ANUAL Whenever you turn on a channel or math trace from the menu bar at the top of the screen, the dialog at the bottom of the screen automatically switches to the vertical setup or math setup dialog for that selection. You can then configure your traces. The channel or math trace number appears in the tab of the appropriate dialog, signifying that all controls and fields are dedicated to the selected trace: ERTICAL ETTINGS AND HANNEL ONTROLS Adjusting Sensitivity 1. Touch Vertical Channel 1, for example, from the menu bar. Touch inside the Trace On checkbox to display the trace. Or, use the VERTICAL front panel buttons to turn it on. 2. Turn the volts per division knob. Or you can touch inside the Volts/Div field and type in a value using the pop‐up keypad. WRXi-A-GSM-E Rev A... -
Page 37: Adjusting The Waveform's Position
Xi-A MXi-A S UNNER ERIES 3. The voltage that you set is displayed in the Volts/Div field and in the trace descriptor label. Adjusting the Waveform's Position Turn the vertical offset adjust knob directly above the channel button whose waveform you want to move vertically. Or you can touch inside the Offset field and type in a value on the pop‐up keypad. Set the vertical offset to zero by pressing the vertical offset adjust knob for the channel you want to adjust. AMPLING ODES Depending on your timebase, the following sampling modes are available: WaveStream Mode ‐ This fast viewing mode provides brightness‐ graded intensity with a decay time similar to the action of phosphor on an analog screen. WaveStream mode operates at up to 10 GS/s with an update rate up to 8000 waveforms/second for better capture of higher frequency abnormal events. Real Time Mode ‐ A single‐shot (real time) acquisition is a series of digitized voltage values sampled on the input signal at a uniform rate. Sequence Mode ‐ In sequence mode, the complete waveform consists of a number of fixed‐size segments acquired in single‐shot mode Roll Mode ‐ This mode is invoked automatically for slow acquisitions when the time per division is 200 ms/div or greater. Roll mode samples at 2 MS/s (depending on memory availability). RIS Mode ‐ Random Interleaved Sampling is an acquisition technique ... -
Page 38: Using Wavestream Fast Viewing Mode
ETTING TARTED ANUAL Using WaveStream Fast Viewing Mode Adjusting Trace Intensity The I knob adjusts the brightness of NTENSITY your trace. Pushing the button toggles between WaveStream fast‐viewing mode and real‐time mode. IMEBASE ETUP Set up the timebase by using the front panel Horizontal controls, just as for analog oscilloscopes. WRXi-A-GSM-E Rev A... -
Page 39: Channel Combinations
Xi-A MXi-A S UNNER ERIES Channel Combinations Channels can be combined to increase sample rate or memory (WaveRunner 44Xi can only be interleaved to maximize memory, not sample rate) in order to capture and view a signal in all its detail. When you combine channels, uncombined channels like EXT BNC remain available for triggering, even though they are not displayed. In 2‐channel operation, channels 2 and 3 are active. In Auto operation, you can use channel 1 or 2, and channel 3 or 4. On the paired channels the maximum sampling rate is doubled and the record length is greatly increased: Ch 1 & Ch 3 10 GS/s Ch 1 & Ch 4 10 GS/s Ch 2 & Ch 3 10 GS/s Ch 2 & Ch 4 10 GS/s As you can see, sampling can be maximized to 10 GS/s for any combination of two channels, except a combination of channels 1 and 2, or channels 3 and 4, which yield 5 GS/s. The basic rule is to choose either channel 1 or 2 for your first input, or either channel 3 or 4 for the second input. Refer to Acquisition Modes in the specifications for maximum sample rates. Combining Channels • Touch the Timebase descriptor label. • Under Active Channels, touch 4, 2 or Auto. The maximum sample rate is shown alongside each button. WRXi-A-GSM-E Rev A... -
Page 40: Triggering
ETTING TARTED ANUAL RIGGERING Simple Triggers Edge Trigger on Simple Signals The instrument uses many waveform capture techniques that trigger on features and conditions that you define. These triggers fall into two major categories: • Standard Triggers ‐ activated by basic waveform features or conditions such as a positive or negative slope, and hold‐off • SMART Triggers ‐ sophisticated triggers that enable you to use basic or complex conditions for triggering. Use Edge Triggers for simple signals, and the SMART Triggers for signals with rare features, like glitches. Controlling Edge Triggering : ORIZONTAL Turn the Delay knob in the HORIZONTAL control group to adjust the trigger's horizontal position. Or, touch inside the Delay field in the timebase setup dialog and enter a value, using the pop‐up keypad. The trigger location is shown by a marker below the grid Post‐trigger delay is indicated by a left‐pointing arrow below‐left of the grid. The time value is given in the title line of the TimeBase label below‐right of the grid. ERTICAL Turn the L knob in the TRIGGER control group to EVEL adjust the vertical threshold of the trigger or the ... -
Page 41: Edge Trigger Setup
Xi-A MXi-A S UNNER ERIES Alternatively, on the Trigger dialog, touch the Level field and provide a value (using the pop‐up numeric keypad). Quickly set a level of zero volts by pushing the Level button on the front panel. Edge Trigger Setup 1. Push the front panel trigger S ETUP button. 2. Touch the Edge trigger button. 3. Touch inside the Source field and select an input from the pop‐up menu. 4. C1 through C4 are abbreviations for Channel 1 through Channel 4. 5. Ext and Ext/10 allow you to trigger on the External Input of the oscilloscope. Ext input is +/‐0.5 V. Ext/10 input is +/‐5.0 V. 6. Line is for triggering on the Positive or Negative excursion of the AC power line. 7. Touch inside the Level field. In the pop‐up numeric keypad, enter a ... - Page 42 ETTING TARTED ANUAL 8. Touch inside the Coupling field and select a coupling type. • DC – All the signal’s frequency components are coupled to the trigger circuit for high frequency bursts or where the use of AC coupling would shift the effective trigger level. • AC – The signal is capacitively coupled. DC levels are rejected, and frequencies below 50 Hz are attenuated. • LFREJ ‐ The signal is coupled through a capacitive high‐pass filter network, DC is rejected and signal frequencies below 50 kHz are attenuated. For stable triggering on medium‐to‐high frequency signals. • HFREJ ‐ Signals are DC coupled to the trigger circuit and a low‐pass filter network attenuates frequencies above 50 kHz. This is used for triggering on low frequencies. 9. Choose Positive, Negative, or Window slope. 10. Window slope sets a threshold above and below the trigger level beyond which the signal must pass to generate a trigger. The slope can be either positive or negative. WRXi-A-GSM-E Rev A...
-
Page 43: T Riggering 3
Standard Triggers Edge Use Edge trigger for simple, repetitive signals. This trigger is activated by basic waveform features or conditions such as a positive or negative slope, and hold‐off Width Width trigger allows you to define a positive or negative‐going pulse width bounded by a voltage level, above or below where a trigger occurs. Or you can specify a pulse width and voltage range, in or outside where a trigger occurs. Qualified The Qualified (A‐B) trigger allows arming of the trigger on Event A and triggering on Event B. If the arming event is a Pattern that occurs once (Pattern) or that occurs and stays satisfied (PatState), then the triggering event can be an Edge, Width, Glitch, or Interval condition. This functionality is identical to LeCroy's previous Qualify and State triggers, but presented in a different UI. Pattern Pattern trigger enables triggering on a logical combination (pattern) of five inputs: CH1, CH2, CH3, CH4, EXT. You have a choice of four Boolean operators (AND, NAND, OR, NOR), and you can stipulate the high or low voltage logic level for each input independently. TV TV triggers provide stable triggering on standard or custom composite video signals. Use them on PAL, SECAM, or NTSC systems. Use CUSTOM setup for other standards. Standard HDTV trigger supports 1080i, 1080p, and 720p formats. Serial Serial trigger allows a serial trigger condition to be set from within the oscilloscope, using an easy‐to‐understand interface. Note: LeCroy offers a wide range of optional serial data triggering ... -
Page 44: Smart Triggers
ETTING TARTED ANUAL SMART Triggers SMART Triggers are defined as follows: Glitch Glitch trigger is a simpler form of Width trigger. Use Glitch trigger when you want to define a fixed pulse‐width time or time range only. Glitch trigger makes no provision for voltage levels or ranges. Interval While Glitch trigger performs over the width of a pulse, Interval trigger performs over the width of an interval: the signal duration (the period) separating two consecutive edges of the same polarity (positive to positive or negative to negative). Use interval trigger to capture intervals that fall short of, or exceed, a given time limit. In addition, you can define a width range to capture any interval that is itself inside or outside the specified range, i.e. it can be used as an Exclusion trigger by interval. Dropout Used primarily in single‐shot applications, and usually with a pre‐ trigger delay, Dropout trigger can detect lost signals. The trigger is generated at the end of the timeout period following the last trigger source transition. You can select a timeout period from 2 ns to 20 s. Runt The runt trigger is programmed to occur when a pulse crosses a first threshold line and fails to cross a second threshold line before recrossing the first. You can select both voltage thresholds within a time range of 100 ps to 20 s. Other defining conditions for this trigger are the edge (triggers on the slope opposite to that selected) and runt width. Slew Rate Slew rate trigger activates a trigger when the rising or falling edge of a pulse crosses two threshold levels: an upper level and a lower level. The pulse edge must cross the thresholds faster or ... -
Page 45: Erial Rigger Nd Ecode
Xi-A MXi-A S UNNER ERIES ERIAL RIGGER ND ECODE A variety of Serial Data standards, such as Inter‐IC (I C) , Serial Peripheral Interface (SPI), Controller Area Network (CAN), Local Interconnect Network (LIN), and UART‐ RS‐232 govern communication between microprocessors and peripherals. The serial triggers are integrated into the oscilloscope ‐ no external hardware is used ‐ and is selected through the normal oscilloscope trigger menus. I C, SPI, CAN, LIN, UART‐ RS‐232 signals are input to the oscilloscope through normal passive or active probes, such as LeCroy’s ZS Series of high impedance active probes. Decoding is accessed from the Analysis pull‐down menu in the menu bar. The decoding is overlaid on top of the appropriate channel, and is intuitively presented and color‐ coded for quick understanding. Included is a Search capability for specific messages and a table to display protocol data in summary form underneath the oscilloscope grid. Accessing Serial Decode Triggers Serial triggers can be accessed in two ways: • Touch the Trigger Descriptor Box in the lower right hand corner of the oscilloscope display. OR • Touch Trigger → Trigger Setup from the Menu Bar. On the Trigger dialog, touch Serial on the Type section. Select the appropriate serial trigger. The menu automatically changes to a different tab in the Trigger dialog reflecting the selected standard. WRXi-A-GSM-E Rev A... -
Page 46: Serial Decode And Decode Setup
ETTING TARTED ANUAL Serial Decode and Decode Setup These dialogs provide the ability to set the oscilloscope up for protocol decoding of serial data messages, with display of the protocol data overlaid on the signal. They also allow quick and easy access to oscilloscope zooming, searching, table display, and table export. The serial decode and decode setup dialogs are accessed in any the following ways: 1. Touch Analysis Serial Decode... from the menu bar. 2. The Serial Decode summary dialog is shown and provides access to Decode Setup. • Touch the Channel or Memory Descriptor Box to open the respective dialog box, and touch the Decode button in the bottom toolbar. • Touch a Channel, Memory, or Math trace to open a pop‐up dialog that displays a shortcut to the Decode Setup dialog box WRXi-A-GSM-E Rev A... -
Page 47: Triggerscan
Xi-A MXi-A S UNNER ERIES Please refer to the Low Speed Serial Data Trigger manual or the Online Help on your oscilloscope for Serial Trigger information and details. TriggerScan TriggerScan is a debugging tool that helps you quickly find rare waveform glitches and anomalies. With TriggerScan, you can build a list of trigger setups to look for rare events and automatically sequence through each one. TriggerScan can use any type of trigger setup available including edge, width, and qualify as well as Smart Triggers (such as, glitch and runt triggers). TriggerScan automates two key processes in triggering rare events: 1. Trains the system by looking at normal acquired waveforms. During the training, the oscilloscope analyzes the waveforms to determine what waveforms normally look like. Using this information, it generates a list of smart trigger setups to trigger on abnormal situations. 2. Loads the smart trigger setups from the Trainer and cycles through these. As triggers occur, they are overlaid on the screen. All acquisition settings are preserved and you can use all the functions of the oscilloscope to find the root cause of these anomalies including, WaveScan, Histograms, and advanced analysis. Training TriggerScan The TriggerScan Trainer inspects a currently acquired waveform and automatically builds a list of common trigger setups used to find rare events. PLEASE NOTE THE FOLLOWING: • You must acquire and display at least 3 cycles of a signal before running the Trainer. • You should run the Trainer if you want to change the trigger types or if you change the channel or signal. 1. Touch Trigger Trigger Setup from the menu bar. 2. On the Trigger dialog, click the TriggerScan tab. 3. -
Page 48: Starting Triggerscan
ETTING TARTED ANUAL Starting TriggerScan After you have run the Trainer, the Trigger List displays a list of smart trigger setups. You can add or remove trigger setups. You can also update the selected smart trigger setup. Once you have made any changes to the Trigger List, you are ready to start scanning. 1. Touch Trigger Trigger Setup from the menu bar. 2. On the Trigger dialog, click the TriggerScan tab. 3. If you want to add a new trigger setup, touch the Trigger tab and set the new trigger. Then, touch the Add New button to add the new trigger to the Trigger List. 4. If you want to delete a trigger setup, highlight the setup in the Trigger List and touch the Delete Selected button. Note: If you want to delete all trigger setups in the Trigger List, touch the Delete All button. 5. If you want to replace the selected trigger setup with the current trigger setup, highlight the setup in the Trigger List and touch the Update Selected button. 6. Once you have made any changes to the Trigger List, touch Start Scan. The oscilloscope automatically sequences through all the trigger setups. PLEASE NOTE THE FOLLOWING: • You can tune the dwell time that the scope will wait before loading the next trigger setup using the Dwell Time data entry field. • If you have Persistence display mode enabled, all trigger events are recorded on the display. Refer to the Persistence Setup topic for instructions on enabling Persistence display mode. • If you want TriggerScan to stop when the scope triggers next, check the Stop On Trigger checkbox. You can use this to isolate specific trigger setups. ... -
Page 49: Waveform Measurements
Xi-A MXi-A S UNNER ERIES Touch the Browse button and select a location and file name. Finally, make sure you touch the Save Setup button. Note: You can load previously saved TriggerScan setups by touching the Browse button, locating the file, and then clicking Load Setup. AVEFORM EASUREMENTS Measuring with Cursors Overview Cursors are important tools that aid you in measuring signal values. Cursors are markers — lines, cross‐hairs, or arrows — that you can move around the grid or the waveform itself. Use cursors to make fast, accurate measurements and to eliminate guesswork. There are two basic types: • Horizontal (Time or Frequency) cursors are lines that you move horizontally along the waveform. Place them at a desired location along the time axis to read the signal’s amplitude at the selected time. • Vertical (Voltage) cursors are lines that you move vertically on the grid to measure the amplitude of a signal. Cursor Measurement Icons The Show icons depict what is being measured for each measurement mode. Absolute Each cursor locates a point on the waveform. The cursor values can be read in the descriptor label for the trace. Use the Position fields at the right side of the dialog to place the cursors precisely. Delta This is the difference in Y values. The value can be read in the descriptor label for the trace. Abs+Delta Displays absolute and delta cursors together. -
Page 50: Cursors Setup
ETTING TARTED ANUAL Cursor information is displayed in the channel, math, zoom, and memory trace descriptor labels. It is also displayed below the Timebase and Trigger descriptor labels: Cursors Setup Quick Display At any time, you can change the display of cursor types (or turn them off) without invoking the Cursors Setup dialog, as follows: 1. Touch Cursors Off, Horizontal Abs, Horizontal Rel, Vertical Abs, or Vertical Rel from the menu bar. 2. The cursors shown assume previous setup positions. If you want to change their position or measurement mode touch Cursors Cursors Setup from the menu bar. Full Setup 1. Touch Cursors Cursors Setup from the menu bar. The Standard Cursors dialog opens. 2. In the dialog area, touch the Cursors On checkbox to display them. WRXi-A-GSM-E Rev A... -
Page 51: Arameter Easurements
Xi-A MXi-A S UNNER ERIES 3. Touch one of the Horizontal or Vertical mode buttons: Relative or Absolute. 4. If you chose a Relative mode, also touch a readout parameter button: Y position, delta Y, Y position plus delta, or slope. 5. If you chose a Relative mode, touch inside the Position 1 and Position 2 fields and type in a value for each cursor. You can also use the Cursors knobs on the front panel to place the cursors. If you chose an Absolute mode, do the same for your single cursor. 6. If you chose a Relative mode and you would like both cursors to move in unison as you adjust the position, touch the Track check box to enable tracking. 7. Push the front panel Cursor Type button to quickly change the type of cursors in use. ARAMETER EASUREMENTS Waveform analysis typically begins with the measurement of parameters. Parameter measurement tools determine a wide range of waveform properties. Use them to automatically calculate many attributes of your waveform, like rise time, rms voltage, and peak‐to‐peak voltage, for example. WRXi-A-GSM-E Rev A... -
Page 52: Measure Modes
ETTING TARTED ANUAL There are parameter modes for the amplitude and time domains, custom parameter groups, and parameters for pass and fail testing. You can make common measurements on one or more waveforms. Measure Modes The selections for Measure Mode allow you to quickly apply parameters for standard vertical and standard horizontal setups, and custom setups. Pass and fail parameters can be customized, too. You can accumulate and display statistics on each parameter's average, lowest, highest, and standard deviation. Standard Vertical Parameters These are the default Standard Vertical Parameters: mean Mean sdev Standard deviation Maximum min. Minimum ampl Amplitude pkpk Peak‐to‐peak Standard Horizontal Parameters These are the default Standard Horizontal Parameters: freq Frequency period Period width Width rise Risetime fall Fall time duty duty cycle... -
Page 53: Statistics
Xi-A MXi-A S UNNER ERIES A downward pointing arrow indicates an underflow condition. An upward pointing arrow indicates an overflow condition. An upward‐and‐downward pointing arrow indicates an underflow and overflow condition. Statistics You can turn on statistics by checking the Statistics On checkbox in the Measure main dialog. A table of values is then displayed below the grid. ™ DVANCED EARCH AND NALYSIS LeCroy’s WaveScan Advanced Search and Analysis tool can be used in the following ways: • Capture and Search ‐ Take a single acquisition, set a search mode, and apply a filter (i.e., create a search condition). • Scan ‐ Set a search mode, apply a filter, and take multiple acquisitions to scan for unusual events (i.e., create a software condition for a hardware trigger). • Analyze ‐ Use ScanOverlay and ScanHisto to further analyze the filtered events. You can select from more than 20 search modes (frequency, rise time, runt, duty cycle, etc.), apply a search condition (slope, level, threshold, hysteresis), and begin scanning in a post‐acquisition environment. Since the scanning modes are not simply copies of the hardware triggers, the capability is much greater. For instance, there is no frequency trigger in any oscilloscope, yet WaveScan allows frequency to be quickly scanned for. You can accumulate a data set of unusual events that are separated by hours or days, enabling faster debugging. The events are time stamped and indexed in a table from which you can select them for viewing individually. You can also set actions to occur automatically when unusual events are found: stop the acquisition, emit an audible beep, output a pulse, print the screen, save ... - Page 54 ETTING TARTED ANUAL • Zoom view allows you to expand a waveform feature vertically and horizontally. This can be used to apply further processing, to store it, or to apply a descriptive label to the feature. • Scan Histogram provides a statistical view of edges meeting your search criteria. • Scan Overlay places all captured edges one on top of the other in a separate grid. You can apply persistence in this view. Note: The number of grids displayed varies from one to three grids depending on which views are enabled. WaveScan handles this function automatically, and there is no option to move traces from one grid to another, as would be the case under normal (non‐WaveScan) operation. WRXi-A-GSM-E Rev A...
-
Page 55: Wavescan Search Modes
Xi-A MXi-A S UNNER ERIES WaveScan Search Modes Search modes are used to locate anomalies during acquisition. • Edge ‐ for detecting the occurrence of edges, selectable slope, and level • Non‐monotonic ‐ for detecting threshold re‐crosses, selectable slope, hysteresis, and level • Runt ‐ for detecting pulses that fail to cross a threshold, selectable polarity, and thresholds • Measurement ‐ for defining a measurement with a filtering (search or scan) criteria Parameter Measurements In WaveScan, parameter measurements are used to set up a filtering (search or scan) criteria. When WaveScan finds an event that meets the measurement and filter criteria, it highlights the area (search and scan) and (optionally) can perform an action (scan). The number of parameters available depends on the options loaded on your instrument. Measurements are made only on the events defined by your filter (search criteria). A Filter Wizard is provided to quickly set up a measurement to find rare events, such as ±1, 3, or 5 sigma. Sampling Mode Whenever WaveScan is enabled, the instrument reverts to Real‐time sampling mode. ARAMETER NALYSIS Trend Measurements A trend of a measurement parameter is a line graph with a measurement point from each subsequent signal acquisition plotted on the graph. 1. Touch Measure Measure Setup… from the menu bar. 2. Touch one of parameter tabs P1 through P6. WRXi-A-GSM-E Rev A... -
Page 56: Track View
ETTING TARTED ANUAL 3. Touch inside the Source1 field and select an input waveform from the pop‐ up menu. 4. Touch inside the Measure field and select a parameter from the pop‐up menu. 5. Touch the Trend button at the bottom of the dialog. Track View A Track View of a measurement parameter is a unique and specialized graph that is time correlated to the signal being measured. The Track View applies to a single‐ shot acquisition and plots the variation of a parameter (such as width) for each cycle in time‐correlated sequence with the waveform. Track View lets you locate a problematic signal feature including width, period, amplitude, and more. Set up a Track View by following the previous steps, except touch the Track button at the bottom of the dialog. JitterTrack View A JitterTrack View is similar to a Track View but is applicable to a specialized set of timing parameter measurements used to analyze cycle‐to‐cycle timing variation, including clock jitter, and to aid in tracking the variation to its source. JitterTrack is available with the optional XMAP or JTA2 WaveShape Analysis packages. ISTOGRAMS Creating and Viewing a Histogram Note: The number of sweeps comprising a histogram is displayed in the bottom line of the trace descriptor label. Single Parameter Histogram Setup ROM EASURE IALOG 1. Touch Measure Measure Setup from the menu bar. 2. - Page 57 Xi-A MXi-A S UNNER ERIES 5. Touch inside the Measure field and select a parameter from the pop‐up menu. 6. Touch the Histogram button at the bottom of the dialog. 7. Touch a math trace in which to place the resulting histogram, and then close the pop‐up menu. 8. Touch the math trace label for the math trace you just created. 9. In the dialog to the right, touch the Histogram tab. 10. Under Buffer, touch inside the #Values field and enter a value. 11. Under Scaling, touch inside the #Bins field and enter a value from 20 to 2000. 12. Touch the Find Center and Width button to center the ...
-
Page 58: From Math Dialog
ETTING TARTED ANUAL From Math Dialog 1. Touch Math Math Setup from the menu bar. 2. Touch one of function tabs F1 through Fx. The number of math traces available depends on the software options loaded on your oscilloscope. 3. Touch the Graph button. 4. Touch inside the Source1 field and select a source from the pop‐up menu. 5. Touch inside the Measurement field and select a parameter from the pop‐ up menu. 6. Touch inside the Graph with field and select Histogram from the pop‐up menu. 7. In the dialog to the right, touch the Histogram tab. 8. Under Buffer, touch inside the #Values field and enter a value. 9. Under Scaling, touch inside the #Bins field and enter a value from 20 to 2000. 10. Touch the Find Center and Width button to center the histogram. ... -
Page 59: Viewing Thumbnail Histograms
Xi-A MXi-A S UNNER ERIES Or touch inside the Center, then the Width, fields and enter a value using the pop‐up numeric keypad. 11. Touch inside the Vertical Scale field and select Linear or Linear Constant Max from the pop‐up menu: A linear histogram continues growing as values accumulate. A linear‐constant‐ maximum histogram continually rescales itself and remains well within the grid. Viewing Thumbnail Histograms Histicons are miniature histograms of parameter measurements that appear below the grid. These thumbnail histograms let you see at a glance the statistical distribution of each parameter. 1. Touch Measure then one of the Measure Mode buttons: Std Vertical, Std Horizontal, or My Measure from the menu bar. 2. Touch the Histicons checkbox to display thumbnail histograms below the selected parameters. Note: For measurements set up in My Measure, you can quickly display an enlarged histogram of a thumbnail histogram by touching the Histicon you want to enlarge. The enlarged histogram is shown superimposed on the trace it ... - Page 60 ETTING TARTED ANUAL This math operation is different from the Histogram math operation and is not affected by Center and Width settings made there. ERSISTENCE ISTOGRAM ETUP 1. Touch Math Math Setup on the menu bar. 2. Touch one of function tabs F1 through Fx The number of math traces available depends on the software options loaded on your oscilloscope. 3. Touch inside the Source1 field and select a source from the pop‐up menu. 4. Touch inside the Operator1 field and select Phistogram from the Select Math Operator menu. 5. To the right of the trace dialog, touch the Phistogram tab, then touch inside the Slice Direction field and select Horizontal or Vertical slice from the pop‐up menu. 6. Touch inside the Slice Center field and enter a value, using the pop‐up keypad. 7. Touch inside the Slice Width field and enter a value, using the pop‐up keypad. You can also use the Clear Sweeps and Center Cursor buttons for ...
-
Page 61: Persistence Trace Range
Xi-A MXi-A S UNNER ERIES Persistence Trace Range This math operation has a field where you can enter the percent of the persistence trace population to use in creating a new waveform. Persistence Sigma This math operation has a field where you can enter a scale, measured in standard deviations, by which to create a new waveform. ISPLAY ORMATS Display Setup 1. Touch Display Display Setup on the menu bar. 2. Touch one of the Grid combination buttons. Auto automatically adds or deletes grids as you select more or fewer waveforms to display. 3. Touch inside the grid Intensity field and enter a value from 0 to 100 using the pop‐up keypad. 4. Touch the Grid on top checkbox if you want to superimpose the grid over the waveform. Depending on the grid intensity, some of your waveform may be hidden from view when the grid is placed on top. Undo by un‐checking the Grid on top checkbox. 5. -
Page 62: Sequence Mode Display
ETTING TARTED ANUAL Sequence Mode Display Set up a Sequence Mode display by first enabling Sequence mode in the Timebase Horizontal dialog. A Num Segments value must also be provided as follows: 1. Touch the Timebase descriptor label. 2. In the Timebase dialog, touch the Sequence mode button. 3. Select the Sequence tab. Under Acquisition Settings, touch inside the Num Segments field and enter a value from 2 to 500. 4. Under Touch inside the Timeout field and enter a value from 10 ms to 100 s. Then check the Enable Timeout checkbox. 5. Under Display Settings, touch inside the Display Mode field and select a mode from the pop‐up menu. Note: The maximum value that you can enter for Starting at depends on the Num Segments value you entered under Acquisition Settings. It also depends on the Num Seg Displayed value you entered. For example, if you had entered a value of 500 in Num Segments, and a value of 10 in Num Seg Displayed, the maximum value you can enter as a starting segment is 491so that 10 segments can be seen. WRXi-A-GSM-E Rev A... -
Page 63: Persistence Setup
Xi-A MXi-A S UNNER ERIES Persistence Setup The analog Persistence feature displays your waveform and reveals its anomalies for a repetitive signal. Use Persistence to accumulate on‐screen points from many acquisitions to see your signal change over time. The instrument persistence modes show the most frequent signal path three‐dimensionally in intensities of the same color, or graded in a spectrum of colors. Saturation Level When you select Analog mode from the Persistence dialog, each channel is assigned a single color. As a persistence data map develops, different intensities of that color are assigned to the range between a minimum and a maximum population. The maximum population automatically gets the highest intensity, the minimum population gets the lowest intensity, and intermediate populations get intensities in between these extremes. See the on‐line Help for more information. Color mode persistence, selected by touching Color, works on the same principle as the Analog persistence feature, but instead uses the entire color spectrum to map signal intensity: violet for minimum population, red for maximum population. A saturation level of 100% spreads the intensity variation across the entire distribution. At lower saturation levels, the intensity saturates (becomes the brightest color) at the percentage value specified. Lowering this percentage causes the pixels to be saturated at a lower population, and makes visible those rarely hit pixels not seen at higher percentages. 3-Dimensional Persistence By selecting 3d, you can create a topographical view of your waveform from a selection of shadings, textures, and hues. The advantage of the topographical view is that areas of highest and lowest intensity are shown as peaks and valleys, in addition to color or brightness. The shape of the peaks (pointed or flat) can reveal further information about the frequency of occurrences in your waveform. The instrument also gives you the ability to turn the X and Y axes of the waveform through 180° of rotation from ‐90° to +90°. ... -
Page 64: Show Last Trace
ETTING TARTED ANUAL Show Last Trace For most applications, you may not want to show the last trace because it is superimposed on top of your persistence display. Resolve this by turning off Show Last Trace by touching the checkbox. However, if you are doing mask testing and want to see where the last trace is falling, turn Show Last Trace on. WRXi-A-GSM-E Rev A... -
Page 65: Zooming Waveforms
Xi-A MXi-A S UNNER ERIES Zooming Waveforms The Zoom button appears as a standard button at the bottom of the channel Cx Vertical Adjust setup dialog if you want to create a zoom trace of your input waveform. The zoom trace created by this method is designated Z1 to Z4. The front panel QuickZoom button creates multiple zooms, one for each displayed input channel. The zoom traces created by this method are designated Z1 to Z4. At any time, you can also zoom a portion of a waveform, or multiple waveforms, by touching and dragging a rectangle around any part of the input waveform. The zoom trace sizes itself to fit the full width of the grid. The degree of magnification, therefore, depends on the size of the rectangle that you draw. When you zoom a waveform by this method, a representation of the zoomed area is shown in a thumbnail preview in the Zx dialog. Zooming a Single Channel 1. Touch the channel trace label for a displayed channel. 2. Touch the Zoom button at the bottom of the Cx Vertical Adjust dialog. A zoom trace of the selected channel (one of Z1 to Z4) is created on a separate grid. WRXi-A-GSM-E Rev A... -
Page 66: Zooming By Touch-And-Drag
ETTING TARTED ANUAL 3. Vary the zoom degree by touching Zx trace label (just created). The setup dialog for the zoom trace opens. It shows the current horizontal and vertical zoom factors. 4. If you want to increase or decrease horizontal or vertical zoom in small increments, touch the Var. checkbox to enable variable zooming. Now, with each touch of the zoom control buttons, the degree of magnification changes by a small increment. You can zoom in or out using large, standard increments when touching zoom control buttons by leaving the Var. checkbox unchecked. Set exact horizontal or vertical zoom factors by touching inside the Horizontal Scale/div field and providing a time‐per‐div value (with the pop‐up numeric keypad). Now, touch inside the Vertical Scale/div field and enter a value. 5. Reset the zoom to x1 magnification by touching Reset Zoom in the dialog. Turn off the zoom trace by touching the QuickZoom button or un‐checking the Trace On checkbox. Zooming by Touch-and-Drag 1. Touch and drag a rectangle around any part of an input channel waveform, math trace, or memory trace, or any combination of these. If all ... -
Page 67: Turning Zoom Off
Xi-A MXi-A S UNNER ERIES 2. If the traces are non‐channel, or a combination of channel traces and math or memory traces, a Rectangle Zoom Wizard appears. Select the traces to be zoomed on the pop‐up. Channel zooms are shown on a separate grid. The zoom of the math or memory trace appears on the same grid as the source trace. 3. Turn the front panel zoom Position knobs to adjust the vertical and horizontal position of the zoom. Turn the front panel Zoom knobs to control the vertical and horizontal magnification factor of the zoom. Turning Zoom Off 1. Touch the trace label for the zoom you want to turn off. 2. Touch the Trace On checkbox to delete the check mark and disable the zoom trace. AVE AND ECALL Saving and Recalling Oscilloscope Settings You can save or recall settings to or from hard disk, floppy disk, or LAN locations. ... -
Page 68: Saving Oscilloscope Settings
ETTING TARTED ANUAL Saving Oscilloscope Settings 1. Touch File Save Setup… on the menu bar. Or, press the Save/Recall front panel button, and then touch the Save Setup tab. 2. Save To File by touching inside the Save panel to file field and providing the path to the destination folder. Or, by touching Browse, navigating to the destination folder, and then choosing Save Now. 3. Save Internal Setups on the oscilloscope's hard drive by touching inside a SetupX field and using the pop‐up keyboard to provide a file name. After touching the Save button, the file is put in D:\Internal Setups, and the current date is displayed above the field. WRXi-A-GSM-E Rev A... -
Page 69: Recalling Oscilloscope Settings
Xi-A MXi-A S UNNER ERIES Recalling Oscilloscope Settings 1. Touch File Recall Setup… on the menu bar. 2. Recall From File by touching inside the Recall panel from file field and using the pop‐ up keyboard to provide the path to the source folder. Or by touching Browse to navigate to the source folder, and then choosing Recall Now. 3. Recall settings from the D:\ Internal Setups folder on the oscilloscope's hard drive by touching Recall next to the file for retrieval. WRXi-A-GSM-E Rev A... -
Page 70: Recalling Default Settings
ETTING TARTED ANUAL Recalling Default Settings 1. Touch File Recall Setup… on the menu bar. 2. Touch the button under Recall Default. Saving and Recalling Waveforms Saving Waveforms 1. Touch File Save Waveform... from the menu bar. 2. On the Save Waveform dialog, touch the Save To Memory or File button. WRXi-A-GSM-E Rev A... - Page 71 Xi-A MXi-A S UNNER ERIES 3. Touch inside the Source field and select a source from the pop‐up menu. The source can be any trace. For example, a channel (C1C4), math function (F1F4), or a waveform stored in non‐ volatile RAM (M1M4). 4. Touch inside the Trace Title field if you want to change the default name of your waveforms. Use the pop‐up keyboard to type in the new name. Note: You can change the name but not the sequence number. CAUTION If you use a name that ends in a number instead of a letter, the instrument may truncate the number. This is because, by design, the first waveform is automatically numbered 0, the second 1, etc. For example, if you want to use waveform name XYZ32 but it is not preceded by waveforms XYZ0 through XYZ31, the waveform is renumbered with the next available number in the sequence. If you need to use a number in your waveform's name, it is recommended that you append an alpha character at the end of the number: XYZ32a, for example. 5. If you are saving to file, touch the Data Format field and select a format type from the pop‐up menu. If you select ASCII or Excel, also touch the SubFormat field and select either Time Data or Time & Ampl. Then touch the ...
-
Page 72: Recalling Waveforms
ETTING TARTED ANUAL 6. Touch the Browse button for the Save file in directory field and browse to the location where you want the file saved. The file name is assigned automatically and is shown below the field. 7. Touch Save Now. UTO You can also enable Auto Save from this dialog by touching one of the Auto Save buttons: Wrap (old files overwritten) or Fill (no files overwritten). CAUTION If you select Fill, you can quickly use up all disk space on your hard disk. Recalling Waveforms 1. Touch File Recall Waveform... from the menu bar. 2. On the Recall Waveform dialog, touch the Recall From button. WRXi-A-GSM-E Rev A... -
Page 73: Printing And File Management
Xi-A MXi-A S UNNER ERIES 3. If you selected Memory, touch inside the Source field and select a memory location: M1 to M4. 4. If you selected File, touch inside the Destination field and select a memory location in which to store the file. • Touch inside the Show only files field and select an area to limit the search to: channels, math functions, or memory. • Touch inside the Recall files from directory field and enter the path, using the pop‐up keyboard. Or touch the Browse button to navigate to the file. • Touch inside the Next file will be recalled from field and enter the path, using the pop‐ up keyboard. Or touch the Browse button to navigate to the file. 5. Touch Recall Now. RINTING AND ... -
Page 74: Printing
ETTING TARTED ANUAL Printing Printer Setup 1. Touch File Print Setup... from the menu bar. The Utilities Hardcopy dialog opens. 2. In the dialog area, touch the Printer icon. 3. Under Colors, touch the Use Print Colors checkbox if you want the traces printed on a white background. A white background saves printer toner. Change printer colors in the Preference dialog. 4. Touch inside the Select Printer field. From the touch pad pop‐up choose the printer you want to print to. Touch the Properties button to see your printer setup. 5. Touch the icon for the layout Orientation you want: portrait or landscape. 6. Touch the Grid Area Only checkbox if you do not need to print the dialog area and you only want to show the waveforms and grids. Printing You can print in one of three ways: • Press the Printer button on the front panel • Touch File Print on the menu bar. • Touch the Print button in the Hardcopy dialog WRXi-A-GSM-E Rev A... -
Page 75: Adding Printers And Drivers
Xi-A MXi-A S UNNER ERIES Adding Printers and Drivers Note: If you want to add a printer driver, the driver must first be loaded on the oscilloscope. 1. Touch File Print Setup... on the menu bar. The Utilities Hardcopy dialog opens. 2. In the Hardcopy dialog, touch the Printer icon, then the Add Printer button. 3. Touch Add a printer in the Printers and Faxes window. 4. Follow the instructions displayed in the Add Printer Wizard. Changing the Default Printer 1. If you want to change the default printer, minimize the instrument application by touching File Minimize from the menu bar. 2. Touch the Start button in the task bar at the bottom of the screen. 3. Select Controls, then Printers and Faxes. 4. -
Page 76: Managing Files
ETTING TARTED ANUAL Managing Files Use the instrument's utilities to create waveform files on optional floppy disk, internal hard drive, or network drives. Hard Disk Partitions The instrument's hard disk is partitioned into drive C: and drive D:. Drive C: contains the Windows operating system and the instrument application software. Drive D: is intended for data files. OCUMENTING OUR The WaveRunner Xi LabNotebook feature simplifies the way waveforms, screen captures, and oscilloscope setup files are saved and documented. LabNotebook also provides an easy way to recall your settings with the Flashback feature. And it lets you create reports, showing your screen images, in pdf, html, or rtf output formats. Creating a LabNotebook Entry LabNotebook entries are easily created by selecting LabNotebook from the File menu, then clicking the Create button. Several annotation tools and colors are then put at your disposal to mark up your waveform. When you click Done, your mark‐ups and oscilloscope settings are saved together in a database resident on the instrument. Click the Create Report button to generate a hardcopy format that you can save to a network drive or external media. Or click the E‐mail button to send the report to another location. Use the Flashback feature at any time to recall a Notebook entry, including oscilloscope setup, for further study. ... -
Page 77: Waveform Math
Xi-A MXi-A S UNNER ERIES AVEFORM FFT Setup 1. Touch Math Math Setup on the menu bar. 2. Touch a Math function trace button in the Math dialog: F1 through Fx. Select FFT from the pop‐ up menu. 3. Touch the Single, Dual, Graph, or Web Edit (function of a function) button if the FFT is to be of the result of another math operation. 4. Touch inside the Source1 field and select a channel, memory, or math trace on which to perform the FFT. Touch inside the Operator1 field: Select FFT from the pop‐up menu if you selected Single function. 5. Select another math function from Operator1 if you selected Dual function. ... - Page 78 ETTING TARTED ANUAL Then touch inside the Operator2 field and select FFT from the pop‐up menu. 6. Touch the FFT tab in the right‐hand dialog. 7. In the right‐hand dialog, touch the FFT tab. Choose whether to Truncate or † Zero‐fill the trace display. 8. Touch the Suppress DC checkbox if you want to make the DC bin go to zero. Otherwise, leave it unchecked. 9. Touch inside the Output type field, and make a selection from the pop‐up menu. When the FFT transform size does not match the record length, you can truncate the record and perform an FFT on the shorter record.
- Page 79 Xi-A MXi-A S UNNER ERIES 10. Touch inside the Window field and select a window type. 11. Touch inside the Algorithm field and select either Least Prime or † Power2 from the pop‐up menu. The default algorithm is a least primes algorithm that computes FFTs on transform sizes having lengths that can be expressed as factors of 2 .
-
Page 80: Pass/Fail Testing
ETTING TARTED ANUAL Pass/Fail Testing Comparing Parameters First, touch Analysis Pass/Fail Setup from the menu bar. Each Pass/Fail input (Qx) can compare a different parameter result to a user‐ defined limit (or statistical range) under a different condition. The conditions are represented by these comparison operators: At the touch of a button, test results can also be compared to these standard statistical limits: • current mean • mean + 1 SD • mean + 3 SD In Dual Parameter Compare mode, you can compare parameter results measured on two different waveforms. You can set your test to be true if Any waveform or All waveforms fit the criterion stipulated by the comparison condition. Your setup is conveniently shown in the Summary box of the Qx dialog. For example: WRXi-A-GSM-E Rev A... -
Page 81: Mask Tests
Xi-A MXi-A S UNNER ERIES Mask Tests You have the choice to do mask testing by using an existing mask, or by using a mask created from your actual waveform, with vertical and horizontal tolerances that you define. Existing masks can be loaded from a USB memory stick or from a network. You can set your mask test to be True for waveforms All In, All Out, Any In, or Any Out. For example, if you select All In, the test is False if even a single waveform falls outside the mask. Masks that you create from your waveform can be confined to just a portion of the trace by use of a measure gate. (See Measure Gate for an explanation of how this feature works.) Actions By touching the Stop Test checkbox in the Actions dialog, you can set up the test to end after a predetermined number of sweeps that you decide. You can also decide the actions to occur upon your waveforms' passing or failing, by selecting one or all of the following: Save Saves the waveform to the location that you specify. Stop Stops the test. Alarm Emits a beep. Pulse Emits a variable width and amplitude pulse. Hardcopy Prints an image of the display, saves it to file, or sends an e‐mail. The selection Pulse causes a pulse to be output through the Aux Out connector at the front of the oscilloscope. This pulse can be used to trigger another oscilloscope. You can set the amplitude and width of the pulse as described in Auxiliary Output Signals under Utilities. Depending on your oscilloscope model, you can configure up to 8 pass/fail conditions. The Boolean conditions to determine if your waveform passes are as ... -
Page 82: Setting Up Pass/Fail Testing
ETTING TARTED ANUAL Setting Up Pass/Fail Testing NITIAL ETUP 1. Touch Analysis Pass/Fail Setup from the menu bar. 2. Touch the Actions tab. 3. Touch the Enable Actions checkbox. This causes the actions you select to occur depending on your waveform's passing or failing a test. 4. Touch the Summary View to enable a line of text that shows concisely the status of your last waveform and keeps a running count of how many sweeps have passed. 5. Touch inside the Pass If field, and select a Boolean condition from the pop‐ up menu. WRXi-A-GSM-E Rev A... - Page 83 Xi-A MXi-A S UNNER ERIES 6. If you want to set up the test to end after a finite number of sweeps, touch the Stop Test checkbox. Then touch inside the After field and enter a value, using the pop‐up numeric keypad. 7. Under If, touch either the Pass or Fail button to set the actions to occur upon your waveform's passing or failing the test. 8. Under Then, touch the actions you want to occur: stop test, sound alarm, print result, emit pulse, or save the waveform. If you want to have the results printed and your oscilloscope is not equipped with a printer, be sure that the it is connected to a local or network printer. See Printing. 9. If you want to save your waveform automatically, touch the Save Setup. This takes you out of the current dialog and opens the Save Waveform dialog. Refer to the Saving and Recalling Waveforms section of this manual for more details. 10. Test your Pass/Fail conditions by touching the Force Actions Once button. Press the Clear All button to quickly uncheck all checkboxes if you want to change your selections. OMPARING A INGLE ARAMETER 1. Touch Analysis Pass/Fail Setup from the menu bar WRXi-A-GSM-E Rev A...
- Page 84 ETTING TARTED ANUAL 2. Touch one of the Q tabs. A setup dialog for the position is shown. 3. Touch inside the Source1 field and select a source from the pop‐up menu. 4. Touch inside the Condition field in the main dialog and select ParamCompare. A ParamCompare setup dialog opens to the right of the main dialog. 5. Touch inside the Compare Values field and select All or Any from the pop‐up menu. By selecting All, the test is true only if every waveform falls within the set limit. By selecting Any, the test is true if just one waveform falls within the limit. WRXi-A-GSM-E Rev A...
-
Page 85: Comparing Dual Parameters
Xi-A MXi-A S UNNER ERIES 6. Touch inside the Condition field in the ParamCompare mini‐dialog and select a math operator from the pop‐up menu. 7. Touch inside the Limit field and enter a value, using the pop‐up numeric keypad. This value takes the dimensions of the parameter that you are testing. For example, if you are testing a time parameter, the unit is seconds. If you chose either WithinDeltaPct or WithinDeltaAbs from the Condition menu, you also have the choice of setting the limit by means of the statistical buttons at the bottom of the ParamCompare dialog: Comparing Dual Parameters Set up Dual Parameters by following the previous steps in the Comparing a Single Parameter topic, except you selecting the Dual Param Compare condition. WRXi-A-GSM-E Rev A... -
Page 86: Setting Up Mask Testing
ETTING TARTED ANUAL Setting Up Mask Testing 1. Touch Analysis Pass/Fail Setup… from the menu bar. 2. Touch a Q tab. A setup dialog for the position is shown. 3. Touch inside the Source1 field and select a source from the pop‐up menu. 4. Touch inside the Condition field in the main dialog and select Mask Test. 5. From the Test mini‐dialog, make a selection in the Test is True when group of buttons. 6. This selection means, for example, that if you select All In, the test is False if even a single waveform falls outside the mask. WRXi-A-GSM-E Rev A... -
Page 87: Remote
You can fully control your instrument remotely by using either the optional GPIB (General Purpose Interface Bus) port or the LAN communication port on the oscilloscope's rear panel, shown below. The only actions for which you must use the front panel controls are the powering up of the oscilloscope and the setting of remote control addresses. Standards LeCroy remote control commands conform to the GPIB IEEE 488.2 standard. This may be considered an extension of the IEEE 488.1 standard, which deals mainly with electrical and mechanical issues. LeCroy also supports LXI (LAN eXtensions for Instrumentation) over the LAN port. ANSI/IEEE Std. 488.2–1987, IEEE Standard Codes, Formats, Protocols, and Common Commands. The Institute of Electrical and Electronics Engineers, Inc., 345 East 47th Street, New York, NY 10017 USA... -
Page 88: Program Messages
ETTING TARTED ANUAL Program Messages You control the oscilloscope remotely using program messages that consist of one or more commands or queries. The program messages you send from the external controller to the oscilloscope must conform to precise format structures. The oscilloscope executes all program messages sent in the correct form, but ignores the ones with errors. UTOMATION Refer to the Automation Manual supplied on CD with your oscilloscope for more information. In addition to supporting the familiar ASCII‐based remote commands that have been used to control all LeCroy oscilloscopes for many years, all of the Windows‐ based X‐Stream instruments fully‐support control by Automation interfaces based on Microsoft’s Component Object Model (COM). Using COM, the controlling application can run directly on the instrument without requiring an external controller. Alternatively, it can run using Microsoft’s distributed COM standard (DCOM) on a networked computer. Standards Automation is a Microsoft technology, formerly referred to as OLE Automation, primarily used to enable cross‐application macro programming. It is based upon the Component Object Model (COM), which is similar in nature to CORBA, more commonly found in the UNIX world. An application that exposes Automation Objects is referred to as an Automation Server. Automation Objects expose Automation Interfaces to the controlling Automation Client. This manual describes these Automation objects and interfaces in detail. It is important to note that Automation itself is not software language dependent. Meaning, it can be used from any programming language that supporting COM. LeCroy’s usage concentrates mainly on the use of Automation from the Visual Basic Script (VBScript) language. This is largely because it is one of the easiest to use, it is the language that X‐Stream instruments use for setup files, and the VBScript interpreter is installed by default on all X‐Stream instruments. So, this is all available without having to purchase any additional software. TILITIES Status ... -
Page 89: Accessing The Status Dialog
Xi-A MXi-A S UNNER ERIES Accessing the Status Dialog 1. Touch Utilities Utilities Setup… from the menu bar. 2. Touch the Status tab. Remote communication The Remote dialog is where you can select a network communication protocol, establish network connections, and configure the Remote Control Assistant log. The choice of communication protocols is limited to TCPIP and GPIB. PLEASE NOTE THE FOLLOWING: • GPIB is an option and requires a GPIB card to be installed in a card slot at the rear of the oscilloscope. • The instrument uses Dynamic Host Configuration Protocol (DHCP) as its addressing protocol. Therefore, it is not necessary to set up an IP address if your network supports DHCP. If it does not, you can assign a static address in the standard Windows 2000 network setup menu. The Remote Control Assistant monitors communication between your PC and oscilloscope when you are operating the instrument remotely. You can log all events or errors only. This log can be invaluable when you are creating and debugging remote control applications. Remote Communication Setup If you are connecting the oscilloscope to a network, first contact your Information Systems administrator. If you are connecting the oscilloscope directly to your PC, connect a GPIB or Ethernet cable between them. 1. Touch Utilities Utilities Setup… from the menu bar. 2. -
Page 90: Configuring The Remote Control Assistant Event Log
ETTING TARTED ANUAL 5. Touch the Net Connections button. The Windows Network Connections screen is shown. 6. Touch Create a new connection and use the Windows Network Connection Wizard to make a new connection. Or, touch Local Area Connection to reconfigure the oscilloscope's connection (if it is already connected to the network). Configuring the Remote Control Assistant Event Log 1. Touch Utilities Utilities Setup… from the menu bar. 2. Touch the Remote tab. 3. Touch inside the Log Mode field and select Off, Errors Only, or Full Dialog from the pop‐up menu. 4. Export the contents of the event log to an ASCII text file by touching the Show Remote Control Log button. The Event Logs popup window is shown. Touch inside the DestFilename field and provide a file name. Now, touch the Export to Text File button. Hardcopy Printing Refer to Printing under the File Management topic (page 73). Clipboard This selection prints to the clipboard so you can paste a file into another application (like MS Word, for example). RINTING FROM THE ... -
Page 91: File
Xi-A MXi-A S UNNER ERIES File Choose File if you want to output the screen image to storage media such as floppy drive or hard drive. When outputting to floppy disk, be sure to use a preformatted disk. RINTING TO A 1. Touch Utilities Utilities Setup... from the menu bar. 2. Touch the Hardcopy tab, then the File icon. 3. Touch inside the File Format field and select a graphic file format from the pop‐up menu. 4. Under Colors, touch the Use Print Colors checkbox if you want the traces printed on a white background. A white background saves printer toner. 5. Touch inside the Directory field and type the path to the folder you want to print to, using the pop‐up keyboard. Or, touch the Browse button and navigate to the folder. 6. Touch inside the File Name field and enter a name for the display image, using the pop‐up keyboard. 7. Touch the Grid Area Only checkbox if you do not need to print the dialog area and you only want to show the waveforms and grids. 8. Touch the Print Now button. E-Mail The instrument also gives you the option to e‐mail your screen images, using either the MAPI or SMTP protocols. Before you output to e‐mail from the Utilities dialog, you first have to set up the e‐mail server and recipient address in Preference Setup. E‐... -
Page 92: Aux Output
ETTING TARTED ANUAL 7. Touch the Print Now button. Aux Output In addition to a calibration signal, the following signals can be output through the AUX OUTPUT connector: Square Wave Trigger Out ‐ can be used to trigger another oscilloscope DC level ‐ a reference level Trigger Enabled ‐ can be used as a gating function to trigger another instrument when the oscilloscope is ready Pass/Fail ‐ allows you to set a pulse duration from 1 ms to 500 ms. This pulse occurs when pass/fail testing is active and conditions are met. Aux Output Off ‐ turns off the auxiliary output signal Auxiliary Output Setup 1. Touch Utilities Utilities Setup... from the menu bar. 2. Touch the Aux Output tab. 3. If you simply want a 1 kHz, 1 V square wave, touch the button so labeled. 4. If you want a specialized output, touch one of the buttons under Use Auxiliary Output For. 5. Touch inside the Amplitude field and enter a value, using the pop‐up numeric keypad. If you want a TTL level signal, touch the TTL Level checkbox. The Amplitude field becomes unavailable. 6. If you selected Square Wave, touch inside the Frequency field and enter a value, using the pop‐up keypad. You can set a value from 5.0 Hz to 5 MHz. ... -
Page 93: Manually Setting The Date And Time
Setting the Date and Time from the Internet The Simple Network Time Protocol (SNTP) is used. 1. Ensure that the oscilloscope is connected to the Internet through the LAN connector at the rear of the instrument. 2. Touch Utilities Utilities Setup... from the menu bar . 3. Touch the Date/Time tab. 4. Touch the Set from Internet button. Setting the Date and Time from Windows 1. Touch Utilities Utilities Setup... from the menu bar . 2. Touch the Date/Time tab. 3. Touch the Windows Date/Time button 4. Use the Time & Date Properties window to configure the time, including time zone. Options Use this dialog to add or remove software options. For information about software options, contact your local LeCroy Sales and Service office, or visit our Web site at http://www.lecroy.com/options. WRXi-A-GSM-E Rev A... -
Page 94: Service
ETTING TARTED ANUAL Options that you purchase, such as JTA2, add performance to you instrument. This added performance is seen in the new math functions or parameters that you can choose from when doing Measure or Math setups. Service This button provides access to service dialogs, which are for the sole use of LeCroy service personnel. A security code is required to gain access. Show Windows Desktop Touching the Show Windows Desktop button in the main Utilities dialog minimizes the instrument application to reveal the underlying desktop. Maximize the application by touching the shortcut icon Touch‐Screen Calibration Touching the Touch‐Screen Calibration button starts the calibration procedure. During the procedure you are prompted to touch the center of a small cross in 5 key locations on the touch screen. Because sufficient accuracy cannot be achieved using your finger, use a stylus instead for this procedure. The calibration has a ten‐second timeout in case no cross is touched. Avoid parallax errors by placing your line of sight directly in front of each cross before touching. Built-in Stylus Holder Your WaveRunner Xi‐A is supplied with a touch screen stylus. Use the stylus for more precise touch screen operation. There is also a built‐in stylus holder at lower‐ right of the front panel. WRXi-A-GSM-E Rev A... -
Page 95: Preferences
Xi-A MXi-A S UNNER ERIES Preferences Audible Feedback You can elect to have audible confirmation each time you touch a screen or front panel control. 1. Touch Utilities Preferences from the menu bar. 2. Touch the Audible Feedback Enable checkbox so that the oscilloscope emits a beep with each touch of the screen or front panel control. Auto-calibration You can choose to have your instrument automatically recalibrate itself whenever there is a significant change in ambient temperature. If you do not enable this option, the oscilloscope only recalibrates at startup and whenever changes are made to certain operating conditions. 1. Touch Utilities Preferences from the menu bar. 2. Touch the Automatic Calibration Enable checkbox. Language Selection You can choose to display screen control names in a language other than English by touching inside the Language field and making a selection from the pop‐up menu. This change takes effect immediately with requiring a reboot of the oscilloscope. Performance Optimization You can set up the oscilloscope to optimize either calculating speed or display speed. If the display update rate is of primary concern to you, optimize for Display. If acquisition and analysis are more important, optimize for analysis. Optimizing for analysis can be useful when persistence or averaging is used, giving higher priority to waveform acquisition at the expense of display update rate. WRXi-A-GSM-E Rev A... - Page 96 ETTING TARTED ANUAL The choices are presented as a spectrum with highest values at the extremes: 1. Touch Utilities Preferences from the menu bar. 2. Touch one of the optimization icons. WRXi-A-GSM-E Rev A...
-
Page 97: Acquisition
Xi-A MXi-A S UNNER ERIES Acquisition Offset Control As you change the gain, this control allows you to either keep the vertical offset level indicator stationary (when Div is selected) or to have it move with the actual voltage level (when Volts is selected). The advantage of selecting Div is that the waveform remains on the grid as you increase the gain. If Volts is selected, the waveform could move off the grid. Note: Regardless of whether you select Volts or Div, the Offset shown in the channel setup dialog always indicates volts. However, when Div is selected for the Offset Control, the offset in volts is scaled proportional to the change in gain, thereby keeping the division on the grid constant. 1. Touch Utilities Preferences from the menu bar. 2. Touch the Acquisition tab. 3. Under Offset Setting constant in:, touch either the Div or Volts button. Delay Control As you change the timebase, this control allows you to either keep the horizontal offset indicator stationary (when Div is selected) or to have it move with the trigger point (when Time is selected). The advantage of selecting Div is that the trigger point remains on the grid as you increase the timebase. If Time is selected, the trigger point could move off the grid. Note: Regardless of whether you select Time or Div, the Delay shown in the timebase setup dialog always indicates time. However, when Div is selected for Delay In, the delay in time is scaled proportional to the change in timebase, thereby keeping the division on the grid constant. 1. Touch Utilities Preferences from the menu bar. 2. Touch the Acquisition tab. 3. -
Page 98: Trigger Counter
ETTING TARTED ANUAL 4. Under Offset Setting constant in:, touch either the Volts or Div button. 5. Under Delay Setting constant in:, touch either the Time or Div button. Trigger Counter Checking the Reset trigger counter before starting a new acquisition checkbox clears the trigger counter each time the oscilloscope issues an arm acquisition command. This applies when you have set a trigger Holdoff condition in the Trigger dialog in either time or events: The default condition of this control is off (unchecked). E-mail Before you can send e‐mail from the oscilloscope, it must first be configured. 1. Touch Utilities Preference Setup… from the menu bar. 2. Touch the E‐mail tab. 3. Choose an e‐mail server protocol: MAPI (Messaging Application Programming Interface) is the Microsoft interface specification that allows different messaging and workgroup applications (including e‐mail, voice mail, and fax) to work through a single client, such as the Exchange client included with Windows 95 and Windows NT. MAPI uses the default Windows e‐mail application (usually Outlook Express). SMTP (Simple Mail Transfer Protocol) is a TCP/IP protocol for sending messages from one computer to another through a network. This protocol is used on the Internet to route e‐mail. In many cases no account is needed. WRXi-A-GSM-E Rev A... -
Page 99: Acquisition Status
Address (To:) field and use the pop‐up keyboard to enter the recipient's e‐ mail address. 6. You can send a test e‐mail text message by touching the Send Test Mail button. The test message reads "Test mail from [name of oscilloscope's email address]." Acquisition Status For each general category of oscilloscope operation, you can view a summary of your setups. These dialogs are not accessible through the Utilities menu, but are instead accessed from the menu bar drop‐down menus. The categories are as follows: • Vertical ‐ select Channels Status . . . from drop‐down menu • Timebase ‐ select Acquisition Status . . . from drop‐down menu • Trigger ‐ select Acquisition Status . . . from drop‐down menu • Math ‐ select Math Status . . . from drop‐down menu In addition to these dialogs, summaries are also provided for XY setups, memory (M1‐M4) setups, and time stamps for sequence mode sampling. YSTEM ECOVERY Your WaveRunner Xi‐A series oscilloscope was designed to operate very reliably for many years. However, the application software that operates the instrument runs on a Windows platform. The loading or incomplete removal of additional Windows applications may eventually cause problems in the stability of the operating system. In severe cases, it may be necessary to reload the base operating system and oscilloscope application. This can be done by using a recovery routine to restore a clean copy of the image originally installed on the C: drive. Any user data and calibration data located within the D: partition is unaffected by the recovery process. LeCroy has provided a recovery application, along with a backup image, in an extra partition on the instrument’s hard drive. The recovery process is easy to perform, using the instructions provided as follows. WRXi-A-GSM-E Rev A... -
Page 100: Recovery Procedure
ETTING TARTED ANUAL After the recovery procedure is done, you must activate Windows, either by internet connection to Microsoft’s Web site or by telephone. For this, you need to provide the Windows Product Key number, which is affixed to the bottom of the oscilloscope. Note: The recovery process produces a replica of the operating system and oscilloscope application software at the revision levels that were current when the oscilloscope was manufactured. Any later revisions of the application software, Windows operating system, and virus scan definition files are not automatically loaded. After completion of the disk image recovery, it is highly recommended that you search the vendors’ Web sites to upgrade the individual components to their current revision level. The current oscilloscope application software can be downloaded directly from the LeCroy Web site at www.lecroy.com. Since the calibration data for the oscilloscope is stored in the D: drive, the current calibration constants are preserved during the recovery process. Recovery Procedure Your oscilloscope is designed to operate reliably for many years. However, the application software operating the instrument runs on a Windows platform. The loading or incomplete removal of additional Windows applications may eventually cause problems in the stability of the operating system. Severe cases may require a reloading of the base operating system and oscilloscope application. This is done using a recovery routine that restores a clean copy of the image originally installed on the C: drive. Note: Any user and calibration data located on the D: partition is not affected by the recovery process. LeCroy provides you with a recovery application and a backup image in an extra partition on the instrument’s hard drive. The recovery process is easy to perform, using the Recovery Wizard. After the recovery procedure is done, you must activate Windows, either by Internet connection to Microsoft’s Web site or by telephone. Have your Windows Product Key number (located on the rear of the oscilloscope) handy during Widows reactivation. WRXi-A-GSM-E Rev A... -
Page 101: Wave Runner Xi-Aand Mxi-A Series
Xi-A MXi-A S UNNER ERIES Note: The recovery process produces a replica of the operating system and oscilloscope application software at the current revision levels when the oscilloscope was manufactured. Any further revisions of the application software, Windows operating system, and virus scan definition files are not automatically upgraded. Therefore, after completion of the disk image recovery, it is highly recommended to search vendor Web sites and upgrade the individual components to current revision levels. The current oscilloscope application software can be downloaded directly from the LeCroy website at www.lecroy.com. Since the calibration data for the oscilloscope is stored in the D: drive, current calibration constants are not overwritten during the recovery process. Recovery Procedure 1. Connect a network cable to the LAN port on the rear of the oscilloscope if you intend to activate windows through the Internet. 2. Connect a keyboard and a mouse to the oscilloscope. 3. Apply power to the oscilloscope. 4. As soon as the Starting Acronis Loader... Press F11 for Acronis Startup Recovery Manager message appears on the screen, press the F11 key until the recovery software logo appears momentarily. The Acronis True Image Echo Workstation main window is displayed. Note: Do not press F11 before you see the Starting Acronis Loader message or you will enter the MB boot sequence selection. 5. Select Recovery from the Main Menu. The Restore Data Wizard opens. 6. Click Next on the Welcome page. 7. On the Backup Archive Selection page, you choose the zone where the recovery partition is located. Choose Acronis Secure Zone (this is where the recovery data is located on your oscilloscope) and click ... - Page 102 ETTING TARTED ANUAL 8. On the Backup Date Selection page, choose the date when the backup was created and to which state you want to revert your system and click Next. 9. On the Restoration Type Selection page, select Restore disks or partitions and click Next. 10. On the Partition or Disk to Restore page, select SYSTEM (C:) as the source and click Next. 11. On the Restored Partition Type page, select Active and click Next. Note: If a window appears asking if you want to buy Acronis products, click Do not show this message again and click OK. 12. The Restored Partition Size page displays the Partition size for the restoration. Nothing needs to be changed, simply click Next. 13. On the Next Selection page, you will be asked if you want to restore another partition or hard disk drive. Select No, I do not and click Next. 14. The Restoration Options page displays additional options, such as what to do after the restoration is complete and error handling. Simply click Next to use the default selections. 15. A summary window is displayed indicating that Acronis True Image is ready to proceed with the recovery of the C: partition. Click Proceed to start the recovery process. Note: This will take approximately 4 to 15 minutes depending on the version of Operating system that is being restored. The progress is displayed on the screen. 16. Once the restoration is complete, an Information window is displayed indicating that the Data was successfully restored. Click OK. WRXi-A-GSM-E Rev A...
- Page 103 Xi-A MXi-A S UNNER ERIES 17. Click Operations→Exit. The oscilloscope will restart and begin installing the required software. A message is displayed asking if you want to install Microsoft Office PowerPoint Viewer. 18. Click Yes to install PowerPoint Viewer. The InsallShield Wizard for Adobe Flash Player opens. 19. To install Adobe Flash Player, click Install and then Finish. The X‐ Stream software installer screen appears. 20. Click Next to continue. The License Agreement page is displayed. 21. Click I Agree. The Choose Components page is displayed. 22. Select all X‐Stream components and click Install. Note: A Windows Security window may be displayed indicating that Windows can't verify the publisher of this driver software. Choose Install this driver software anyway and then click Install. 23. When the X‐Stream installation is completed, reboot the oscilloscope. Note: Now you must activate Windows® using an Internet connection to the Microsoft Web site or by telephone. When activating, have the Windows Product Key number handy (it is affixed to the rear of the oscilloscope). WRXi-A-GSM-E Rev A...
-
Page 104: Restarting The Application After Recovery
ETTING TARTED ANUAL Restarting the Application after Recovery Upon initial power‐up, the oscilloscope automatically loads the instrument application software. If you exit the application and want to reload it, touch the shortcut icon on the desktop: Note: If you minimize the application, touch the appropriate task bar or desktop icon to maximize it: Restarting the If you need to restart the Windows® operating system, reboot the oscilloscope by pressing and holding in the power switch for 10 seconds, then turning the power on again. Restarting the Operating System Windows Activation 1. Click Start in the task bar, and then select All Programs Activate Windows. Note: After Windows Activation is completed, this selection no longer appears in the All Programs menu. WRXi-A-GSM-E Rev A... - Page 105 Xi-A MXi-A S UNNER ERIES 2. Select an activation method: internet or phone. Then click Next. 3. If you elected to activate by internet, enter the Activation ID (Product Key number on the bottom of the oscilloscope) number when prompted to do so, and then click Next. Windows Activation begins. 4. If you elected to activate by phone, select the country the oscilloscope is located in. Then dial the number provided. You are asked to repeat (over the phone) the installation ID listed on the screen. A 7‐part number is then provided to you over the phone. Enter the numbers on the empty boxes at the bottom of the screen. Click Next when you are done. WRXi-A-GSM-E Rev A...
- Page 106 ETTING TARTED ANUAL 5. When activation is completed, the Thank You! screen is shown. Click OK. 6. Check the revision levels of the X‐Stream software, virus definitions, and Windows updates. Visit the vendors’ Web sites and download all necessary updates. WRXi-A-GSM-E Rev A...
-
Page 107: Appendix
Xi-A MXi-A S UNNER ERIES APPENDIX Specifications Note: Specifications are subject to change without notice. Vertical System • Bandwidth @ 50 ohms (‐3 dB): 10 mV/div to 1 V/div 400 MHz WaveRunner 44Xi‐A 5 mV/div to 9.9 m/div 400 MHz 2 mV/div to 4.95 m/div 150 MHz 10 mV/div to 1 V/div 600MHz WaveRunner 64Xi‐A 5 mV/div to 9.9 m/div 500 MHz 2 mV/div to 4.95 m/div 150 MHz 10 mV/div to 1 V/div 600 MHz WaveRunner 62Xi‐A 5 mV/div to 9.9 m/div 500 MHz 2 mV/div to 4.95 m/div 150 MHz 10 mV/div to 1 V/div ... - Page 108 ETTING TARTED ANUAL • Calculated Rise Time: 10 mV/div to 1 V/div, 50 ohms (input risetime >/= 50 ps): 875 ns WaveRunner 44Xi‐A 500 ps WaveRunner 64Xi‐A 500 ps WaveRunner 62Xi‐A 300 ps WaveRunner 104MXi‐A and WaveRunner 104Xi‐A 180 ps WaveRunner 204Xi‐A • Bandwidth Limiters: Full 200 MHz 20 MHz • Input Capacitance, using PP008 probe: < 9.5 pF (typical) • Input Capacitance of Channel (1/1, 1/10, 1/100): < 20 pF (typical) • Input Impedance: 1 Mohms // 16 pF or 50 ohms; WR104MXi-A, WR104Xi-A, WR204Xi-A: 1 Mohms // 20 pF or 50 ohms • Input Coupling: 50 ohms: DC, GND; 1 Mohms: AC, DC, GND • Max Input Voltage (1/1, 1/10): 50 ohms: 5 V ; 1 microsecond pulse, 50% duty cycle: ±10 V peak 1 Mohms: 400 V max. (peak AC: </= 5 kHz + DC) WR104MXi-A, WR104Xi-A, WR204Xi-A: 1 Mohms: 250 V max. (DC + Peak AC </= 10 kHz) ...
-
Page 109: Horizontal System
Xi-A MXi-A S UNNER ERIES • DC Gain Accuracy: ±1.0% of full scale (typical): ±1.5% >/= 10 mV/div ±2.5% 5 mV/div ±3.5% 2 mV/div • Offset Range: 44 Xi‐A, MXi‐A 64 Xi‐A, MXi‐A 62 Xi‐A, MXi‐A 104 Xi‐A, MXi‐A 204 Xi‐A, MXi‐A 50 Ω: ±1 V @ 2–98 mV/div, ±10 V @ 100 mV/div–1 50 Ω:±400mV@2– V/div; 1 M Ω : ±1 V @ 2–98 mV/div, ±10 V @ 100 4.95mV/div,±1V@5–99mv/div, ±10 mV/div–1 V/div, ±100 V @ 1.02 V/div–10 V/div V @ 100 mV–1 V/div, 1 M Ω: ±400 mV @ 2–4.95 mV/div, ±1 V @5–99 mV/div, ±10 V @ 100 mV–1 V/div, ±100 V @ 1.02–10 V/div • Offset Accuracy: ±(1.5% of offset value + 0.5% of full scale value + 1 mV) • WR 104 and 204, Xi‐A and MXi‐A Models: ±(1.5% of offset value + 1.0% of full scale value + 1 mV) • Probing System: BNC or ProBus Horizontal System • Timebases: Internal timebase common to all input channels; an external clock can be applied at the auxiliary input ... -
Page 110: Acquisition System
ETTING TARTED ANUAL External Sample Clock (2‐channel operation only; Ch 2 only in WaveRunner 62Xi‐A): DC to 1 GHz (104 and 204, Xi‐A and MXi‐A models), DC to 600 MHz (44, 64, 64, Xi‐A and MXi‐A models); 50 ohm limited BW in 1 Mohm, BNC input, minimum rise time and amplitude requirements apply at low frequencies. Minimum Minimum Slew Rate Impedance (mV/ns) p‐p Threshold (ohms) 44, 64, 62, 104, 204, 44, 64, 62, 104, 204, Xi‐ Xi‐A, MXi‐A Xi‐A, MXi‐A Xi‐A, MXi‐A A, MXi‐A TTL 50 TTL 1 M ECL 50 ECL 1 M 0 Cross 50 0 Cross 1 M • Roll Mode: User selectable; available at lower time/div settings Acquisition System Single‐shot Sample Rate/Ch: 5 GS/s 5 GS/s 5 GS/s 5 GS/s... -
Page 111: Acquisition Modes
Xi-A MXi-A S UNNER ERIES Acquisition Modes • Single‐shot: For transient and repetitive signals: 200 ps/div to 1000 s/div • Sequence: 1000 segments standard • Sequence Time Stamp Resolution: 1 ns • Intersegment Time: 800 ns Acquisition Processing • Time Resolution (minimum, single-shot): 200 ps (5 GS/s); 100 ps (10 GS/s) • Averaging: Summed averaging to 1 million sweeps; Continuous averaging to 1 million sweeps •... -
Page 112: Basic Triggers
ETTING TARTED ANUAL • Maximum Trigger Sensitivity with Edge Trigger (Ch1‐4 + external): 104MXi‐A/Xi‐ 44Xi‐A 64Xi‐A 62Xi‐A 204Xi‐A A 2 div @ < 400 2 div @ < 600 2 div @ < 600 2 div @ < 1 2 div @ < 2 MHz MHz MHz GHz GHz 1 div @ < 200 1 div @ < 200 1 div @ < 200 1 div @ < 200 1 div @ < 200 MHz MHz MHz MHz MHz • Maximum Trigger Frequency with SMART Trigger (Ch1‐4 + external): 44Xi‐A 64Xi‐A 62Xi‐A 104MXi‐A/Xi‐A 204Xi‐A 400 MHz 600 MHz 600 MHz 1 GHz 2 GHz... -
Page 113: Smart Triggers
Xi-A MXi-A S UNNER ERIES SMART Triggers • Dropout: Triggers if the input signal drops out for longer than a selectable time‐ out between 1 ns and 20 s. • Glitch: Triggers on positive or negative glitches with widths selectable from 500 ps to 20 s or on intermittent faults (subject to bandwidth limit of oscilloscope). • Signal or Pattern Interval: Triggers on intervals selectable from 1 ns to 20 s. • Runt: Trigger on positive or negative runts defined by two voltage limits and two time limits. Select between 1 ns and 20 s. • Slew Rate: Activates a trigger when the rising or falling edge of a pulse crosses two threshold levels, an upper level and a lower level. Automatic Setup • Autosetup: Automatically sets timebase, trigger, and sensitivity to display a wide range of repetitive signals. • Vertical Find Scale: Automatically sets the vertical sensitivity and offset for the selected channels to display a waveform with maximum dynamic range. Probes • Probes: One passive probe per channel standard (WR104MXi‐A, WR104Xi‐A, WR204Xi‐A); optional passive and active probes are available. • Probe System ‐ ProBus: Automatically detects and supports a wide variety of compatible probes • Scale Factors: Automatically or manually selected depending on probe used Color Waveform Display •... -
Page 114: Analog Persistence Display
Persistence Selections: Select analog, color, or 3‐D • Trace Selection: Activate Analog Persistence on all or any combination of traces • Persistence Aging Time: From 500 ms to infinity • Sweeps Displayed: All accumulated or all accumulated with last trace highlighted Zoom Expansion Traces Display up to 4 Math/Zoom traces Internal Waveform Memory Waveform: M1, M2, M3, M4 (Store full‐length waveforms with 16 bits/data point.) Or save to any number of files (limited only by data storage media). Setup Storage Front Panel and Instrument Status: Save to the internal hard drive or to a USB‐ connected peripheral device. Interface • Remote Control: Through Windows® Automation or LeCroy remote command set • GPIB Port (optional): Supports IEEE‐488.2 • Ethernet Port: 10/100/1000Base‐T Ethernet interface (RJ‐45 connector) • USB Ports: 5 USB ports (one at front of oscilloscope) support Windows compatible devices. • External Monitor Port (standard): 15‐pin D‐Type SVGA compatible DB‐15; connect a second monitor to use dual monitor display mode • Parallel Port: 1 standard WRXi-A-GSM-E Rev A... -
Page 115: Auxiliary Input
Xi-A MXi-A S UNNER ERIES • Serial Port: DB‐9 COM1 port (not for remote control of oscilloscope) Auxiliary Input Signal Types: Select External Trigger or Clock input on front panel. Auxiliary Output • Signal Types: Select from calibrator signal on front panel or control signals output from rear panel BNC. • Calibrator Signal: 250 Hz to 1 MHz square wave or DC level; 50 mV to 1.0 V (selectable) into 1 kohms • Control Signals: trigger enabled, trigger out, pass/fail status, or off Math Tools (standard) Display up to four math function traces (F1 to F4). The easy-to-use graphical interface simplifies setup of up to two operations on each function trace. -
Page 116: Measure Tools (Standard)
ETTING TARTED ANUAL • • histogram of 1,000 events zoom (identity) • integral • invert (negate) Measure Tools (standard) Display any 8 parameters together with statistics, including their average, high, low, and standard deviations. Histicons provide a fast, dynamic view of parameters and wave shape characteristics. •... -
Page 117: Pass/Fail Testing
Xi-A MXi-A S UNNER ERIES Pass/Fail Testing Test multiple parameters against selectable parameter limits at the same time. Pass or fail conditions can initiate actions including: document to local or networked files, email the image of the failure, save waveforms, send a pulse out at the front panel auxiliary BNC output, or (with GPIB option) send a GPIB SRQ. General • Auto Calibration: Ensures specified DC and timing accuracy is maintained for 1 year minimum. • Power Requirements: Single phase, 100 to 240 V (±10%) at 50/60 Hz (±5%); or single phase, 100 to 120 V (±10%) at 400 Hz (±5%); Automatic AC voltage selection Voltage Range: 90 to 264 V 90 to 132 V Frequency Range: 47 to 63 Hz 380 to 420 Hz • Power Consumption: 340 Watts (340 VA) max ‐ all 4 channel models and 290 Watts (290VA) ‐ all 2 channel models, depending on accessories installed (probes, PC port plug‐ins, etc.); Power consumption during Standby State: 12 watts – all models. • Physical Dimensions (HWD): 260 mm x 340 mm x 152 mm (10.2 in. x 13.4 in. x 6.0 in.); height measurement excludes foot pads • Weight: 7.27 kg (16 lbs.) Warranty and Service Three‐year warranty; calibration recommended yearly. ... -
Page 118: Certifications
ETTING TARTED ANUAL UMIDITY • Operating: Maximum relative humidity 80% for temperatures up to 31 °C decreasing linearly to 50% relative humidity at 40 °C. • Storage (non‐operating): 5 to 95% RH (non‐condensing) as tested per MIL‐PRF‐ 28800F LTITUDE • Operating: Up to 2,000 m • Storage (non‐operating): 12,192 m (40,000 ft) ANDOM IBRATION • Operating: 5 Hz to 500 Hz, overall level: 0.31 g , 15 minutes in each of 3 orthogonal axes • Non‐operating: 5 Hz to 500 Hz, overall level: 2.4 g , 15 minutes in each of 3 orthogonal axes HOCK • Functional Shock: 20 g peak, half sine, 11 ms pulse, 3 shocks (positive and negative) in each of 3 orthogonal axes, 18 shocks total Certifications CE Compliant, UL and cUL Listed CE Declaration of Conformity The oscilloscope meets requirements of EMC Directive 89/336/EEC for Electromagnetic Compatibility and Low Voltage Directive 73/23/EEC for Product ... - Page 119 Xi-A MXi-A S UNNER ERIES Electromagnetic Emissions • EN 55011/A2:2002, Radiated and conducted emissions (Class A)* • EN 61000‐3‐2/A2:2005 Harmonic Current Emissions (Class A) • EN 61000‐3‐3/A2:2005 Voltage Fluctuations and Flickers (Pst = 1) Electromagnetic Immunity • EN 61000‐4‐2:2001** Electrostatic Discharge. (4 kV contact, 8 kV air, 4 kV vertical/horizontal coupling planes) • EN 61000‐4‐3:2006** RF Radiated Electromagnetic Field. (3 V/m, 80‐1000 MHz; 3 V/m, 1400 MHz ‐ 2 GHz; 1 V/m, 2 GHz ‐ 2.7 GHz) • EN 61000‐4‐4:2004** Electrical Fast Transient/Burst. (1 kV on power supply lines, 0.5 kV on I/O signal data and control lines) • EN 61000‐4‐5:2006** Surges. (1 kV AC Mains, L‐N, L‐PE, N‐PE) • EN 61000‐4‐6:2007** RF Conducted Electromagnetic Field. (3 Vrms, 0.15 MHz ‐ 80 MHz) • EN 61000‐4‐11:2004† Mains Dips and Interruptions. (1 cycle voltage dip, 100% short interruption) * In order to conform to Radiated Emissions standards, use properly shielded cables on all I/O terminals. ** Meets Performance Criteria "B" limits during the disturbance; product undergoes a temporary degradation or loss of function of performance which is self recoverable. † Meets Performance Criteria "C" limits during the disturbance; product undergoes a temporary degradation or loss of function of performance which requires operator intervention or system reset. ...
-
Page 120: Ul And Cul Certifications
ETTING TARTED ANUAL ‐V OLTAGE IRECTIVE EN 61010‐1:2001 Safety requirements for electrical equipment for measurement, control, and laboratory use. The oscilloscope has been qualified to the following EN 61010‐1 limits: • Installation Categories II (Mains Supply Connector) & I (Measuring Terminals) • Pollution Degree 2 (Normally only dry non‐conductive pollution occurs. Occasionally a temporary conductivity caused by condensation must be expected.) • Protection Class I (Provided with terminal for protective ground) UL and cUL Certifications The oscilloscope is UL and cUL listed and conforms to the following standards: • UL Standard: UL 61010‐1 2nd Edition. • Canadian Standard: CSA‐C22.2 No. 61010‐1‐04. Standard Features in the WaveRunner MXi‐A The WaveRunner MXi‐A is a configuration of the WaveRunner Xi. All of the settings, acquisition modes, and operating modes are identical. However, the following information highlights the differences. References made to optional capabilities (XMAP, XMATH, XDEV, JTA2 or HDTV‐ TRIG) in this manual are standard features in the WaveRunner 104MXi‐A. WRXi-A-GSM-E Rev A... -
Page 121: China Rohs Compliance
Xi-A MXi-A S UNNER ERIES China ROHS Compliance WRXi-A-GSM-E Rev A... - Page 122 ETTING TARTED ANUAL Toxic or Hazardous Substances and Elements Part Name X X PCBAs O O Mechanical Hardware O O Sheet Metal O O Plastic Parts X O Cable Assemblies X X Display X O Power Supply X O Fans X O Battery for Processor X ...
- Page 123 Thank you for purchasing a WaveRunner Oscilloscope. Corporate Headquarters 700 Chestnut Ridge Road Chestnut Ridge, NY 10977 www.lecroy.com...
Need help?
Do you have a question about the WaveRunner Xi-A and is the answer not in the manual?
Questions and answers