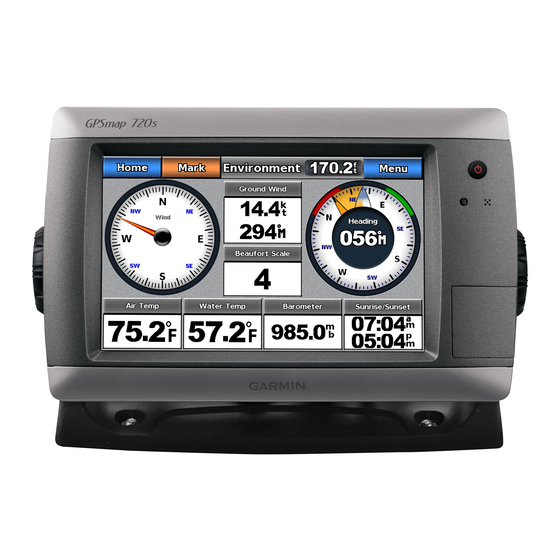
Garmin GPSMAP 720/720s Owner's Manual
Gpsmap 700 series
Hide thumbs
Also See for GPSMAP 720/720s:
- Important safety information (48 pages) ,
- Technical reference (42 pages) ,
- Installation instructions manual (10 pages)
Table of Contents
Advertisement
Advertisement
Table of Contents

Related Manuals for Garmin GPSMAP 720/720s


Summary of Contents for Garmin GPSMAP 720/720s
- Page 1 GPSMAP 700 series ® owner’s manual...
- Page 2 Information in this document is subject to change without notice. Garmin reserves the right to change or improve its products and to make changes in the content without obligation to notify any person or organization of such changes or improvements.
-
Page 3: Introduction
Introduction Introduction WARNING See the Important Safety and Product Information guide in the product box for product warnings and other important information. This manual includes information for the following products: • GPSMAP 720/720s ® • GPSMAP 740/740s • GPSMAP 750/750s Tips and Shortcuts •... -
Page 4: Table Of Contents
.............83 Waypoints ............26 Appendix ..........84 Routes .............28 Specifications ..........84 Tracks ..............30 Calibrating the Touchscreen ......84 Navigating with a Garmin Autopilot....32 Screenshots.............85 Where To? ..........33 Viewing GPS Satellite Locations .....85 Marine Services Destinations ......33 Using WAAS/EGNOS ........85 Almanac, On-boat, and System Information..........85... -
Page 5: Getting Started
Getting Started Getting Started Front and Back Panels ➊ ➋ ➌ GPSMAP 700 Series Front View Power key ➊ Automatic backlight sensor ➋ SD card slot ➌ ➊ ➋ ➌ ➍ GPSMAP 700 Series Back View NMEA 2000 connector ➊ Power/data connector ➋... -
Page 6: Initial Chartplotter Settings
® reference photos of ports, harbors, marinas, and other points of interest. You can insert blank SD memory cards to transfer data such as waypoints, routes, and tracks to another compatible Garmin chartplotter or a computer (page 52). The SD card slot is located on the front of the chartplotter. -
Page 7: Viewing System Information
You can view the software version, the basemap version, any supplemental map information (if applicable), the software version for an optional Garmin radar (if applicable), and the unit ID number. You may need this information to update the system software or to purchase additional map data information. -
Page 8: Charts And 3D Chart Views
Charts and 3D Chart Views Charts and 3D Chart Views The GPSMAP 700 series chartplotters have a basic imagery map. The charts and 3D chart views listed below are available on the chartplotter. NoTe: Mariner’s Eye 3D and Fish Eye 3D chart views are available only if you use a BlueChart g2 Vision SD card (page 16). -
Page 9: Chart Symbols
Charts and 3D Chart Views Chart Symbols BlueChart g2 and BlueChart g2 Vision charts use graphic symbols to denote map features, which follow the standards for US and international charts. Some other common symbols you might see include, but are not limited to, those shown below. - Page 10 Charts and 3D Chart Views Configuring the Appearance of Waypoint Symbols 1. From the Home screen, select Charts. 2. Select Navigation Chart or Fishing Chart. 3. Select Menu > Waypoints & Tracks > Waypoint Display. 4. Select a waypoint symbol. 5.
-
Page 11: Viewing Tide Station Information
Charts and 3D Chart Views 3. Touch an object ➊ 4. Select the button with the name of the item to view the information. ➋ ➋ ➊ Viewing Tide Station Information Tide-station information appears on the chart with a tide station icon ( ). -
Page 12: Viewing Details About Navaids
Charts and 3D Chart Views Showing and Configuring Tides and Currents You can show and configure tide and current information on the Navigation chart or the Fishing chart. 1. From the Home screen, select Charts. 2. Select Navigation Chart or Fishing Chart. 3. - Page 13 Charts and 3D Chart Views 5. Select Chart Appearance > Detail. 6. Use the slider bar to select a level of detail. Selecting a World Map You can use either a basic world map or a shaded relief map on the Navigation chart or the Fishing chart. These differences are visible only when zoomed out too far to see the detailed charts.
- Page 14 Charts and 3D Chart Views Selecting the Heading Line Source The source for the display of the heading line on the chartplotter is determined by the heading line source setting (Auto or GPS Hdg) and whether heading information is available from a heading sensor. •...
- Page 15 Charts and 3D Chart Views 6. Complete an action: • Select Navaid Size to set the size of the navaid symbols shown on the map, and select a size. • Select Navaid Type > NoAA to show the NOAA navaid symbol set on the map. •...
-
Page 16: Automatic Identification System
Charts and 3D Chart Views Showing Other Vessels See “Configuring the Appearance of Other Vessels” (page 50). Showing and Configuring Data Overlay See “About Chart Overlay Numbers” (page 48). Using Waypoints See “Waypoints” (page 26). Using Tracks See “Tracks” (page 30). - Page 17 Charts and 3D Chart Views Target is lost. A green X indicates that the AIS transmission from the vessel is lost, and ➏ the chartplotter displays a message banner asking whether the vessel should continue to be tracked. If you discontinue vessel tracking, the lost target symbol disappears from the chart or the 3D chart view.
- Page 18 Charts and 3D Chart Views Showing AIS Vessels on a Chart or on a 3D Chart View AIS requires the use of an external AIS device and active transponder signals from other vessels. You can configure how other vessels appear on a chart or on a 3D chart view. The display range configured for one chart or one 3D chart view is applied only to that chart or to that 3D chart view.
-
Page 19: Perspective 3D
Charts and 3D Chart Views 3. Select a distance. 4. Select Time To to sound an alarm if AIS determines that a target will intersect the safe zone within the defined time interval (ranging from 1 to 24 minutes). 5. Select a time. Viewing a List of AIS Targets NoTe: The Mariner’s Eye 3D chart is available if you use a BlueChart g2 Vision SD card. -
Page 20: Bluechart G2 Vision
You cannot transfer BlueChart g2 Vision data from the data card to your computer for backup or viewing purposes. You can use the data card only on BlueChart g2 Vision-compatible Garmin GPS units or Garmin HomePort ™... -
Page 21: Mariner's Eye 3D
Charts and 3D Chart Views Mariner’s Eye 3D A BlueChart g2 Vision data card offers Mariner’s Eye 3D, which provides a detailed, three-dimensional view from above and behind the boat (according to your course) and provides a visual navigation aid. This view is helpful when navigating tricky shoals, reefs, bridges, or channels, and when trying to identify entry and exit routes in unfamiliar harbors or anchorages. -
Page 22: Fish Eye 3D
Charts and 3D Chart Views Showing Range Rings See “Showing Range Rings” (page 15). Selecting a Safe Depth You can set the appearance of a safe depth for Mariner’s Eye 3D. NoTe: This setting affects only the appearance of hazard colors in Mariner’s Eye 3D. It does not affect the safe water depth Auto Guidance setting (page 46) or the sonar shallow water alarm setting... -
Page 23: Fishing Chart
Charts and 3D Chart Views Showing a Sonar Cone on the Chart You can show a cone that indicates the area covered by your transducer. From the Home screen, select Charts > Fish eye 3D > Menu > Sonar Cone > on. Showing Suspended Targets From the Home screen, select Charts >... -
Page 24: Viewing Aerial Photos Of Landmarks
Charts and 3D Chart Views 2. Complete an action: • Select Land only to show standard chart information on the water, with photos overlaying the land. • Select Photo Map Blend to show photos on both the water and the land at a specified opacity. Use the slider bar to adjust the photo opacity. -
Page 25: Animated Tide And Current Indicators
Charts and 3D Chart Views Animated Tide and Current Indicators You can view indicators for animated tide station and current direction on the Navigation chart or the Fishing chart. To do so, information for tide station and current direction must be available in your preloaded map or BlueChart g2 Vision region. -
Page 26: Combinations
Combinations Combinations About the Combination Screen The Combination screen shows a combination of different screens at the same time. The number of options available on the Combination screen depends on the optional devices you have connected to your chartplotter, and whether you are using an optional BlueChart g2 Vision data card. Combination Screen Configuration Selecting a Combination 1. - Page 27 Combinations When overlay numbers are displayed on the Combination screen, the navigation inset is shown during ➌ navigation. The compass tape can be shown or hidden in each overlay. ➍ ➍ ➌ Combination Screen with Data Overlay Selecting a Data Overlay on a Combination Screen 1.
- Page 28 Combinations Showing the Compass Tape on a Combination Screen The compass tape appears in a row across the top of the combination screen. It shows the present heading, and an indicator that shows the bearing to the desired course appears while navigating. 1.
-
Page 29: Navigation
Navigation Navigation Basic Navigation Questions Question Answer How do I make the chartplotter point me in the Navigate using Go To. See “Setting and Following a direction in which I want to go (bearing)? Direct Course Using Go To” (page 26). -
Page 30: Waypoints
Navigation Courses You can set and follow a course to a destination using one of three methods: Go To, Route To, or Guide To. • Go To—takes you directly to the destination. • Route To—creates a route from your location to a destination, allowing you to add turns along the way. •... - Page 31 Navigation 3. Complete an action: • Touch a location on the chart. • Touch and drag the screen to pan to a new location. Touch a location on the chart. 4. Select Create Waypoint. 5. If necessary, you can name the waypoint and provide other information about it. Select the waypoint on the right side of the screen and select edit Waypoint.
-
Page 32: Routes
Navigation Deleting a Waypoint or an MOB You can delete a waypoint or an MOB that has been saved. 1. From the Home screen, select Information > User Data > Waypoints List. 2. Select a waypoint or an MOB. 3. Select Delete. Deleting All Waypoints From the Home screen, select Information >... -
Page 33: Creating And Saving A Route
Navigation 7. If necessary, repeat steps 5 and 6 to add additional turns, working backward from the destination to the present location of your boat. The last turn you add should be where you want to make the first turn from your present location. It should be the turn that is closest to your boat. -
Page 34: Tracks
Navigation 5. Select Done. Deleting a Saved Route 1. From the Home screen, select Information > User Data > Routes. 2. Select a route. 3. Select Delete. Deleting All Saved Routes From the Home screen, select Information > User Data > Clear User Data > Routes > oK. Bypassing a Waypoint on a Saved Route You can begin navigating a saved route from any waypoint in the route. - Page 35 Navigation Setting the Color of the Active Track You can select the color of your present track when you are viewing the navigation chart or the fishing chart. 1. From the Home screen, select Information > User Data > Tracks > Active Track options > Track Color.
-
Page 36: Navigating With A Garmin Autopilot
Navigating with a Garmin Autopilot When you start navigation (Go To, Route To, or Guide To), if you are connected through a National Marine Electronics Association (NMEA) 2000 network to a compatible Garmin autopilot (such as the GHP 10), you ™... -
Page 37: Where To
Where To? Where To? Use the Where To? option on the Home screen to search for, and navigate to, nearby fuel, repairs, and other services, as well as waypoints and routes that you have created. Marine Services Destinations The chartplotter contains information about thousands of destinations offering marine services. Navigating to a Marine Services Destination CAUTION ... - Page 38 Where To? When using Go To, a direct course and a corrected course may pass over land or shallow water. Use visual sightings and steer to avoid land, shallow water, and other dangerous objects. You can search for saved waypoints, saved routes, saved tracks, and marine services destinations by name. 1.
- Page 39 Where To? 4. Complete an action: • Select Forward to navigate the route from the starting point used when the route was created. • Select Backward to navigate the route from the destination point used when the route was created. A magenta line appears.
-
Page 40: Almanac, On-Boat, And Environmental Data
Almanac, On-boat, and Environmental Data Almanac, On-boat, and Environmental Data The Information screen displays information about tides, currents, celestial data, and gauges. Almanac Data Tide Station Information The Tides screen shows information about a tide station for a specific date and time , including the tide ➊... -
Page 41: Current Information
Almanac, On-boat, and Environmental Data Current Information NoTe: Current station information is available with a BlueChart g2 Vision card. The Currents screen shows information about a current station for a specific date and time, including the ➊ current speed and level . -
Page 42: On-Boat Data
Almanac, On-boat, and Environmental Data Celestial Information The Celestial screen shows information about sunrise, sunset, moonrise, moonset, the moon phase, and the approximate sky view location of the sun and moon . By default, the chartplotter shows celestial ➊ ➋ information for the present date and time. - Page 43 Almanac, On-boat, and Environmental Data Setting Description Scale minimum This value is less than the rated minimum, and it represents the lower limit of the gauge. This setting is not available on all gauges. Scale maximum This value is greater than the rated maximum, and it represents the upper limit of the gauge.
- Page 44 Almanac, On-boat, and Environmental Data Viewing Fuel Gauges To view fuel information, your chartplotter must be connected to an external fuel sensor, such as the Garmin ™ From the Home screen, select Information > Dashboard Gauges > engine. Configuring Fuel Gauges The amount of fuel on board can be represented by either the total fuel level (numeric) or by individual tank level (graphic).
-
Page 45: Environmental Data
Almanac, On-boat, and Environmental Data Resetting Trip Gauges 1. From the Home screen, select Information > Dashboard Gauges > Trip > Menu. 2. Complete an action: • Select Reset Trip to set all the readings for the present trip to 0.0. •... - Page 46 Almanac, On-boat, and Environmental Data Configuring the VMG Source You can specify the source of the velocity made good (VMG) data that is used to calculate true wind speed. Before you can configure the VMG source, the wind gauge must be set to Show True Wind (page 41).
- Page 47 Almanac, On-boat, and Environmental Data Environment Gauges Viewing Environment Gauges From the Home screen, select Information > Dashboard Gauges > environment. Configuring the Alignment of the Wind Gauge You can specify the alignment of the wind gauge on the Environment page. 1.
-
Page 48: Device Configuration
Device Configuration Device Configuration Basic Device Configuration Questions Question Answer How do I adjust the amount of detail shown on the See “Changing the Map Zoom Detail” (page map? How do I change the time zone setting? See “Configuring the Time” (page 47). -
Page 49: Display Configuration
Device Configuration Display Configuration Setting the Sound You can set when the chartplotter makes audible sounds. 1. From the Home screen, select Configure > System > Beeper/Display > Beeper. 2. Complete an action: • Select Alarms only to have the chartplotter beep only when alarms are triggered (default). •... - Page 50 Device Configuration Safe Water Depth and Safe Obstacle Height CAUTION The Safe Depth and Safe Height settings influence how the chartplotter calculates an Auto Guidance line. If an area has an unknown water depth or an unknown obstacle height, the Auto Guidance line is not calculated in that area.
- Page 51 Device Configuration 9. Complete an action: • If the placement of the Auto Guidance line is satisfactory, select Menu > Stop Navigation. Proceed to step 11. • If the Auto Guidance line is too close to known obstacles, from the Home screen, select Configure > Navigation >...
- Page 52 Device Configuration Units of Measure You can set the units of measure the chartplotter shows, using a standardized system of measurements or creating a customized system of measurements. Selecting a Standardized System of Measurement 1. From the Home screen, select Configure > Units > System Units. 2.
- Page 53 Device Configuration Selecting a Data Overlay 1. From the Home screen, select Charts. 2. Select a chart or a 3D chart view. 3. Select Menu. 4. Complete an action: • Select Navigation Chart Setup > overlay Numbers. • Select Fishing Chart Setup > overlay Numbers. •...
-
Page 54: Information About Your Boat
Select oK, and safely increase the boat speed. If the message appears again, stop the boat, and ensure that the speed-sensor wheel is not stuck. If the wheel turns freely, check the cable connections. If you continue to get the message, contact Garmin Product Support. GPSMAP 700 Series Owner’s Manual... -
Page 55: Alarms
Device Configuration Setting the Fuel Capacity of Your Boat 1. From the Home screen, select Configure > My Boat > Fuel Capacity. 2. Enter the combined fuel capacity of all the engines on your boat. 3. Select Done. Alarms By default, all alarms are turned off, except the destination and weather alarms. The chartplotter must be on for the alarms to work. -
Page 56: Chartplotter Data Management
Device Configuration Setting the GPS Accuracy Error Alarm You can set an alarm to sound when the GPS location accuracy falls outside the user-defined value. 1. From the Home screen, select Configure > Alarms > System > GPS Accuracy > on. 2. -
Page 57: Backing Up Data To A Computer
1. Insert a memory card into an SD card reader that is attached to the computer. 2. Copy a backup file from the computer to the memory card, into a folder named Garmin\UserData. 3. Insert the memory card into the SD card slot on the chartplotter. -
Page 58: Radar
12° above and below a line extending horizontally from the center of the radar. Avoid looking directly at the radar, because the eyes are the most-susceptible parts of the body. When you connect your chartplotter to an optional Garmin marine radar such as a GMR 404/406 or a GMR ™... -
Page 59: Radar Display Modes
Radar Radar Display Modes The Radar screen has four standard operating modes. Each mode is available for use only with a compatible radar. • Cruising mode—shows a full-screen image of the gathered radar information. • Harbor mode—intended for use in inland waters, this mode works best with short-range radar signals (2 nm or less). - Page 60 Radar Harbor Mode Harbor mode is the standard radar operation for use in inland waters, with a GMR 604 xHD, 606 xHD, 1204 xHD, or 1206 xHD radar. Harbor mode works best with short-range radar signals (2 nm or less). NoTe: If you switch from Sentry mode to Harbor mode, the radar switches to full-time transmission and disables all guard zones.
-
Page 61: Sentry Mode
You can also enable a guard zone in this mode, which identifies a safe zone around your boat and sounds an alarm when a radar object enters this zone. Sentry mode works with all Garmin GMR model radars. Showing Sentry Mode From the Home screen, select Radar >... - Page 62 Radar 4. Touch the location of the inner guard-zone corner. 5. Select Done. Defining a Circular Guard Zone You must enable a guard zone before you can define the boundaries of the zone (page 57). You can define a circular guard zone that completely encompasses your boat. 1.
- Page 63 Radar Showing AIS Vessels on the Radar Screen AIS requires the use of an external AIS device and active transponder signals from other vessels. You can configure how other vessels appear on the Radar screen. If any setting (except the AIS display range) is configured for one radar mode, the setting is applied to every other radar mode.
-
Page 64: Waypoints And Routes On The Radar Screen
Radar Hiding the VRM and the EBL 1. From the Home screen, select Radar. 2. Select Cruising, Harbor, or offshore. 3. Select Menu > Adjust VRM/eBL > Hide VRM/eBL. Measuring the Range and Bearing to a Target Object while VRM and EBL are Hidden If you have hidden VRM and EBL (page 60), you can quickly display the range and bearing to a location by... -
Page 65: About The Radar Overlay
Radar 6. Select Cruising, Harbor, offshore, or Sentry. The route appears as a magenta line, with the starting point, the destination, and turns indicated. 7. Review the course indicated by the magenta line. 8. Follow the magenta line along each leg in the route, steering to avoid land, shallow water, and other obstacles. -
Page 66: Optimizing The Radar Display
Radar Radar Overlay and Chart Data Alignment When using the Radar Overlay, the chartplotter aligns radar data with chart data based on the boat heading, which is based by default on data from a magnetic heading sensor connected using a NMEA 0183 or NMEA 2000 network. - Page 67 Radar Tips for Selecting a Radar Range • Determine what information you need to see on the radar display. For example, do you need information about nearby weather conditions or targets and traffic, or are you more concerned about distant weather conditions? •...
- Page 68 Radar Manually Adjusting Gain on the Radar Screen For optimal radar performance that accounts for actual conditions, you can manually adjust the gain. NoTe: Depending upon the radar in use, the gain setting configured for use in one radar mode may or may not be applied to other radar modes or to the Radar Overlay (page 63).
- Page 69 Radar Adjusting Sea Clutter on the Radar Screen You can adjust the appearance of clutter caused by choppy sea conditions. The sea clutter setting affects the appearance of nearby clutter and targets more than it affects the appearance of distant clutter and targets. A higher sea clutter setting reduces the appearance of clutter caused by nearby waves, but it can also reduce or eliminate the appearance of nearby targets.
-
Page 70: Radar Display Appearance
Radar 4. Complete an action: • Select High, Medium, or Low to decrease or increase the appearance of rain clutter, if using a GMR 20, 21, 40, 41, 18, 18 HD, 24, 24 HD, 404, or 406 radar. Other targets should remain clearly visible on the Radar screen. -
Page 71: Radar Display Settings
Radar Configuring Data Fields on a Radar You can select the type of data shown within a data field. 1. From the Home screen, select Radar. 2. Select Cruising, Harbor, offshore, or Sentry mode. 3. Select Menu > Radar Setup > overlay Numbers. 4. - Page 72 Radar Shifting the Field of View on the Radar Screen You can shift your present location toward the bottom of the screen automatically as your speed increases. Enter your top speed for the best results. This setting applies to every radar mode. This setting does not apply to the Radar Overlay.
-
Page 73: Radar Overlay Display Appearance
Radar Front-of-boat Offset The front-of-boat offset compensates for the physical location of the radar scanner on a boat, if the radar scanner does not align with the bow-stern axis. Measuring the Potential Front-of-boat Offset 1. Using a magnetic compass, take an optical bearing of a stationary target located within viewable range. 2. - Page 74 Radar Radar Overlay Navigation Display Settings Changing the Map Zoom Detail You can adjust the amount of detail shown on the map, at different zoom levels, for the Radar Overlay. 1. From the Home screen, select Charts > Radar overlay > Menu > Setup > Chart Setup > Detail. 2.
-
Page 75: Sonar
Sonar Sonar When connected to a transducer, the following 700 series models can be used as fishfinders: • GPSMAP 720s • GPSMAP 740s • GPSMAP 750s Sonar Views The chartplotter shows sonar data using three different views: a full-screen view, a split-zoom view, and a split-frequency view. - Page 76 Sonar Split-zoom Sonar View The split-zoom sonar view shows a full-view graph of sonar readings, and a magnified portion of that graph, on the same screen. From the Home screen, select Sonar > Split Zoom. ➊ ➋ ➍ ➎ ➌ ➏...
-
Page 77: Depth Log
Sonar Depth Log If you are using a depth-capable transducer, or are receiving water depth information via NMEA 0183 or NMEA 2000, the Depth Log displays a graphic log of depth readings over time. The depth appears in the upper-left corner of the screen. The graph scrolls to the left as information is received. From the Home screen, select Sonar >... -
Page 78: Waypoints On The Sonar Screen
Sonar 3. Complete an action: • Select Duration to set the time-elapsed scale . The default setting is 10 minutes. Increasing the time- ➊ elapsed scale allows you to view temperature variations over a longer period of time. Decreasing the time-elapsed scale allows you to view more detail over a shorter period of time. - Page 79 Sonar Showing Surface Noise You can set whether the sonar returns near the surface of the water appear. Hide surface noise to help reduce clutter. From the Home screen, select Sonar > Sonar Setup > Surface Noise > Show. Showing and Configuring a Depth Line You can set whether a quick-reference depth line appears.
-
Page 80: Selecting Frequencies
Sonar Showing and Configuring the Whiteline You can highlight the strongest signal from the bottom to help define the hardness or softness of the signal. 1. From the Home screen, select Sonar > Sonar Setup > Whiteline. 2. Complete an action: •... -
Page 81: Sonar Alarms
Sonar Adjusting the Range of the Depth Scale You can adjust the range of the depth scale that appears on the right side of the screen. 1. From the Home screen, select Sonar. 2. Select a sonar view. 3. Select Menu > Range. 4. -
Page 82: Transducer Configuration
Sonar Transducer Configuration Setting the Keel Offset The keel offset compensates for the surface reading for the depth of a keel, making it possible to measure depth from the bottom of the keel instead of from the transducer location. Enter a positive number to offset for a keel. -
Page 83: Digital Selective Calling
(page 81). The chartplotter allows you to quickly set up and send individual routine call details to your Garmin VHF radio (page 83). When you initiate a man-overboard distress call from your radio, the chartplotter shows the man-overboard... -
Page 84: Incoming Distress Calls
DSC distress call from your radio, your Garmin chartplotter shows the man-overboard screen and prompts you to navigate to the man-overboard point. If you have a Garmin autopilot system connected to the network, your chartplotter prompts you to start a Williamson’s turn to the man-overboard point. -
Page 85: Position Tracking
Digital Selective Calling Position Tracking When you connect your Garmin chartplotter to a VHF radio using NMEA 0183, you can track vessels that send position reports. This feature is also available with NMEA 2000, provided that the vessel sends the correct PGN data (PGN 129808;... - Page 86 Digital Selective Calling Vessel Trails on the Navigation Chart You can view trails for all tracked vessels on the Navigation chart, the Fishing chart, and the Mariner’s Eye 3D chart view. By default, a black dot appears for each previously reported position of a tracked vessel, and a ➊...
-
Page 87: Individual Routine Calls
6. Select a color for the trail line. Individual Routine Calls When you connect your Garmin chartplotter to a Garmin VHF NMEA 2000-compatible radio, you can use the chartplotter interface to set up an individual routine call. When setting up an individual routine call from... -
Page 88: Appendix
Appendix Appendix Specifications Physical Specifications Specification Measurement Size W × H × D: 8 × 5 × 3 in. (226 × 142 × 80 mm) Weight 2.48 lb. (1.125 kg) Display W × H: 6 × 3 in. (152 × 91 mm) Case Fully gasketed, high-impact plastic and aluminum alloy, waterproof to IEC 60529 IPX-7 Temp. -
Page 89: Screenshots
From the Home screen, select Configure > System > System Information > event Log. Saving System Information to a Memory Card You can save system information to a memory card as a troubleshooting tool. A Garmin Product Support representative may ask you to use this information to retrieve data about the network. -
Page 90: Nmea 0183 And Nmea 2000
• Select Serial Port 2. 3. Select an input/output format: • Select Garmin Data Transfer to support the input or output of Garmin-proprietary data for interfacing with Garmin software. • Select NMeA Std. to support the input or output of standard NMEA 0183 data, DSC, and sonar NMEA input support for the DPT, MTW, and VHW sentences. - Page 91 Appendix Configuring Waypoint Identification 1. From the Home screen, select Configure > Communications > NMeA 0183 Setup > Waypoint IDs. 2. Complete an action: • Select Names to transmit waypoint names via NMEA 0183 while navigating. • Select Numbers to transmit waypoint numbers while navigating. This option may resolve compatibility with older NMEA 0183 autopilots.
- Page 92 Appendix Selecting a Preferred Data Source If more than one data source is available, you can select the data source you want to use. 1. From the Home screen, select Configure > Communications > Preferred Sources. 2. Select a type of data. 3.
-
Page 93: Registering Your Device
Contacting Garmin Product Support Contact Garmin Product Support if you have any questions about this product: • In the USA, go to www.garmin.com/support, or contact Garmin USA by phone at (913) 397.8200 or (800) 800.1020. • In the UK, contact Garmin (Europe) Ltd. by phone at 0808 2380000. -
Page 94: Index
Index Index BlueChart g2 Vision aerial photos dangerous depth chart symbols data data cards backup active tracks Fish Eye 3D copying clearing Mariner’s Eye 3D data cards retracing POIs BlueChart g2 Vision saving bridging, output data fields add turn brightness, display chart aerial photos 16, 20... - Page 95 VHF radio sonar north heading 8, 43, 67 Mariner’s Eye 3D Garmin Product Support gauges data bars analog object information hazard colors digital off course alarm lane width engine...
- Page 96 Index rated minimum data bars rear panel daylight saving time panning registration deep water 3D views charts reset depth line Review depth units Perspective 3D roses detail rotating, 3D view details 14, 59 data bars routes display range 14, 59 lane width object information bypassing waypoint...
- Page 97 Index safety shading speed data VHF radio screenshot capture speed filter calling an AIS target scroll speed speed sensor 42, 45, 50, 74 distress calls sea clutter split-frequency view DSC channel service points split zoom view individual routine calls shallow water spot depth soundings shoreline distance suspended targets...
- Page 100 For the latest free software updates (excluding map data) throughout the life of your Garmin products, visit the Garmin Web site at www.garmin.com. © 2010 Garmin Ltd. or its subsidiaries Garmin International, Inc. 1200 East 151 Street, Olathe, Kansas 66062, USA Garmin (Europe) Ltd.
Need help?
Do you have a question about the GPSMAP 720/720s and is the answer not in the manual?
Questions and answers