
Related Manuals for THORLABS BP209-VIS


Summary of Contents for THORLABS BP209-VIS
- Page 1 Thorlabs Beam Beam Analyzing Software BP209-VIS(/M), BP209IR1(/M), and BP209-IR2(/M) with M2MS(-AL) Operating Manual 2022...
- Page 2 Version: Date: 14-Feb-2022 Copyright © 2022 Thorlabs...
-
Page 3: Table Of Contents
Contents Foreword 1 General Information Ordering Codes and Accessories Requirements 2 Getting Started Parts List BP209-VIS(/M), BP209IR1(/M) and BP209-IR2(/M) Parts List M2MS with BP209 Series 3 Operating Elements BP209 Series 3.1.1 Rotation Mount Mounting BP209 Series 4 Installation Software Installation... - Page 4 6.5.4.2 Averaging Mode 6.5.4.3 Clip Level 6.5.4.4 Hold Maximum 6.5.4.5 Autoscale to Peak 6.5.4.6 Correct Beam Width 6.5.4.7 Reference Position 6.5.4.8 Unit 6.5.5 Plot Over Time Parameter 6.5.6 Translation Stage Control Child Windows 6.6.1 2D Reconstruction 6.6.2 3D Profile 6.6.3 X and Y Profiles 6.6.4 Zooming and Panning Diagrams...
- Page 5 7.2.6.1 Mounting the Beam Profiler 7.2.6.2 Connecting M2MS to the PC 7.2.7 M² Measurement 7.2.7.1 Beam Alignment 7.2.7.2 M² Measurement Panel 7.2.7.3 M² Settings 7.2.7.4 Saving the M² Measurement Results 7.2.7.5 Running the M² Measurement 7.2.7.6 M² Measurement Results 7.2.7.7 M²...
- Page 6 Drawing BP209 Mounting Adapter 11.10 Drawing M2MS-BP209 11.11 Compatibility with Older Hardware 11.12 List of Acronyms 11.13 Safety 11.14 Certifications and Compliances 11.15 Return of Devices 11.16 Manufacturer Address 11.17 Warranty 11.18 Exclusion of Liability and Copyright 11.19 Thorlabs Worldwide Contacts...
-
Page 7: Foreword
Paragraphs preceded by this symbol explain hazards that could damage the instrument and the connected equipment or may cause loss of data. Note This manual also contains "NOTES" and "HINTS" written in this form. Please read this advice carefully! © 2022 Thorlabs... -
Page 8: General Information
1 General Information 1 General Information The BP209 Series Thorlabs Dual Scanning Slit Beam Profilers are ideal for analyzing cross sectional profiles of near-Gaussian laser beams and can be operated in scanning-slit or knife- edge modes. The beam diameter is measured in accordance with the ISO 11146 standard and can be displayed using a number of industry-standard clip levels or an arbitrary clip level set by the user. -
Page 9: Requirements
1.2 Requirements These are the requirements for the PC intended to be used for operation of the BP209 Series of slit beam profilers using the Thorlabs Beam Software V8.0 or higher. Please find the BEAM Software for download from the Beam Software website. -
Page 10: Getting Started
BP209 Series Beam Profiler, the package will contain the following items: 1. M2MS-BP209VIS-AL(/M) · M2MS-BP209VIS-AL (/M) Measurement System with mounted BP209-VIS (/M) Slit Beam Profiler · Power supply 100 to 240 V AC / 15 V 3 A DC ·... - Page 11 · 1 pcs. LA5255-D Plano Convex Lens, f = 250 mm, AR coating 1650 - 3000 nm · 4 pcs. CL6 Rail clamps · 1 pcs. M2MS Adjustment laser · 1 pcs. Ball Driver 3 mm · 1 pcs. spare screw M4x10 · Quick Reference Rev: 8.1, 14-Feb-2022 © 2022 Thorlabs Page 9...
-
Page 12: Operating Elements
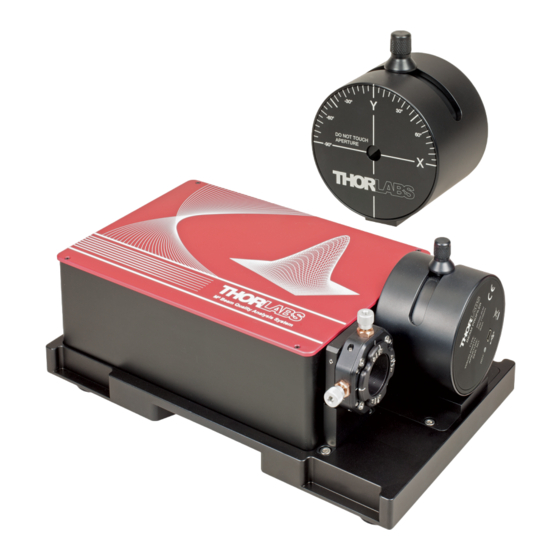
BP209 Series 3 Operating Elements 3 Operating Elements 3.1 BP209 Series The components of the BP209-VIS are labeled in the image below. Aside from the mounting thread on the Mounting Plate , BP209-VIS and BP209-VIS/M are identical. BP209IR1(/M) and BP209-IR2(/M) outer dimensions and components are identical to BP209-VIS(/M). -
Page 13: Rotation Mount
Y profiles. Determine the point where the profile width in one axis reaches the minimum and the maximum in the other axis. Note Without scan axes alignment the ellipticity measurement may become erroneous! Rev: 8.1, 14-Feb-2022 © 2022 Thorlabs Page 11... -
Page 14: Mounting Bp209 Series
All metric models have a M4 and a M6 thread and the imperial models have an 8-32 and a 1/4-20 thread. Metric Version Imperial Version Please mount the BP209 Series Beam Profiler on the optical bench using a Thorlabs post, post holder and a base or clamping fork. -
Page 15: Installation
· Windows Security will ask your confirmation to install the Thorlabs USB driver. · You may check the box "Always trust software from "Thorlabs GmbH".This will shorten the in- stallation. However, if you do not want to do that, please click the "Install" button. You will then be asked to confirm the installation of further Thorlabs software components. -
Page 16: Start The Application
4 Installation 4.3 Start the Application Click the "Programs" g "Thorlabs" g "Thorlabs Beam Application" entry, or simply click the ap- propriate icon added to your desktop. The connected instrument is recognized, automatically connected and shown in the Beam Set-... -
Page 17: Operating Principle
Note that this power measurement readout is the result of a separate integral beam power measurement (through the ND filter), and not a result of mathematical integration across the scanned beam profile. Rev: 8.1, 14-Feb-2022 © 2022 Thorlabs Page 15... -
Page 18: The Graphics User Interface (Gui)
6 The Graphics User Interface (GUI) 6 The Graphics User Interface (GUI) In this manual, the Beam Software is described based on a setup using a BP209-VIS/M on the M2MS measurement extension for M measurements, connected to a PC running with OS ®... -
Page 19: Menu Bar
If the 3D Profile window is opened, a screenshot of the 3D Profile is also included in the test report. See some detailed examples for data export in the Save Measurement Results chapter. Rev: 8.1, 14-Feb-2022 © 2022 Thorlabs Page 17... -
Page 20: Control Menu
BP209 Series 6 The Graphics User Interface (GUI) 6.1.2 Control Menu Use the first menu entry to start and pause the continuous operation of the Beam Profiler device including retrieving measure- ment data, performing calculations and displaying graphs and nu- merical results to the output windows. -
Page 21: Options Menu
To do so a few things need to be considered. When starting the software, the application loads valid *.lut files from the folder: ...\My Documents\Thorlabs\Thorlabs Beam\LUT A valid *.lut file must fulfill the following criteria: ·... - Page 22 BP209 Series 6 The Graphics User Interface (GUI) · Values must be tab-separated · The first three columns have 256 entries · The last six columns have only 129 · Each value represents a 8 bit intensity (0- 255) of R(ed), G(reen) and B(lue), respectively. The first three columns represent the linear scale of a user-made color scale, the next three columns represent the scale for lower intensities (logarithmic scale) and the last three columns the scale for higher intensities (quad scale).
- Page 23 Every Meas. For every measurement, the data are plotted Max. Data Points 100000 The maximum number of data to be plotted Velocity 200 mm/s Translation speed of the stage Language The language of the application can be selected. Rev: 8.1, 14-Feb-2022 © 2022 Thorlabs Page 21...
-
Page 24: Windows Menu
BP209 Series 6 The Graphics User Interface (GUI) 6.1.4 Windows Menu When the GUI is started the first time, the Default Workspace is opened. To close and open the windows, toggle the corresponding entry in the windows menu or via the Tool Bar An open child window can also be closed by clicking the S in the up- per right corner of the child window. -
Page 25: Help Menu
Check for Update searches for available software updates. About Thorlabs displays device information and software versions details: If you have trouble with the software, please submit the version of the application to Thorlabs. This can help to resolve your problem. -
Page 26: Tool Bar
BP209 Series 6 The Graphics User Interface (GUI) 6.2 Tool Bar For the most important menu entries there are also symbols provided in the tool bar. Clicking on a toolbar symbol will have the same effect as clicking on the original menu entry. When moving the mouse over the icons, a tool tip will be displayed. -
Page 27: Status Bar
Exception: Gain and bandwidth are set to "Auto", automatic baseline correction disabled. Note The stop state of the previous measurement will be ignored at a new start of the Beam Soft- ware because it always starts in continuous mode. Rev: 8.1, 14-Feb-2022 © 2022 Thorlabs Page 25... -
Page 28: Beam Settings
BP209 Series 6 The Graphics User Interface (GUI) 6.5 Beam Settings The Beam Settings panel is a very convenient visualization of all important information and settings that can be made to the instrument and to the calculation parameters. For a better visi- bility, the Beam Settings topics are arranged in expandable group boxes that allow to show or hide topics. -
Page 29: Optical Setup
· executes a power correction Initial Settings When this Beam Profiler is connected for the first time, the following default values are set: Parameter Default Value 635 nm (BP209-VIS(/M)) Wavelength 500 nm (BP209IR1(/M) 900 nm (BP209-IR2(/M)) Power Correction 6.5.1.1 Wavelength Enter the operating wavelength in nm as a precondition for proper measurement of the Total Power. -
Page 30: Power Correction
BP209 Series 6 The Graphics User Interface (GUI) 6.5.1.2 Power Correction The Power Correction allows the user to set the total beam power measured by the Beam Pro- filer to the power level measured by a reference power meter. Preconditions: Be sure to have set the operating wavelength accurately. -
Page 31: Beam Profiler Information
Samples is the number of measurement values used for beam profile calculation. It is limited by the AD converter sampling rate and varies, depending on the selected aperture width and scan rate. Rev: 8.1, 14-Feb-2022 © 2022 Thorlabs Page 29... -
Page 32: Slit Beam Profiler Parameter
BP209 Series 6 The Graphics User Interface (GUI) 6.5.3 Slit Beam Profiler Parameter This section contains a number of important Beam Profiler parameters that are accessible by the user. Please become familiar with the meaning of these controls in order to prevent im- proper adjustments which may lead to erroneous measurement results. -
Page 33: Gain, Bandwidth And Baseline
The longer the unit operates, the faster the drive runs at the same control voltage. Enabling Scan Rate Correction, a control loop will maintain the scan rate close to the target val- Rev: 8.1, 14-Feb-2022 © 2022 Thorlabs Page 31... -
Page 34: Miscellaneous
Biasing a photo diode decreases its rise time. Set Bias to On for measurement of small beam diameters and M² measurement. Note Biasing is possible only for BP209-VIS and BP209IR1 models. Aperture Width The maximum aperture diameter is 9 mm. The resolution can be improved if using only 10% of... -
Page 35: Calculation Area
A rectangular area, set by user input is defined as Calculation Area. Enter pixel values which describe the Calculation Area position and size or simply drag a rectangle into the 2D Reconstruction window. Rev: 8.1, 14-Feb-2022 © 2022 Thorlabs Page 33... -
Page 36: Averaging Mode
BP209 Series 6 The Graphics User Interface (GUI) When "User Rectangle" is selected, please enter size and position of the Calculation Area numeri- cally or drag and drop the borders of the user rect- angle. All values are in µm, and the point of origin is situated in the upper left corner of the entire sensor area. -
Page 37: Clip Level
The Reference Position can be set to predefined positions (see above) or to a user defined po- sition. The X and Y coordinates of a user defined position are to be entered numerically or set in the 2D Reconstruction (Reference Position Editor): Rev: 8.1, 14-Feb-2022 © 2022 Thorlabs Page 35... -
Page 38: Unit
µm. Total Power units: mW or dBm. Temperature: °C, °F or K. (Temperature is measured by an external Thorlabs TSP01 Envir- onmental Sensor, connected via USB (not included).) The following table gives an overview on all available units: Unit Description µm... -
Page 39: Translation Stage Control
"Translation Stage Control" and "M set" appear as the last two topics of the Beam Settings panel. The description in this section assumes a Thorlabs DDS100 Linear Translation Stage, as it is used in the M2MS Extension Set This panel allows the user to manually control the translation stage. - Page 40 BP209 Series 6 The Graphics User Interface (GUI) Note The total displacement reaches from 0 to 200 mm, although the stage translation path is only 100 mm. This results from the mechanical design of the M2MS M² Meter Set. Increment: Enter the increment for moving the stage stepwise. Velocity: This is the speed of the stage when traveling between two positions (e.g., between the actual and the target position).
-
Page 41: Child Windows
"Windows". Additional child windows are accessible through the menu bar The appearance of the Thorlabs Beam Software can be arranged according to your require- ments and taste. All child windows can be re-sized and flexibly positioned. Here is an example of arranging some child windows: Rev: 8.1, 14-Feb-2022... -
Page 42: Reconstruction
BP209 Series 6 The Graphics User Interface (GUI) To close a child window deselect the menu entry or the appropriate toolbar symbol or click the close button "X". Each child window can be moved and resized. If a child window is closed, size and position are stored and recovered when it is reopened. - Page 43 If the window height is smaller than the full toolbar, the lower symbols are packed into a context menu which is accessible via a arrow button on the bottom of the toolbar. Rev: 8.1, 14-Feb-2022 © 2022 Thorlabs Page 41...
-
Page 44: Profile
BP209 Series 6 The Graphics User Interface (GUI) 6.6.2 3D Profile The 3D Profile illustrates the power density distribution of the measured optical beam. Whereas the beam's cross-section is parallel with the X-Y-plane, the relative power intensity is shown in the Z direction (Pseudo 3D). -
Page 45: And Y Profiles
AD converter saturation of the appropriate slit pair. The amplitude of the Gaussian fit curve may be lower or even higher than the peak intensity of the measured curve. Rev: 8.1, 14-Feb-2022 © 2022 Thorlabs Page 43... -
Page 46: Zooming And Panning Diagrams
BP209 Series 6 The Graphics User Interface (GUI) The selected clip level (default 13.5%) is displayed if the "Auto Scale to Peak" function is en- abled (button The horizontal scale is displayed in µm. Toolbar Associated Action Icon Opens a dialog box to specify the properties of the saved screenshots / dia- grams. -
Page 47: Calculation Results
Click the marked green icon in the table in order to select or deselect parameters to be calculated and displayed. The fewer calculation results are enabled, the higher the speed performance of the software. Rev: 8.1, 14-Feb-2022 © 2022 Thorlabs Page 45... - Page 48 BP209 Series 6 The Graphics User Interface (GUI) Note · Even if the Gaussian and / or Bessel Fit calculations are disabled from display in the Cal- culation results panel, the appropriate fitted curves are still shown in the X and Y Profile win- dows, if enabled there.
- Page 49 · Add date, time stamp, index (optional) · Click "Save Calculations" Lock / Unlock Test Parameters; Load / Save Test Parameter Configuration. These functions are related to the configuration of the Pass / Fail Test functionality. Rev: 8.1, 14-Feb-2022 © 2022 Thorlabs Page 47...
- Page 50 BP209 Series 6 The Graphics User Interface (GUI) Sequential Saving This feature is used to save sequentially sets of the selected calculation results , e.g for a long term analysis. · Select the destination folder (see the preview pane). · Define the file name. ·...
-
Page 51: Manual Vergence Measurement
The Beam Profiler is mounted so that it can slide along the beam propagation trace. This can be done using, for example, a Thorlabs M2 translation stage or a Thorlabs... - Page 52 BP209 Series 6 The Graphics User Interface (GUI) 3. Move the Beam Profiler, measure the distance again, enter the new distance into the box "Position 2" and press the 2nd icon. 4. The beam width at Position 2 is calculated and based on the entered distance change, the vergence angle in X and Y axes is displayed.
-
Page 53: Tuning View
· Peak Position X · Peak Position Y · Centroid Position X · Centroid Position Y · Ellipse Diameter min. · Ellipse Diameter max. · Beam Width Clip X · Beam Width Clip Y Rev: 8.1, 14-Feb-2022 © 2022 Thorlabs Page 51... - Page 54 BP209 Series 6 The Graphics User Interface (GUI) On the scales, the observed minimum and maximum values are shown as blue triangles. They can be reset using the buttons marked above. Page 52 21424-D02...
-
Page 55: Beam Overlapping
The overlay method can be selected in the box "Composite Mode": Overlay "Plus" In "Plus" mode the intensities of the snap shot and the live image are added. This eases the adjustment particularly of regions with lower intensity. Rev: 8.1, 14-Feb-2022 © 2022 Thorlabs Page 53... - Page 56 BP209 Series 6 The Graphics User Interface (GUI) Overlay "Lighten" In "Lighten" mode, within the overlapping region only the "pixel" with higher intensity will be dis- played; the intensities of the snapshot and the current beam are not added. Overlay "Difference" Finally, in the "Difference"...
-
Page 57: Plots
BP209 Series 6 The Graphics User Interface (GUI) 6.6.9 Plots Thorlabs Beam Software offers several additional plot windows to show the beam behavior: Plot Positions Plot Power Plot Diameters Plot Gaussian Fit Plot Environment Data Beam Stability All plot windows are accessible via the "Windows" menu, while Plot Positions, Plot Power and Beam Stability also have buttons in the toolbar. -
Page 58: Plot Positions
BP209 Series 6 The Graphics User Interface (GUI) 6.6.9.1 Plot Positions Toolbar: , Menu bar: Windows -> Plot Positions The positions of X and Y peak and of X and Y centroid positions can be displayed vs. time. Toolbar Icon Associated Action Save Diagram or Image: Opens a dialog box to specify the properties of the saved diagram or image. -
Page 59: Plot Power
The total power measured by the Beam Profiler vs. time can be displayed. Note The power indication of Thorlabs Beam Profiler instruments is not calibrated vs. wavelength, it is based on a typical responsivity curve of the used photo diode and the manually entered... -
Page 60: Plot Diameters
BP209 Series 6 The Graphics User Interface (GUI) 6.6.9.3 Plot Diameters Menu bar: Windows -> Plot Beam Diameters The Plot Diameters window displays the beam diameter over time as the user adjusts settings. This allows to easily monitor the behavior of the beam diameter. 6.6.9.4 Plot Gaussian Fit Menu bar: Windows ->... - Page 61 Save Data: Opens a dialog box to specify the properties of the saved calcu- lation data Clear all plots Show or Hide the grid in the diagram: Autoscale ON/OFF Show or hide the cursor Rev: 8.1, 14-Feb-2022 © 2022 Thorlabs Page 59...
-
Page 62: Plot Environment Data
In this window the position of the X and Y centroids can be logged together with the reading of an externally connected Thorlabs TSP01 temperature sensor vs. time. The temperature axis is located to the left (yellow curve), the centroid position axis (blue and green curves) is shown to the right. -
Page 63: Beam Stability
Plots the reference position as a bright red dot Plots the Gauss / Bessel fitted centroid positions Plots the smallest enclosing circle around centroid position cloud Plot disabled Plot enabled Rev: 8.1, 14-Feb-2022 © 2022 Thorlabs Page 61... - Page 64 BP209 Series 6 The Graphics User Interface (GUI) Most of the beam stability characteristics are given in numeric units: Data Count: The actual count of displayed measurement results. Elapsed Time: Time since last start of stability measurement Max. Distance to Reference Position of the centroid positions is given in distance (X), dis- tance (Y) and as radial distance (R).
-
Page 65: Operation Instructions
For accurate measurement results (power values, M² results) the correct wavelength must be entered. Thorlabs Beam Profiler instruments are not calibrated for power with respect to the wavelength. The power calculation is based on a typical responsivity curve of the used sensor... - Page 66 BP209 Series 7 Operation Instructions The recognized Beam Profiler will be connected automatically, and the continuous image ac- quisition starts. If more than one device was recognized during the initial application start, the first recognized device will be connected and started. Please see section Start the Application for details on how to select a different device.
-
Page 67: Pass/Fail Test
- Minor axis diameter must be between Min. = 2500 and Max. = 2700 µm - Major axis diameter must be between Min. = 2500 and Max. = 2700 µm The test is passed only if both conditions are fulfilled. Rev: 8.1, 14-Feb-2022 © 2022 Thorlabs Page 65... -
Page 68: Save Measurement Results
Note A password can be entered only once and cannot be changed! In case of troubles, please con- tact Thorlabs for a solution. Load / Save Test Parameter Configuration. The Load and Save buttons in the Calculation Results toolbar allow you to load and save the configuration of the pass/fail test. -
Page 69: Export Device Data
To export data to a delimiter separated text document or an image, select "File g Export Device Data ..." from the Menu. A dialog opens and asks for the type of file and the path where to save the file. Select the desired path and file name Rev: 8.1, 14-Feb-2022 © 2022 Thorlabs Page 67... - Page 70 BP209 Series 7 Operation Instructions Intensity Value Text Matrix This is a CSV (comma separated values) file format. The comment "Not for import" is related only to importing into the Beam Software: A data file cannot be imported in order to reconstruct a beam profile.
-
Page 71: Print Windows
Select "File g Print Application Window" or "File g Print Active Window" to print screenshots of the appropriate window. If a PDF creating software is installed as a printer, the screenshot can be printed also as a PDF file. Rev: 8.1, 14-Feb-2022 © 2022 Thorlabs Page 69... -
Page 72: Save Test Protocol
BP209 Series 7 Operation Instructions 7.1.3.3 Save Test Protocol To save a Test Protocol in pdf format select "File à Save Test Protocol". A dialog box opens: Here, additional information can be entered in order to save it together with the test report. The results of the measurement are saved to a compact test protocol. - Page 73 BP209 Series 7 Operation Instructions Example: Rev: 8.1, 14-Feb-2022 © 2022 Thorlabs Page 71...
-
Page 74: Pulsed Laser Sources
7.1.4 Pulsed Laser Sources BP209 Series Beam Profilers can also be used to measure the profile of pulsed laser beams, although the better choice for such applications is the Thorlabs BC207 Series Camera Beam Profiler. Pulsed laser sources with high repetition rate and short pulse duration can be measured in the same way as a CW laser. - Page 75 3 mm: Bandwidth 16 kHz Bandwidth - 125 kHz Gain Index For pulsed lasers, it is recommended that the gain index be set manually in order to avoid sat- uration of the amplifier. Rev: 8.1, 14-Feb-2022 © 2022 Thorlabs Page 73...
-
Page 76: Knife Edge Mode
BP209 Series 7 Operation Instructions 7.1.5 Knife Edge Mode With the 5 µm slits, a beam diameter down to 20 µm can be measured in the standard slit scanning mode. For beam diameters below 20 µm, the BP209 models offer the so called Knife Edge Mode in combination with the 25 µm slit pair. - Page 77 Disable Gaussian and Bessel fits and zoom in the profiles. A proper alignment is reflected in a maximum amplitude and a flat top of the profile. The flat top is a result of the small beam size Rev: 8.1, 14-Feb-2022 © 2022 Thorlabs Page 75...
- Page 78 BP209 Series 7 Operation Instructions and the use of the 25 µm slits (see screen shots above). Then switch in the device settings dia- log to Knife Edge mode: Two new child windows come up (they may overlay each other initially), showing the recon- structed knife edge profiles for the X and Y axis (green curve) along with the measurement data obtained in normal slit scanning method data (dimmed yellow curve): The numeric result window shows the beam parameters:...
-
Page 79: Beam Quality (M²) Measurement
· the ratio of the divergence angle q of the measured beam to that of an ideal Gaussian beam (TEM ) at the same waist diameter d Lower beam quality results from laser imperfections like inhomogeneities which lead to appear- ance of higher transverse modes. Rev: 8.1, 14-Feb-2022 © 2022 Thorlabs Page 77... - Page 80 Beam Profiler does not provide a correct information about the beam quality. Although a single Beam Profiler result is not a measure of beam quality, the Thorlabs Beam Profiler Series can be used to accurately measure the beam quality. For this purpose, a beam propagation measurement is carried out according to the ISO11146 standard.
-
Page 81: M2Ms Operating Principle
For more information about pulsed laser sources read chapter Pulsed Laser Sources 7.2.2 M2MS Operating Principle The Thorlabs M2MS M² Meter System is a compact instrument that includes all components re- quired to measure beam quality: Beam Profiler (not shown below) Linear Translation Stage Thorlabs DDS100... -
Page 82: Beam Diameter Requirements
BP209 Series 7 Operation Instructions 7.2.3 Beam Diameter Requirements The Beam Quality measurement is based on the determination of the waist diameter of a fo- cused beam and the convergence (divergence) of the beam before (after) the beam waist. Ideal Gaussian beams have the best focusability, which results in the minimum possible beam diameter and M²=1. -
Page 83: M² Meter Extension Set
7 Operation Instructions 7.2.4 M² Meter Extension Set The M² Meter Extension Set is an automated stage, compatible with all Thorlabs beam profilers of the BP209 and BC207 Series as well as the former BC106N Series, to scan through the light beam in the Z-axis for the beam profiler to acquire an M2 value. -
Page 84: M² Meter Set With Bp209 Slit Beam Profiler
BP209 Series 7 Operation Instructions 7.2.5 M² Meter Set with BP209 Slit Beam Profiler The M2MS-BP209 set features: · Accurate M² Measurements · Measures Divergence, Waist Diameter, Rayleigh Range and Astigmatism · Compatible with CW and Quasi-CW Pulsed Laser Sources ·... -
Page 85: Setup M2Ms
Keep the stopper and the fixing screw in a safe place. 1 - Transportation Lock 2 - Electromagnetic Endpoint Latch 3. Close the M2MS. Rev: 8.1, 14-Feb-2022 © 2022 Thorlabs Page 83... - Page 86 BP209 Series 7 Operation Instructions Installing the Transportation Lock 1. Switch off the power supply. 2. Remove the 4 screws fixing the top cover using a 0.05" hex key (supplied with the M2MS) and remove the cover. 3. Move the stop latch as indicated in the picture below and place the platform of the stage against the left stop.
-
Page 87: Mounting The Beam Profiler
M6 (metric systems) or 1/4" (imperial systems) hex screw. Place the mounted Beam Profiler into the recess using the dowel pins on the M2MS base plate: Fix it using the supplied M4x10 Hex screws. Rev: 8.1, 14-Feb-2022 © 2022 Thorlabs Page 85... -
Page 88: Connecting M2Ms To The Pc
BP209 Series 7 Operation Instructions 7.2.6.2 Connecting M2MS to the PC The M2MS comprises integrated control electronics with translation stage controller, a USB 2.0 hub and a current source for the alignment laser. Switch to enable Alignment Laser k Output connector for Alignment Laser USB 2.0 hub output ports (to Beam Profiler) USB 2.0 input (from PC) Yellow indicator "Stage active"... -
Page 89: M² Measurement
7. Start the Beam Software. It should automatically connect to the Beam Profiler and to the translation stage. This can be seen in the Beam Settings Panel: 8. Upon starting the Thorlabs Beam Software, the translation stage will be initialized and homed automatically. This means that it is recognized in the tab Stage Selection and moves to the 200 mm position in case it is not there yet. -
Page 90: Beam Alignment
In order to direct the beam under test into the M2MS, a combination of two adjustable mirrors is required, Thorlabs offers a variety of such items. The beam alignment is executed in 3 steps, guided by a software wizard:... - Page 91 7 Operation Instructions 7.2.7.1.1 Coarse Alignment For a coarse alignment, Thorlabs provides an alignment laser that is included with the access- ory box. For this step, the alignment laser is mounted on the M2MS in place of the Beam Pro- filer as described below.
- Page 92 BP209 Series 7 Operation Instructions Page 90 21424-D02...
- Page 93 Displays the current saturation of the Beam Profiler's AD converter. For proper beam alignment function the value must be 40 to 95 %. The green bulb to the right of the numeric field indicates the "GOOD" range. Rev: 8.1, 14-Feb-2022 © 2022 Thorlabs Page 91...
- Page 94 BP209 Series 7 Operation Instructions Note Make sure the rotation mount is oriented upright so that the Y axis of the BP209 Series is loc- ated vertically. Press the Start Wizard button . You will be requested to select whether you want to adjust for M²...
- Page 95 · Click to the Position 1 capture button (0 mm). The stage moves to Position 1 and captures the second centroid position: Centroid captured at Position 1 · Now, the beam displacement and the pointing angle are displayed numerically. Rev: 8.1, 14-Feb-2022 © 2022 Thorlabs Page 93...
- Page 96 BP209 Series 7 Operation Instructions · Align the beam position using the controls of your laser source. Subsequently click the cap- ture button of Position 1 and 2, observe the alignment, and improve it until all four alignment criteria are fulfilled (bulbs must be at least yellow): Well aligned beam position ·...
- Page 97 BP209 Series 7 Operation Instructions Alignment Move Loop · To terminate the loop, click the button. · After finishing, click Next to continue. Rev: 8.1, 14-Feb-2022 © 2022 Thorlabs Page 95...
- Page 98 BP209 Series 7 Operation Instructions · After finishing the Beam Alignment, the wizard guides you to the alignment of the focusing lens. As a first step, capture the beam position without lens, then click "Next": · Verify that the holder of the focal lens is centered (markers on the CXY1 translator and the lens holder should match), place the the mounted focal lens back to the magnetic holder.
-
Page 99: M² Measurement Panel
After a successful M² measurement this button is enabled and Save Data plot data can be saved. Grid Disables/Enables the grid in the diagram PDF Test Protocol Saves the results of a M measurement into a PDF file Rev: 8.1, 14-Feb-2022 © 2022 Thorlabs Page 97... - Page 100 BP209 Series 7 Operation Instructions 2. M² Diagram The measured data are plotted in the diagram. The 4 buttons above the diagram allow the dis- play to be configured: · The buttons Beam Diameter X' (Y') enable / disable the display of the measured data at the individual positions ·...
-
Page 101: M² Settings
Start to Stop positions (or vice versa depending on the position prior to start the measurement). The number of recorded beam widths equates exactly to the entered number of Data Points. Rev: 8.1, 14-Feb-2022 © 2022 Thorlabs Page 99... - Page 102 BP209 Series 7 Operation Instructions The Normal Scan pursues an ISO compliant measurements. The ISO standard requires that "... at least 10 measurements shall be taken. Approximately half of the measurements shall be distributed within one Rayleigh Length on either side of the beam waist, and ap- proximately half of them shall be distributed beyond two Rayleigh Lengths from the beam waist."...
-
Page 103: Saving The M² Measurement Results
7 Operation Instructions 7.2.7.4 Saving the M² Measurement Results Besides the standard function "Save M² Test Results " the Thorlabs Beam Software offers an automatic saving of beam profile data when an M² measurement is executed. 7.2.7.4.1 Saving M² Test Results The beam quality measurement results can be saved in two different ways: 1. - Page 104 BP209 Series 7 Operation Instructions 2. Save Test Protocol Save measurement data as *.pdf file. The Save Test Protocol dialog opens, fill in the desired fields and click Save. The M² Measurement Results will appear in the PDF documents. Page 102 21424-D02...
- Page 105 The Data Export remains active until Disable is checked. If the data shall be saved only once, please check the boxes Select Disable after next measurement to stop the automatic export after the first run of the M² measurement. Rev: 8.1, 14-Feb-2022 © 2022 Thorlabs Page 103...
- Page 106 BP209 Series 7 Operation Instructions Section Export Options Here the data to be exported can be selected by checking the appropriate box. Beam Profile Calculation Results can be saved as .csv, *.txt, or *.xls files. A single file is saved; for each stage position the data are appended to the existing file. The export file con- tains the header (information about Beam Software version, time stamp of measurement start, and information about the used beam profiler) and all calculation results (see section Calcula-...
-
Page 107: Running The M² Measurement
If the Normal Scan is applied the scale on the graph zooms in when the fine scanning adds ad- ditional data points. After this step (at the end of the measurement) the full scan range is shown again. Rev: 8.1, 14-Feb-2022 © 2022 Thorlabs Page 105... -
Page 108: M² Measurement Results
BP209 Series 7 Operation Instructions 7.2.7.6 M² Measurement Results After a successful M measurement, the Beam Quality Measurement window shown below appears. The green bulb indicates that the measurement was successful and fulfills the ISO 11146 standards: In the case that beam criteria different from the ISO standard beam width criteria were used (see M²... - Page 109 Waist Position X' (Y') Z position of the beam waist (smallest beam diameter). This is the calcu- lated beam waist position in mm derived from the curve fit. This value may differ from the posi- tion where the smallest beam width was measured. Rev: 8.1, 14-Feb-2022 © 2022 Thorlabs Page 107...
- Page 110 BP209 Series 7 Operation Instructions Astigmatism is known as the effect that the beam waist in X and Y scan direction is not at the same z position. So there is a difference between the positions of minimal spot diameters z and z Relative Astigmatism is calculated from the Astigmatism values divided by the mean of the Rayleigh Length in X and Y.
- Page 111 In contrast to the Results pane, the results shown here are calculated from the measured data point without a hyperbolic fit. Therefore, the diameter value displayed at the actual waist may differ from the X' (Y') waist diameters. Rev: 8.1, 14-Feb-2022 © 2022 Thorlabs Page 109...
- Page 112 BP209 Series 7 Operation Instructions Reference Measurement After a M² measurement is completed, the results can be saved and afterwards used as a refer- ence. To do this just click the button, the active results become the reference. Further, the reference data are added to the diagram in a different color.
-
Page 113: M² Troubleshooting
Filters and mirrors may impact on the beam profile as well in the case that surfaces are con- taminated. Clean surfaces according to manufacturer's instructions. Rev: 8.1, 14-Feb-2022 © 2022 Thorlabs Page 111... - Page 114 BP209 Series 7 Operation Instructions q Error message "The M2 Measurement has been aborted: Insufficient beam diameter variation over the selec- ted scan range." The software could not locate sufficient measurement points within the doubled Rayleigh Length. · Extend the Measurement Range ·...
- Page 115 Usually this happens if the beam waist is close to one of the scan end positions. Extend the scan range. · Reset the M² Settings to default - that sets the scan range to its maximum Rev: 8.1, 14-Feb-2022 © 2022 Thorlabs Page 113...
-
Page 116: Live Adjustment
BP209 Series 7 Operation Instructions 7.2.7.8 Live Adjustment Open the Live Adjustment panel and click "start" to move the M2 stage to the lense focus plane as calculated from the inserted parameters. Now, the laser system can be adjusted and, for ex- ample, collimation can be optimized until the beam width in the focus plane is minimized. -
Page 117: Divergence Measurement
In most cases the light source is a device with open beam output. In order to direct the beam under test into the M2MS, a combination of two adjustable mirrors is required, Thorlabs offers a variety of such items. The beam alignment is executed in 2 steps, guided by a software wizard:... - Page 118 7 Operation Instructions 7.2.8.1.1 Coarse Alignment For a coarse alignment, Thorlabs provides an alignment laser that is included with the access- ory box. For this step, the alignment laser is mounted on the M2MS in place of the Beam Pro- filer as described below.
- Page 119 BP209 Series 7 Operation Instructions Rev: 8.1, 14-Feb-2022 © 2022 Thorlabs Page 117...
- Page 120 BP209 Series 7 Operation Instructions Explanation of indicators and icons Start the Alignment Wizard Start the Focusing Lens Alignment Wizard Z [mm] This box shows the actual stage position; after initialization = 200 mm. Position 1 (2) [mm] The left and right positions for the stage movement can be entered nu- merically.
- Page 121 2 - the centroid is captured, and its crosshair color changes to amber. As the actual beam centroid that is marked by a blue crosshair, is located at the same position, the resulting color is white: Rev: 8.1, 14-Feb-2022 © 2022 Thorlabs Page 119...
- Page 122 BP209 Series 7 Operation Instructions Centroid captured at Position 2 · Click to the Position 1 capture button (0 mm). The stage moves to Position 1 and captures the second centroid position: Centroid captured at Position 1 · Now, the beam displacement and the pointing angle are displayed numerically. Page 120 21424-D02...
- Page 123 The stage starts a loop move, dwelling at the stop po- sition for the given time. During the dwelling a realignment can be made. Please keep in mind, that the numeric alignment indicators are being updated only after the next move. Rev: 8.1, 14-Feb-2022 © 2022 Thorlabs Page 121...
- Page 124 BP209 Series 7 Operation Instructions Alignment Move Loop · To terminate the loop, click the button. · After finishing, click Next to continue. Page 122 21424-D02...
-
Page 125: Divergence Measurement Panel
The buttons Beam Diameter X' (Y') enable / disable the display of the measured data at the individual positions. The buttons Divergence Fit X' (Y') enable / disable the curve fit to the measured data points. Rev: 8.1, 14-Feb-2022 © 2022 Thorlabs Page 123... - Page 126 BP209 Series 7 Operation Instructions After the measurement is finished, below the diagram the Divergence results for the X and Y axes are displayed. The indicator to the left shows if the measurement was successful. The red marked button between the toolbar and the diagram expands the diagram over the entire Divergence window.
-
Page 127: Divergence Measurement Settings
0 mm Stop 200 mm Min. Data Points Timeout 15 sec Device Settings It is important to set Gain and Bandwidth of the Beam Profiler (see Slit Beam Profiler Parame- ) to Auto. Rev: 8.1, 14-Feb-2022 © 2022 Thorlabs Page 125... -
Page 128: Saving The Divergence Measurement Results
BP209 Series 7 Operation Instructions 7.2.8.4 Saving the Divergence Measurement Results Besides the standard function "Save Divergence Measurement Results" the Thorlabs Beam Software offers an automatic saving of beam profile data when a Divergence measurement is executed. For details, please see section Saving the M²... -
Page 129: Divergence Measurement Results
Divergence Asymmetry Asymmetry is the quotient of divergence angles in Y and X scan direc- tions. Values differing from 1.0 indicate that the beam ellipticity is changing with z position, for instance an elliptical beam is focused to a round spot. Rev: 8.1, 14-Feb-2022 © 2022 Thorlabs Page 127... - Page 130 BP209 Series 7 Operation Instructions Reference Measurement The actual measurement results can be saved and used as reference afterwards, same as for M² Measurement Results Page 128 21424-D02...
-
Page 131: Live Adjustment
Panel of this window opened through the icon on the left. Centroid Position: The Centroid position is displayed to maintain knowledge of the beam posi- tion during adjustment. Adjustment in Z is facilitated by the slider on the bottom right. Rev: 8.1, 14-Feb-2022 © 2022 Thorlabs Page 129... -
Page 132: M² Theory
BP209 Series 7 Operation Instructions 7.2.9 M² Theory The diameter d(z) of a focused laser beam increases with distance z from its waist position and can be calculated as follows: with Waist Diameter Rayleigh Length Wavelength In this equation it was assumed that the waist location is at zero. Otherwise z has to be replaced with (z-z The Rayleigh Length z determines the distance from the beam waist to the position where the... - Page 133 (green curve). If beam quality worsens (red curve), the beam waist increases. If divergence is fixed, beam waist increases linearly by the factor M compared to the underlying Gaussian. Rev: 8.1, 14-Feb-2022 © 2022 Thorlabs Page 131...
- Page 134 BP209 Series 7 Operation Instructions The appropriate power density at z is reduced by a factor (M²)². Also the Rayleigh Length increases by a factor of M². Page 132 21424-D02...
-
Page 135: Write Your Own Application
® · for Windows 8.1 (64 bit) and Windows 10 (64 bit): Install "Thorlabs Beam VXIpnp In- strument Driver (64 bit)" In other words, the 32 bit VXIpnp driver works with both 32 and 64 bit operating systems, while the 64 bit driver requires a 64 bit operating system. -
Page 136: Bit Operating System
LabVIEW installation folder.) python driver C:\Program Files\IVI Foundation\VISA\WinNT\TLBP2\Examples\Python .net wrapper dll C:\Program Files\Microsoft.NET\Primary Interop Assemblies… …\Thorlabs.TLBP2_32.Interop.dll C:\Program Files\IVI Foundation\VISA\VisaCom\… …\Primary Interop Assemblies\ Thorlabs.TLBP2_32.Interop.dll Example for C Project file: C:\Program Files\IVI Foundation\VISA\WinNT\TLBP2\Examples\… …\CVI Sample\CSample.prj Source file: C:\Program Files\IVI Foundation\VISA\WinNT\TLBP2\Examples\… …\CVI Sample\CSample.c Executable sample demo: C:\Program Files\IVI Foundation\VISA\WinNT\TLBP2\Examples\…... - Page 137 BP209 Series 8 Write Your Own Application Example for C# Solution file: C:\Program Files\IVI Foundation\VISA\WinNT\TLBP2\Examples… …\MS VS 2012 CSharp Demo\DotNet_Sample\Thorlabs.BP2_CSharpDemo… …\Thorlabs.BP2_CSharpDemo.sln Project file: C:\Program Files\IVI Foundation\VISA\WinNT\TLBP2\Examples … …\MS VS 2012 CSharp Demo\DotNet_Sample\Thorlabs.BP2_CSharpDemo… …\Thorlabs.BP2_CSharpDemo.csproj Executable sample demo: C:\Program Files\IVI Foundation\VISA\WinNT\TLBP2\Examples …...
-
Page 138: Bit Operating System
BP209 Series 8 Write Your Own Application 8.2 64 bit Operating System Note According to the VPP6 (Rev6.1) Standard the installation of the 64 bit VXIpnp driver includes the WINNT, WIN64, GWINNT and GWIN64 frameworks. That means, that the 64 bit driver in- cludes the 32 bit driver as well. - Page 139 Executable sample demo: C:\Program Files (x86)\IVI Foundation\VISA\WinNT\TLBP2\Examples\… …\CVI Sample\CSample.exe Example for C# Solution file: C:\Program Files (x86)\IVI Foundation\VISA\WinNT\TLBP2\Examples… …\MS VS 2012 CSharp Demo\DotNet_Sample\Thorlabs.BP2_CSharpDemo… …\Thorlabs.BP2_CSharpDemo.sln Project file: C:\Program Files (x86)\IVI Foundation\VISA\WinNT\TLBP2\Examples … …\MS VS 2012 CSharp Demo\DotNet_Sample\Thorlabs.BP2_CSharpDemo… …\Thorlabs.BP2_CSharpDemo.csproj Executable sample demo: C:\Program Files (x86)\IVI Foundation\VISA\WinNT\TLBP2\Examples …...
-
Page 140: Maintenance And Repair
Do not remove covers! 9.1 Version and Other Information The menu entry Help à About Thorlabs displays relevant Beam Software data. In case of a support request, please submit the software version of the application. This will help to locate the error. -
Page 141: Troubleshooting
· Max Hold was activated - switch off Max Hold mode by clicking the icon. · The "Average over frame" rate might be high, check its value in the Beam Settings panel Rev: 8.1, 14-Feb-2022 © 2022 Thorlabs Page 139... -
Page 142: Warnings And Errors
After reaching the set value, this warning disappears. If it remains, the Beam Profiler seems to be damaged and need factory repair - please contact Thorlabs for return instruction. -
Page 143: Application Note
Beam Profilers, while for Camera Beam Profilers the 4sX' and 4sY' beam widths apply. Peak Position X, Y: position of the pixel with highest intensity (AD value) which is found first with respect to reference position. Rev: 8.1, 14-Feb-2022 © 2022 Thorlabs Page 141... -
Page 144: Ellipse (Fitted)
BP209 Series 10 Application Note is the dial distance of peak position's pixel from the reference position (= sensor center). Centroid Position X, Y and R position (first moment), calculated over all pixels with respect to the above reference position. X= SUM [x * p(x,y)] / I Y= SUM [y * p(x,y)] / I where:... -
Page 145: X-Y-Profile Measurement
Gaussian distribution. Gaussian Intensity is the intensity distribution of the Gaussian fitted beam profile. Gaussian Diameter is the width of the Gaussian fitted profile at a 1/e² intensity clip level. Rev: 8.1, 14-Feb-2022 © 2022 Thorlabs Page 143... -
Page 146: Bessel Fit
BP209 Series 10 Application Note 10.6 Bessel Fit On of the most important properties of a Bessel beam is that it is non-diffractive. This means, apart from Gaussian beams, their shape does not change during propagation, and they do not have a focus in terms of a location with highest intensity along the propagation direction. -
Page 147: Appendix
-40 °C to 70 °C Warm-up time for rated accuracy 15 min ) BP209-VIS(/M); BP209IR1(/M): Beam diameter error <10% at Ø9 mm BP209-IR2(/M): Beam diameter error <20% at Ø9 mm for beam divergence <5° ) 300 kHz using M² Option ) using M²... -
Page 148: Technical Data M2Ms-Bp209
M2MS- Item # BP209VIS- BP209VIS-AL BP209VIS BP209VIS/M AL/M Specification M2MS-Combination Beam Profiler BP209-VIS BP209-VIS/M BP209-VIS BP209-VIS/M 250 - 600 nm 400 - 1100 nm Wavelength Range Beam Diameter Range 20 µm - 9 mm (at Beam Profiler Input Aperture) Power Range 1 µW to 10 W, Depending on Beam Diameter... -
Page 149: Technical Data M2Ms Extension Sets
CW, Pulsed Size 300 mm x 175 mm x 109mm (without Beam Profiler) Typical Measurement Time 15 - 30 s, Depending on Beam Shape and Settings Depending on the Beam Profiler Type Rev: 8.1, 14-Feb-2022 © 2022 Thorlabs Page 147... -
Page 150: Typical Photodiode Response Curves
BP209 Series 11 Appendix 11.4 Typical Photodiode Response Curves The following diagrams show typical response curves photodiodes used in BP209 Series mod- els. Typical Responsivity - UV-enhanced Si Photodiodes Page 148 21424-D02... - Page 151 BP209 Series 11 Appendix Typical Responsivity - Extended InGaAs Photodiodes Rev: 8.1, 14-Feb-2022 © 2022 Thorlabs Page 149...
-
Page 152: Power Ranges
The diagram below shows the allowed input power range at the wavelength of maximum responsivity (BP209-VIS ~ 980 nm; BP209IR1 ~ 1550nm; BP209-IR2 ~ 2200nm): Note Please note that these operating power ranges apply to measurements made using the slits in scanning-slit or knife-edge mode;... -
Page 153: Initial Settings
When the BP209 Series is used first time with the BEAM software, the following initial settings are applied: Parameter Default value Scan Rate 10.0 1/s Scan Rate Correction enabled 635 nm (BP209-VIS) Wavelength 900 nm (BP209IR1, BP209-IR2) Photodiode Bias Aperture Width full width (9 mm) Active Slit Pair 5 µm... -
Page 154: Drawing Bp209
BP209 Series 11 Appendix 11.7 Drawing BP209 Drawing BP209 Series - Imperial Version Page 152 21424-D02... - Page 155 BP209 Series 11 Appendix Drawing BP209 Series - Metric Version Rev: 8.1, 14-Feb-2022 © 2022 Thorlabs Page 153...
-
Page 156: Slit And Photodiode Position
Particularly for diverging beams the operator needs to know the positions and distances of these elements. BP209-VIS BP209IR1 and BP209-IR2 use an aspheric collimating lens between the slit and the photodi- ode:... -
Page 157: Drawing Bp209 Mounting Adapter
BP209 Series 11 Appendix 11.9 Drawing BP209 Mounting Adapter Rev: 8.1, 14-Feb-2022 © 2022 Thorlabs Page 155... -
Page 158: Drawing M2Ms-Bp209
BP209 Series 11 Appendix 11.10 Drawing M2MS-BP209 Page 156 21424-D02... -
Page 159: Compatibility With Older Hardware
Electrical connections and mechanical setup should be carried out as described in the appropri- ate documentation to this hardware, while operation is described in the manual on hand. Older documentation can be downloaded from the Thorlabs Manual Archive at www.thor- labs.com/manuals.cfm. -
Page 160: List Of Acronyms
BP209 Series 11 Appendix 11.12 List of Acronyms The following acronyms and abbreviations are used in this manual: 2 Dimensional 3 Dimensional ADC Analog to Digital Converter Aluminum Anti Reflection Beam Profiler Camera Calculation Area Continuous Wave (constant power source) Graphical User Interface Neutral Density Personal Computer... -
Page 161: Safety
Only with written consent from Thorlabs may changes to single components be carried out or components not supplied by Thorlabs be used. Do not stick anything into the aperture in the middle of the Beam Profiler front! You may damage the thin-skinned slits, spoil the bearings of the motor and/or blockade the rotating drum because there is no covering glass in front of it. -
Page 162: Certifications And Compliances
BP209 Series 11 Appendix 11.14 Certifications and Compliances Page 160 21424-D02... -
Page 163: Return Of Devices
11.17 Warranty Thorlabs warrants material and production of the BP209 Series for a period of 24 months start- ing with the date of shipment in accordance with and subject to the terms and conditions set forth in Thorlabs’ General Terms and Conditions of Sale which can be found at: General Terms and Conditions: https://www.thorlabs.com/Images/PDF/LG-PO-001_Thorlabs_terms_and_%20agreements.pdf... -
Page 164: Thorlabs Worldwide Contacts
EC, and are not dissembled or contaminated. Contact Thorlabs for more informa- tion. Waste treatment is your own responsibility. “End of life” units must be returned to Thorlabs or handed to a company specializing in waste recovery. Do not dispose of the unit in a litter bin or at a public waste disposal site. - Page 165 M² Theory Device Settings Maintenance and Repair Divergence Angle Manual Vergence Divergence Assymetry Measurement Divergence Display MaxHold function Divergence Measurement 115, 126 Microsoft Excel File Divergence Results Mode mixture beam Divergence Settings Rev: 8.1, 14-Feb-2022 © 2022 Thorlabs Page 163...
- Page 166 BP209 Series 11 Appendix Mounting plate slit scanning beam profiler Software Installation Start the Application Status Bar NI-VISA synchronization Numeric Results Technical Data Operating the Instrument TEM00 Ordering Codes Test Protocol Orientation Time-Out Times-diffraction-limit factor Pass/Fail Test Total Power Peak Position Transformed System Performance Optimization Troubleshooting...
- Page 167 www.thorlabs.com...
Need help?
Do you have a question about the BP209-VIS and is the answer not in the manual?
Questions and answers