Hioki 3196 Manual
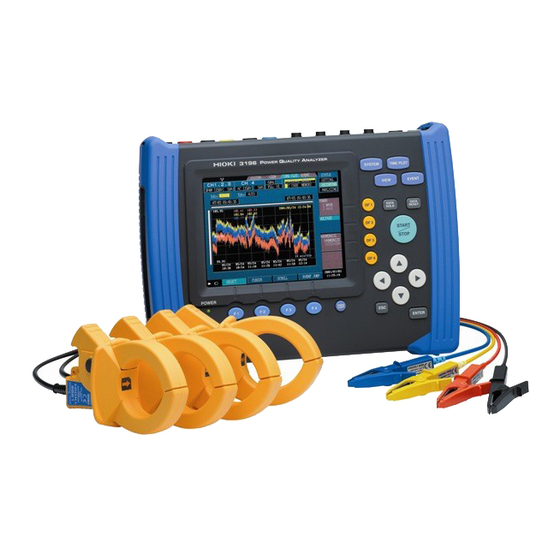
Case studies of
power quality surveys
using power quality analyzer
Hide thumbs
Also See for 3196:
- Instruction manual (64 pages) ,
- Quick start manual (158 pages) ,
- Instruction manual (240 pages)
Table of Contents
Advertisement
Quick Links
Download this manual
See also:
Instruction Manual
Advertisement
Table of Contents

Related Manuals for Hioki 3196


Summary of Contents for Hioki 3196
- Page 1 Case Studies of Power Quality Surveys using Model 3196 Power Quality Analyzer HIOKI E.E. CORPORATION July 2005 Rev. 5...
-
Page 2: Table Of Contents
TABLE OF CONTENTS Power Quality Basics: Current Power Supply Environment Page 1 Power Quality Standards Page 1 Main Power Quality Parameters Page 2 to 4 Case Study 1: Inrush Current and Current RMS Value of a Dryer Page 5 to 6 Case Study 2: Voltage Drop Caused by Wiring Impedance Page 7 to 8... -
Page 3: Power Quality Basics
Power Quality Basics Current Power Supply Environment Various factors can contribute to worsening power quality Open market Increase use of PCs Tough competition to and inverter devices cut costs Power Quality Deterioration Connection Connection with new Connection with on- mixes the energy sources (wind, site power supply different... - Page 4 ITIC (CBEMA) curve The ITIC curve judges the allowable level of voltage RMS fluctuation from the voltage swell, voltage dip and interruption events. The analysis is made by the period and dep th of each event according to the limit value of the ITIC curve.
- Page 5 Voltage Swell 1) Phenomenon Instantaneous rise of RMS voltage 2) Cause Lightning strikes Introducing heavy loads 3) Damage Destruction of power supplies in equipment Instantaneous Interruptions 1) Phenomenon Instantaneous or short/long term power outage 2) Cause Accident on distribution network (Lightning, snow, ice, contact of birds/ trees, effects of accidents) Short-circuit...
- Page 6 Harmonics 1) Phenomenon Voltage or current waveform distortion 2) Cause Thyristor powered conversion devices Inverter, Variable frequency drives 3) Damage Overheating, burning, abnormal sounds or vibration sound caused by the inflow of harmonic current to the equipment Malfunctions due to the harmonics voltage (overheating or burning of reactor for phase advancing capacitor) Flicker...
-
Page 7: Case Study 1
CASE STUDY 1 Inrush Current and Current RMS Value of an Industrial Dryer Environment: Target: 1-phase 2-wire, 100V circuit Problem: This is a simple simulation example. Analysis: By using an industrial dryer (100V AC, 1kW, 50/60Hz), the RMS fluctuation and inrush current are measured while switching the dryer from "OFF=>ON=>COLD=>OFF."... - Page 8 Fluctuation of Current Waveform Peak (+) Fluctuation of Current Waveform Peak (-) A voltage drop of about 4Vrms is measured when the dryer is in operation. The maximum power is 1.1071kW Fluctuation of Voltage RMS Value Fluctuation of Active Power RMS Value Inrush Current Waveform - page 6 -...
-
Page 9: Case Study 2
CASE STUDY 2 Voltage Drop Caused by Wiring Impedance Environment: Target: 1-phase 2-wire, 100V circuit Problem: This is an easy simlulation similar to Case Study 1 to monitor the voltage drop caused by wiri n g impedance. The voltage at a load shows the voltage drop to the supply side when the wire is th in and long. - Page 10 When HOT When HOT 1) Short Wiring 2) Long Wiring Current RMS Value Fluctuation When HOT When HOT 1) Short Wiring 2) Long Wiring Current Peak Value Fluctuation In this dryer example, the current consumption at a load is slightly reduced when the wirng is lon g. The dryer is a resistive load, so that the current consumption, which means the power consumption,...
- Page 11 CASE STUDY 3 Transients Caused by Glow Fluorescent Lighting Environment: Target: 1-phase 2-wire, 100V circuit Problem: This is an example of measuring transient overvoltage when turning on glow fluorescent l i ghting. Analysis: A glow fluorescent light incorporates a glow lamp and is widely recognized as a low-cost alternative to fluorescent lighting.
- Page 12 The power is turned on at the voltage waveform peak (128.9V) and the generated transient overvoltage is 103.1V in the negative direction. Voltage and Current Waveforms When Turning On the Fluorescent Light W hen transient overvoltage occurs, a high current flows instantaneously. This example is measured by using a 10-turn coil without a CT ratio setting.
-
Page 13: Case Study 4
CASE STUDY 4 Switching of Power Factor Correction Capacitor Environment: Target: 1-phase 2-wire, 100V circuit Problem: The power supply of equipment is damaged. Analysis: Some events are recorded by measurement. The switching waveform, which occurs during the power factor correction capacitor switching, is detected. - Page 14 CASE STUDY 5 Voltage Dip (Instantaneous Voltage Drop) - at Receptacle Environment: Target: HIOKI headquarters building, 3-phase 4-wire, 6.6kV receptacle, Secondary side of PT Measured period: 1 year from June 2003 to May 2004 Problem and Analysis: While measuring for 1 year at the receptacle of a 3-phase 6.6kV circuit, a voltage dip is detected only during a lightning strike.
- Page 15 Event Voltage Fluctuation of the Lowest Residual Voltage and the Shortest Period Volta ge Dip 2. Problem on distribution 3. Problem on network 4. Instantaneous voltage drop 5. Malfunction of equipment Protective relay Breaker Protective relay Transformer Breaker Path of a Voltage Dip The instantaneous high voltage is generated by a lightning strike and it shorts the distri bution cable and tower.
-
Page 16: Voltage Dip (Instantaneous Voltage Drop) - At Distribution Panel
CASE STUDY 6 Voltage Dip (Instantaneous Voltage Drop) - at Distribution Panel Environment: Target: HIOKI headquarters building, East side, 5th floor 3-phase 3-wire, 200V distribution panel Measured period: From June 9, 2002 to August 9, 2002 Problem and Analysis: 4 voltage dips caused by lightning were detected during measurement (different period than Case Study 3). -
Page 17: Transient Overvoltage
CASE STUDY 7 Transient Overvoltage Environment: Target: Factory, 3-phase 3-wire, 200V circuit Problem: The screen of equipment does not correctly displ a y. Analysis: A transient overvoltage was detected in all events occurring several times during the measurement. Unfortunately, the cause of the transient could not be deter m ined. Analysis of transient waveform Occurred on all 3 phases (R-S, S-T, T-R) simultaneousl y . -
Page 18: Periodical Instantaneous Voltage Drop
CASE STUDY 8 Periodical Instantaneous Voltage Drop Environment: Target: Retail store, 1-phase 2-wire, 100V outl e t Problem: No apparent trouble is detected, but the voltage fluctuation is big. Analysis: When analyzing the voltage RMS value fluctuation, the following two phenomena were observed. (The graph shows measurement during 12 hours in the night for a period of 2 weeks.) Maximum value: 106.70Vrms, Average value: 102.53Vrms, Minimum value: 93.25Vrms Instantaneous voltage drop occurred every 13 minutes. -
Page 19: General Ups Switching Waveform
CASE STUDY 9 General UPS Switching Waveform Environment: Target: UPS for a desktop PCs sold in retail stores (1-phase 2-wire, 100V) Problem and Analysis: Most low cost UPS used for general purposes output a square wave. However, most people assume that a sine wave is output. Here is a sample waveform output by the UPS. Low cost inverter (variable frequency drive) type Commercial purpose without a compensation function for the voltage distortion, etc. -
Page 20: Voltage Waveform Noise & Ups Switching
Malfunction of equipment Analysis: 68 "Wave (voltage waveform distortion)" events were recorded during an 18-day measurement period using the following settings on Model 3196. All events are of the same typ e. Event Settings of Model 3196 Event List - page 18 -... - Page 21 Next, the waveform of each "wave" event was checked, and 2 types of events were found. No.1: Not switched to a sine wave after the waveform noise No.2: Switched to a sine wave after the waveform noise We can assume that the events "switched to a sine wave after the waveform noise" were due to the switching to the UPS output (stand-by system).
-
Page 22: Voltage Dip In A Factory
CASE STUDY 11 Voltage Dip in a Factory Environment: Target: A factory in Southeast Asia, 1-phase 2-wire, 100V circuit Problem: Power supply is damaged. Analysis: Voltage fluctuation No.1 No.3 No.2 Voltage Fluctuation The following power characteristics were concluded from this 2 week voltage fluctuation graph. Supply voltage Voltage fluctuation graph Voltage value... - Page 23 Event Voltage Fluctuation at the Voltage Dip Occurrence Voltage Waveform at the Start of the Voltage Dip Voltage Waveform at the End of the Voltage Dip - page 21 -...
- Page 24 Summary of analysis Worse power supply quality occurs frequently at night (9 p.m. to 9 a.m.). Worse power quality phenomena starts when the voltage dips. Voltage swell occurs when switching from the commercial power to the UPS due to the voltage dip.
-
Page 25: Inflow And Outflow Of Harmonics
CASE STUDY 12 Inflow and Outflow of Harmonics Environment: Target: 3-phase 3-wire (3P3W2M), 6.6kV circuit Analysis: This is an example of inflow and outflow judgement taken as a result of harmonics measurement Using a 3-phase 3-wire set up, the overall inflow and outflow of a 3-phase installation are judged by the harmonic voltage-current phase difference (θsum). - Page 26 Model 9624 PQA HiVIEW and Model 9624-10 PQA HiVIEW Pro show the harmonic time plot graph by connecting the maximum and minimum values in each interval with a horizontal line. Therefore, a rapid change is reflected in the time plot graph. However, the judgment of inflow and outflow is not easy to make using that time plot graph, so we recommend converting the data to CSV format and creating a graph with "AvePhasesum"...
- Page 27 <Reference> Guideline for the Harmonics of Distribution Network (Japan) Official Report of the Ministry of Economics and Industries in Japan: "Guideline for Harmonics Deterrence Countermeasures on Demand-Side that receives High- Voltage or Special High-Voltage" (September 30, 1994) * The following shows the limit values which measurement instruments can detect. Harmonics Voltage (Total Harmonic Voltage Distortion) 5% at 6.6kV system, 3% at special high-voltage system Harmonics Current...
- Page 28 <Reference> Harmonic Inflow/Outflow judgment on a measurement instrument Judgment by harmonic power Judge the inflow/outflow by the polarity of the harmonic (effective) power. (Judge each phase and each order independent l y.) Inflow Harmonic power is + (positive). Outflow Harmonic power is - (negative). The higher the order, the smaller the harmonics power level.
-
Page 29: Power Quality Survey Procedures
APPENDIX Power Quality Survey Procedures Power quality survey procedures Purpose Step 1: Location of problem (measurement target) Step 2: Advanced confirmation at site (collecting the site information) Step 3: Measure using a power quality analyzer Step 4: 4-1. Normal condition measurement 4-2. - Page 30 Oil leakage, Overheat or loose on circuit breakers Step 4: Measure using a power quality analyzer Start measurement by using a power quality analyzer Confirm the instantaneous value in the VIEW screen of 3196. Normal condition measurement Voltage level, Voltage waveform, Current waveform, Voltage...
- Page 32 HIOKI USA CORPORATION info@hioki.cn 6 Corporate Drive, Cranbury, NJ 08512 U.S.A. www.hioki.cn TEL +1-609-409-9109 / FAX +1-609-409-9108 hioki@hiokiusa.com www.hiokiusa.com All information correct as of July 12, 2005. All specifications subject to change without notice. Copyright © 2005 HIOKI E.E. Corporation...
Need help?
Do you have a question about the 3196 and is the answer not in the manual?
Questions and answers