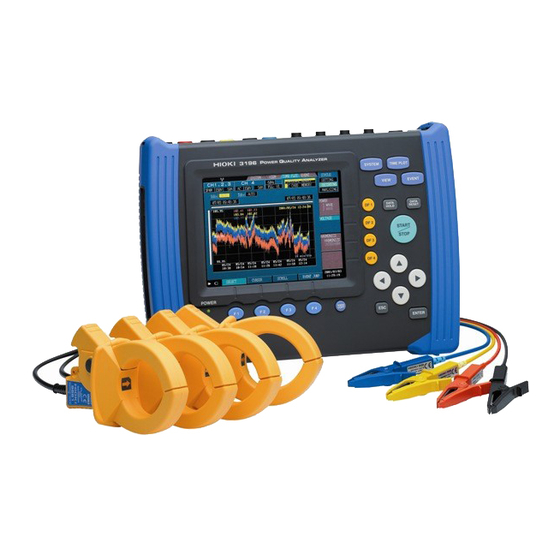
Hioki 3196 Instruction Manual
Power quality analyzer
Hide thumbs
Also See for 3196:
- Instruction manual (64 pages) ,
- Quick start manual (158 pages) ,
- Manual (32 pages)
Table of Contents
Advertisement
Quick Links
Advertisement
Chapters
Table of Contents

Subscribe to Our Youtube Channel
Related Manuals for Hioki 3196


Summary of Contents for Hioki 3196
- Page 1 INSTRUCTION MANUAL 3196 POWER QUALITY ANALYZER...
-
Page 3: Table Of Contents
Contents Contents Introduction.................1 Symbols..................1 Outlook of Operating Procedures..........2 Chapter 1 Overview ___________________________________ 3 Product Overview ............3 Features ...............4 Chapter 2 Key Explanations and Screen Configuration _____ 9 Key Explanations ............9 Screen Names and Configurations ......11 2.2.1 Common Display Areas ..........12 2.2.2 Screen Configurations ...........16 2.2.3... - Page 4 Contents Chapter 5 Using Waveforms, Vectors, DMMs, and Bar Graphs (VIEW Screen)______________________________ 65 Using the VIEW Screen ..........65 Waveform Display ............. 67 Vector Display ............70 DMM Display ............. 73 Harmonics Display ............. 74 5.5.1 Harmonics Bar Graph ........... 74 5.5.2 Harmonics List Screen ..........
- Page 5 Using the PC______________________________ 159 11.1 Remote Control and Monitoring Using an RS-232C Interface ..............160 11.1.1 Connecting a Modem ..........161 11.1.2 Setting the 3196 ............162 11.1.3 Setting the PC .............163 11.2 Control and Monitoring Using a LAN Interface ..167 11.2.1 Connecting the 3196 ...........168 11.2.2 Setting the 3196 ............168...
- Page 6 Contents Appendix ________________________________ 213 Measurement Range and Nominal Voltage......213 TIME PLOT Recording Method ..........215 Event Waveform Recording Method........216 Detecting Anomalies and Phenomena Due to Drops in Power Quality ................ 217 Terminology................218 ΔV10 Flicker Text Time-sequence Data-header Composition226 IEC Flicker Text Time-sequence Data-header Composition .
-
Page 7: Introduction
Introduction Introduction • The 3196 Quick Start Manual accompanies this device. Refer to this guide for precautions, information about connecting peripheral devices, connection methods, and measurement methods. • The present Instruction Manual mainly deals with how to make screen set- tings and how to set peripheral devices. -
Page 8: Outlook Of Operating Procedures
Outlook of Operating Procedures Outlook of Operating Procedures Indicates the purpose Indicates the screen name Indicates the name of an item displayed of the settings. selected with the DF key. on the screen. Displays the item selected in the drop-down Indicates operation keys. -
Page 9: Chapter 1 Overview
1.1 Product Overview Chapter 1 Overview 1.1 Product Overview The 3196 POWER QUALITY ANALYZER detects power line anomali- ties and analyzes power line quality. Need for power supply Electric power liberalization quality analysis Power electronics application devices Large arc heaters, large rectifiers... -
Page 10: Features
1.2 Features 1.2 Features Safe design Designed to comply with safety standard EN61010-1:2001. Supports a variety of power lines Measures single-phase 2-wire, single-phase 3-wire, three-phase 3- wire and three-phase 4-wire systems. An extra input channel is provided for uses such as measuring power lines of a second system, for direct voltage measurement or for mea- suring a neutral line. - Page 11 1.2 Features ΔV10 Flicker, IEC flicker measurement Select either IEC flicker (Pst, Plt) regulated by international standards, or ΔV10 Flicker commonly used in Japan, and measure with power quality parameters. Δ-Y and Y-Δ conversion functions provided Δ-Y conversion can be performed on three-phase 3-wire systems, and Y-Δ...
- Page 12 1.2 Features RS-232C and LAN interfaces provided Connect a PC, printer or modem for remote control and data output. PC Card interface provided Measurement and event data can be preserved by saving to a PC Card. Setting conditions and measurement data can be stored and read back using a PC Card.
- Page 13 1.2 Features Control instrument settings and data acquisition by Web browser HTTP server functions are built in Instrument settings and data acquisition can be controlled by common Internet Web browsers like Internet Explorer or Netscape Navigator. PC application software (option) for analyzing a large volume of data By using the optional PQA-HiVIEW series, a large volume of long-term measurement data recorded on a PC card can be analyzed.
- Page 14 1.2 Features...
-
Page 15: Key Explanations And Screen Configuration
2.1 Key Explanations Key Explanations and Screen Chapter 2 Configuration 2.1 Key Explanations Front Panel DF1 to DF4 keys SYSTEM/ VIEW/ TIMEPLOT/ EVENT key Press these Display Function Select the screen type according to Display DF keys to select the type of dis- the intended usage play. - Page 16 2.1 Key Explanations Front Panel Enhanced View SYSTEM key [SYSTEM] Displays the screen (for select- ing display of system settings). VIEW key [VIEW] Displays the screen (for se- TIME PLOT key lecting an Analysis view) [TIME PLOT] Displays the screen (for selecting the time plot graph).
-
Page 17: Screen Names And Configurations
2.2 Screen Names and Configurations 2.2 Screen Names and Configurations Power ON Each screen type (SYSTEM, VIEW, TIMEPLOT and EVENT) displays the following information in response to the DF keys. Screen Selection WIRING WAVE EVENT • WIRING • VOLT/CURR • 1 ELEMENT •... -
Page 18: Common Display Areas
2.2 Screen Names and Configurations 2.2.1 Common Display Areas The display elements common to all screens on the 3196 are as fol- lows. Top of Screen Internal Status Interface & Hold/Lock Screen Selection*1 Indicators*4 Indicator*2 Indicates the screen type select- ed by the corresponding key. - Page 19 2.2 Screen Names and Configurations *1:Screen Selection Display [SYSTEM]screen....[VIEW]screen ....[TIME PLOT]screen ..[EVENT]screen ....*2:Internal Operating Status Display One of [SETTING], [RECORDING]([WAITING] until preset time to start measuring), or [ANALYZING] is displayed to indicate the internal status of the instrument. The internal status is changed by pressing START/STOP start/stop recording.
- Page 20 2.2 Screen Names and Configurations *3:Memory Usage Indicators INTERNAL MEMORY: Internal memory PC CARD MEMORY: ATA flash card TIME PLOT related data capacity Measurement stops when memory becomes full. (Selectable Stop/Continuous) Total capacity: 5 MB INTERNAL MEMORY Up to 100 EVENT data sets can be stored After 100 events are stored, the earliest are overwritten.
- Page 21 2.2 Screen Names and Configurations *6: Number of repeated recording operations When the repeated recording function is set, the number of repeated recording operations currently set will be indicated. Repeated recording operations can be conducted up to 99 days at one-day measuring intervals, and up to 99 weeks at one-week mea- suring intervals.
-
Page 22: Screen Configurations
2.2 Screen Names and Configurations 2.2.2 Screen Configurations For a detailed description of each screen, see 2.2.3 "Screen Details", and for information about how to make settings, see the references on the right. SYSTEM Screen WIRING 4.2 "Checking the Connec- tion"(page 45) WIRING Displays connection diagrams. - Page 23 2.2 Screen Names and Configurations VIEW Screen VIEW Screen WAVE 5.2 "Waveform Display"(page Displays voltage and current wave- VOLT/CURR forms. You can display entire waveforms or enlarged parts of waveforms. VOLTAGE Displays 4 channels of voltage wave- forms. CURRENT Displays 4 channels of current wave- forms.
- Page 24 2.2 Screen Names and Configurations TIME PLOT Screen 6.3 "Changes in RMS Value"(page 89) 1 ELEMENT You can select one measurement item and display RMS time series graphs for each measurement inter- val of 200 ms. 2 ELEMENT You can select two measurement items and display RMS time series graphs for each measurement inter- val of 200 ms.
- Page 25 2.2 Screen Names and Configurations EVENT Screen EVENT LIST Displays the contents of events in the 7.4 "Event List Dis- event list. play"(page 127) MONITOR Displays an LED on the monitor dis- 7.7 "Event Monitor Dis- play when an event occurs. play"(page 134) EN50160 See the Instruction Man-...
-
Page 26: Screen Details
2.2 Screen Names and Configurations 2.2.3 Screen Details WIRING SYSTEM Screen Press to switch the display screen. WIRING 4.2.1 "Confirming the Connection Diagram"(page 45) Connection diagram corresponding to the connection method Displays (the connection methods for the voltage cord and clamp and) the voltage value, current value, and active power value for each channel. - Page 27 2.2 Screen Names and Configurations MAIN SYSTEM Screen Press to switch the display screen. MEASURE 4.3.1 "Main Settings"(page 49) You can make basic measurement set- tings for the following. • Connection method • Voltage and current ranges • PT and CT ratios •...
- Page 28 2.2 Screen Names and Configurations EVENT SYSTEM Screen Press to switch the display screen. VOLTAGE 7.3.1 "Voltage/Power Event Settings"(page 122) Select the event triggers and set the thresholds. You can set the following as events. • Transient • Swell • Dip •...
- Page 29 9.2 "Using a PC Card"(page 143) Displays the list of files stored on the PC card. You can load the measured data files and settings files stored on the PC card to the 3196, and then save them to the PC card again.
- Page 30 2.2 Screen Names and Configurations WAVE VIEW Screen Press to switch the display screen. VOLT/CURR 5.2 "Waveform Display"(page 67) Displays voltage and current wave- forms for channels, depending on how they are connected. Displays 10 waveforms at 50 Hz, 12 waveforms at 60 Hz, and 80 wave- forms at 400 Hz.
- Page 31 2.2 Screen Names and Configurations VECTOR VIEW Screen Press to switch the display screen. VECTOR 5.3 "Vector Display"(page 70) Displays voltage and current vectors for channels, depending on how they are connected. You can display each order (1st to 50th order) for harmonic analysis as a vec- tors and simultaneously display the harmonic (RMS value or phase angle)
- Page 32 2.2 Screen Names and Configurations VIEW Screen Press to switch the display screen. POWER 5.4 "DMM Display"(page 73) You can display the following items on the DMM display. • Voltage (U) • Current (I) • Active power (P) • Reactive power (Q) •...
- Page 33 2.2 Screen Names and Configurations HARMONICS VIEW Screen Press to switch the display screen. GRAPH 5.5.1 "Harmonics Bar Graph"(page 74) Displays a bar graph for the harmonics and inter-harmonics. Displays three bar graphs for the volt- age, current, and active power simulta- neously.
- Page 34 • Harmonic voltage distortion factor • Harmonic current distortion factor RMS values are calculated in the 3196 at 200 ms intervals without gaps. The maximum, average, and mini- mum values are detected using the multiple 200 ms interval RMS values included in the set interval, and the display changes.
- Page 35 2.2 Screen Names and Configurations VOLTAGE TIME PLOT Screen Press to switch the display screen. INTERVAL 6.4 "Changes in Voltage"(page 93) Displays a voltage fluctuation graph used to calculate the swell, dip, and in- terruption. Voltage is calculated for one waveform shifted over half a wave.
- Page 36 2.2 Screen Names and Configurations HARMONICS TIME PLOT Screen HARM 6.5 "Changes in Harmonics"(page 100) You can display a fluctuation graph for a single harmonic selected from the following. • Harmonic voltage (RMS value, con- tent percentage, and phase angle) •...
- Page 37 2.2 Screen Names and Configurations Flicker analysis is not available when measuring 400 Hz. FLICKER TIME PLOT Screen GRAPH 6.6 "Flicker"(page 104) Δ V10 flicker Displays a graph for IEC flicker or IEC Flicker Displays a fluctuation graph for IEC flicker ( Pst, Plt) .
- Page 38 2.2 Screen Names and Configurations Flicker analysis is not available when measuring 400 Hz. FLICKER TIME PLOT Screen LIST 6.6 "Flicker"(page 104) Δ V10 flicker Displays a list for IEC flicker or IEC Flicker Displays the IEC flicker (Pst, Plt) val- ues in a list.
- Page 39 2.2 Screen Names and Configurations EVENT EVENT Screen LIST 7.4 "Event List Display"(page 127) Displays events in a form list. You can confirm the time and type of event that occurred. By selecting an event with the cursor, you can make a detailed analysis of the event in the VIEW Screen.
- Page 40 2.2 Screen Names and Configurations EN50160 display is not available when measuring 400 Hz. EN50160 EVENT Screen Harmonics Displays detailed judgment results for harmonics, in accordance with the EN50160. Signaling Displays detailed judgment results for signaling voltage, in accordance with the EN50160.
- Page 41 2.2 Screen Names and Configurations EN50160 display is not available when measuring 400 Hz. EN50160 EVENT Screen Setting1 Sets the wiring, voltage range, PT ra- tio, nominal voltage, and thresholds of transient, swell, dip, and interruption, in accordance with the EN50160. Setting2 Sets the thresholds of frequency, volt- age fluctuation, flicker, unbalance fac-...
- Page 42 2.2 Screen Names and Configurations...
-
Page 43: Chapter 3 Connections
Chapter 3 Connections For details about connection precautions, Refer to the Quick Start Manual. 1. Connecting to the 3196 POWER QUALITY ANALYZER Attach the Strap. *If unnecessary, go to step Install the battery pack. Connect the AC adapter and power cord. - Page 44 2. Connecting to the target power line. Set the connection method, nominal WIRING voltage, and frequency. Advanced MEASURE 4.2 "Checking the Connection"(page 45) settings While consulting the connection diagram, connect the voltage cord and clamp sensor to the power line that you want to measure.
-
Page 45: Connection Diagram
3.1 Connection Diagram ê⁄ 3.1 Connection Diagram Single-phase 2-wire (1P2W) A: Line, N: Neutral, G: Ground Load side Source side Black Gray Black U- U+ U- U+ U- U+ U- U+ CH1 CH2 CH3 CH4 U INPUT I INPUT Ground line Face the arrow toward the Load measurement, etc. - Page 46 3.1 Connection Diagram Three-phase 3-wire (3P3W2M) A, B, C: Lines Load side Source side Black Black Yellow U- U+ U- U+ U- U+ U- U+ CH1 CH2 CH3 CH4 U INPUT I INPUT Face the arrow toward the Load U1=U2=200 V I1=I2=50 A Three-phase 3-wire (3P3W3M) A, B, C: Lines...
- Page 47 3.1 Connection Diagram Three-phase 4-wire (3P4W) A, B, C: Lines, N: Neutral, G: Ground Load side Source side Yellow Blue Gray Black Black Black Black U- U+ U- U+ U- U+ U- U+ CH1 CH2 CH3 CH4 U INPUT I INPUT Neutral line Face the arrow toward measurement, etc.
- Page 48 3.1 Connection Diagram...
-
Page 49: Making System Settings (System Screen)
4.1 Using the SYSTEM Screen Making System Settings Chapter 4 (SYSTEM Screen) Confirm the connection diagram. Confirming the Connection Diagram (page 45) Check the connection vectors. Checking the Connection (page 47) Make system settings. Making System Settings (page 49) Make other settings in the SYSTEM screen. Event Settings Screen (page 63) Using Events (EVENT Screen) (page 115) Load/Save Screen (page 64) - Page 50 4.1 Using the SYSTEM Screen Screen operations depending on the internal operation status Screen operations are limited according to the internal operation status. : Possible on all screens ∗: Possible in some screens only Internal operation status Display Settings [SETTING] ∗...
-
Page 51: Checking The Connection
4.2 Checking the Connection 4.2 Checking the Connection 4.2.1 Confirming the Connection Diagram Example: 3P4W (three-phase four-wire) WIRING WIRING Setting the connection method (page 45) Setting the nominal voltage (page 46) Setting the measured frequency (page Setting the connection method WIRING Wiring 1P2W... - Page 52 4.2 Checking the Connection Setting the nominal voltage WIRING U Reference (Nominal voltage) Select from pull- 100 V, 101 V, 110 V, 120 V, 200 V, 202 V, 208 V, 220 V, 230 V, down menu 240 V, 277 V, 346 V, 380 V, 400 V, 415 V, 480 V, 600 V, VARIABLE Nominal voltage affects channels 1 to 3.
-
Page 53: Checking The Connection
4.2 Checking the Connection 4.2.2 Checking the Connection Example: 3P4W (three-phase four-wire) WIRING VECTOR You can check the voltage and current vectors of each connection method. When tolerance levels are set and the voltage or current falls outside these levels, check and correct the connection. When the input level is 50% or less of range, a marker is appended to the perimeter of the current vector to make it recognizable. - Page 54 4.2 Checking the Connection 1. When the RMS voltage value is wrong • Is the voltage clip properly connected to the power line being tested? • Is the voltage cord inserted correctly in the voltage connector? Tolerance levels are 2. When the voltage phase angle is wrong wrong •...
-
Page 55: Making System Settings
4.3 Making System Settings 4.3 Making System Settings 4.3.1 Main Settings MAIN MEASURE Connection method settings (CH 1, 2, 3) (page 50) Connection method settings (CH 4) (page 50) Clamp sensor settings (page 51) Voltage and current range settings (page 51) PT and CT ratio settings (page 52) Nominal voltage settings (page 52) Measured frequency settings (page 53) - Page 56 4.3 Making System Settings Connection method settings (CH 1, 2, 3) MEASURE Wiring 1P2W To measure single-phase two-wire power lines Select from pull- 1P3W To measure single-phase three-wire power lines down menu 3P3W2M To measure single-phase three-wire power lines (using the 2 power meter method) (Use this when measuring three-phase power with 2- spot current measurement only.)
- Page 57 4.3 Making System Settings Clamp sensor settings MEASURE Clamp Set the output rate (the output voltage to input current ratio) of the clamp sensor you are using. Settings of the optional clamp on sensor: Select from pull- 0.1 mV/A, 1 mV/A down menu Use the 9661 CLAMP ON SENSOR 9661...
- Page 58 4.3 Making System Settings PT and CT ratio settings MEASURE V(PT )Ratio VARIABLE, 1, 60, 100, 200, 300, 600, 700, 1000, PT Ratio 2000, 2500, 5000 CT Ratio CT Ratio VARIABLE, 1, 40, 60, 80, 120, 160, 200, 240, 300, 400, 600, 800, 1200 Select from pull- You can set the optional PT(VT) and CT ratios within the 0.01 to...
- Page 59 4.3 Making System Settings Measured frequency settings MEASURE Frequency 50 Hz, 60 Hz, 400 Hz Select from pull- down menu Inter-harmonics, flicker and EN50160 cannot be measured at 400 Confirm Cancel • Set the frequency used for internal processing. • Be sure to note that the calculation result, particularly for harmonics, will be incorrect, if the setting deviates from the nominal frequency of the measuring line.
- Page 60 Normally, line-to-line voltage (LINE-LINE) is measured, but this can be converted to phase-to-neutral voltage (PHASE-N) with internal processing on the 3196. The line-to-line voltage is pro- cessed so that the center of the triangle that created the three- phase line-to-line voltage becomes the neutral point.
- Page 61 4.3 Making System Settings THD calculation method settings MEASURE THD Calc (THD calculation) Select from pull- THD_F The ratio of total harmonics to fundamental wave. down menu THD_R The ratio of total harmonics to total harmonics, funda- mental wave included. The selected THD calculation method is valid for both harmonic volt- Confirm age and harmonic current.
- Page 62 4.3 Making System Settings Flicker calculation settings MEASURE Flicker Flicker measurement is not used. Select from pull- Pst,Plt IEC flicker is measured. down menu ΔV10 Δ V10 flicker is measured. Δ V10 flicker can only be measured on one of voltage channels Confirm U1, U2 or U3.
- Page 63 4.3 Making System Settings IEC flicker filter settings MEASURE Filter 100 V lamp, 120 V lamp, 230 V lamp Select from pull- down menu Select a lamp system filter defined in IEC 61000-4-15. This setting is available only when “Pst, Plt” is selected for Flicker.
- Page 64 4.3 Making System Settings EN50160 settings MEASURE EN50160 Select from pull- Perform evaluations conforming to the EN50160. down menu Do not perform evaluations conforming to the EN50160. The EN50160 (Voltage characteristics of electricity supplied by public distribution systems) is a voltage-quality evaluation Confirm method used in Europe.
-
Page 65: Recording Settings
4.3 Making System Settings 4.3.2 Recording Settings MAIN RECORDING Types of settings to record data 1 (page 82) Types of settings to record data 2 (page 83) Settings when the memory is full (page 83) Setting intervals (page 84) Setting Auto-save (page 85) Setting real-time control (page 85) Setting measurement start/stop time (page 86) Setting the repeated recording (page 87) - Page 66 4.3 Making System Settings Version information HARDWARE Version Indicates the version of this device. Display language settings HARDWARE Language English, Japanese, Deutsch, Francais, Italiano, Espanol, Select from pull- Chinese (Simplified) down menu Confirm Cancel BEEP settings HARDWARE Beep Select from pull- OFF, ON down menu Confirm...
- Page 67 4.3 Making System Settings Screen color settings HARDWARE Color (Screen color) Select from pull- COLOR 1 Default down menu COLOR 2 Dark blue (characters are white) COLOR 3 Monochrome COLOR 4 Light blue Confirm (characters are black) MONO Monochrome Cancel LCD backlight auto-OFF settings HARDWARE LCD Off...
- Page 68 4.3 Making System Settings Clock settings HARDWARE Clock Numeric value Changes columns in the following order: year (Y), settings month (M), day (D), hour (h), and minutes(m). Confirm Cancel Make sure that you enter “00” in the seconds column. Press the instant the seconds are 00.
-
Page 69: Event Settings Screen
4.4 Event Settings Screen 4.4 Event Settings Screen 4.4.1 Measurement Settings EVENT VOLTAGE Automatic setting of event thresholds (page 123) Turning off all event thresholds (page 123) Setting the event recording sequence (page 124) Event ON/OFF settings (page 124) Setting of event thresholds (page 125) POWER Setting of event thresholds (voltage waveform comparison) (page 125) -
Page 70: Load/Save Screen
4.5 Load/Save Screen 4.5 Load/Save Screen LOAD/SAVE MEMORY 9.1 "Using the Internal Memory" (page 142) PC-CARD 9.2 "Using a PC Card" (page 143) For details, see Chapter 9 "Loading and Saving Settings and Mea- sured Data" (page 141). -
Page 71: Using Waveforms, Vectors, Dmms, And Bar Graphs (View Screen)
5.1 Using the VIEW Screen Using Waveforms, Vectors, DMMs, and Bar Graphs Chapter 5 (VIEW Screen) Check measurement data on the waveform dis- play. Waveform Display (page 67) Check measurement data on the vector display. Vector Display (page 70) Check measurement data on the DMM display. DMM Display (page 73) Check measurement data with harmonics. - Page 72 5.1 Using the VIEW Screen Screen operations depending on the internal operation status The screens that can be displayed differ depending on the internal operation status. Internal opera- Display Display tion status update [SETTING] Contents of the display update during set- Approxi- ting.
-
Page 73: Waveform Display
5.2 Waveform Display 5.2 Waveform Display Example: 4-channel waveform with a 3P4W (three-phase four-wire) config- uration Superimposes and WAVE displays 4 channels of the voltage wave- form. VOLT/CURR Currsor value (time) Superimposes and displays 4 channels of the current wave- form. - Page 74 5.2 Waveform Display Enlarging waveforms Changing the Y-axis scale of waveforms SELECT Select from pull- x1/3, x1/2, x1, x2, x5, x10 down menu When you want to reduce the waveform, make the scale smaller. Confirm When you want to enlarge the waveform, make the scale larger.
- Page 75 5.2 Waveform Display Reading the cursor value (cursor measurement) [ VOLTAGE CURRENT ], [ CURSOR Cursor value (Waveform instantaneous Move the vertical cursor values) left and right to read the display value. Vertical cursor Cursor position Scroll bar The cursor on the scroll bar indicates where the cursor is positioned on the You can read waveform instantaneous values with the saved waveform.
-
Page 76: Vector Display
5.3 Vector Display 5.3 Vector Display Example: 3P4W (three-phase four-wire) VECTOR Changing the axis display (page 70) Changing the RMS value/phase angle display (page 71) Changing the phase angle display method (page 71) Changing the phase angle reference source (page 71) Changing harmonic number of orders (page 72) Changing the axis display SELECT... - Page 77 5.3 Vector Display Changing the RMS value/phase angle display SELECT VALUE (Example) Select from pull- down menu VALUE (RMS value) PHASE (phase angle) Confirm You can select what value to display (RMS value display or phase angle display). Cancel When PHASE is selected, see "Changing the phase angle display method"...
- Page 78 5.3 Vector Display Changing harmonic number of orders ORDER Change the num- ber of orders You can select what value to display. When you change the number of orders, the values change along with the vector. In this case, the voltage and current unbalance factors remain the same as the values calculated using the fundamental wave (1st order).
-
Page 79: Dmm Display
5.4 DMM Display 5.4 DMM Display Example: 3P4W (three-phase four-wire) 4-channel DMM display Voltage, current POWER Active power, appar- ent power Reactive power, power factor (dis- placement power factor) VOLTAGE Voltage, total voltage distortion Voltage waveform peak monitor value (+, -) Voltage average val- ue, Voltage unbalance factor... -
Page 80: Harmonics Display
5.5 Harmonics Display 5.5 Harmonics Display 5.5.1 Harmonics Bar Graph Example: 3P4W (three-phase four-wire) For the selected channel: HARMONICS Harmonic voltage GRAPH Harmonic current Harmonic power Changing the display channel (page 74) Changing the axis display (page 75) Changing the RMS value/phase angle display (page 75) Displaying inter-harmonics (page 75) Changing the order number displayed (page 76) Changing the display channel... - Page 81 5.5 Harmonics Display Changing the axis display SELECT (Example) Select from pull- LINEAR (linear display) down menu (logarithmic display) When you select the logarithmic display, the vector is easy to Confirm see even at low levels. Cancel Changing the RMS value/phase angle display SELECT VALUE (Example)
-
Page 82: Harmonics List Screen
5.5 Harmonics Display Changing the order number displayed ORDER Change the order number The selected order number becomes green on the bar graph. If you change the order number, the values change along with the bar graph. 5.5.2 Harmonics List Screen Example: 3P4W (three-phase four-wire) HARMONICS LIST... - Page 83 5.5 Harmonics Display Changing the display channel (Example) Select from pull- down menu CH1, CH2, CH3, CH4 Confirm Cancel Changing the display item (Example) Select from pull- down menu U, I, P Confirm Cancel Changing the RMS value/phase angle display VALUE (Example) Select from pull-...
- Page 84 5.5 Harmonics Display Displaying inter-harmonics iHarmOFF (Example) Select from pull- down menu iHarmOFF, iHarmON When active power (P) is selected as the display item, inter- Confirm harmonics are not displayed. Cancel If you display inter-harmonics (iHarmON), the screen changes as follows. The left side of the example shows harmonics and the right inter-harmonics.
-
Page 85: Using The Time Series Graph (Time Plot Screen)
6.1 Using the TIME PLOT Screen Using the Time Series Graph Chapter 6 (TIME PLOT Screen) Make time series settings Time Plot Settings (page 81) Perform measurements Press to record data. Analyze time series data Changes in RMS Value (page 89) Changes in Voltage (page 93) Changes in Harmonics (page 100) Flicker (page 104) - Page 86 6.1 Using the TIME PLOT Screen Screen operations depending on the internal operation status When measurement starts, the time series graph is displayed on the TIME PLOT screen. The Y-axis and X-axis are automatically scaled so that all the time series graphs are displayed on the screen.
-
Page 87: Time Plot Settings
6.2 Time Plot Settings 6.2 Time Plot Settings To display the time series graph, make the following settings in the SYSTEM screen. MAIN RECORDING Types of settings to record data 1 (page 82) Types of settings to record data 2 (page 83) Settings when the memory is full (page 83) Setting intervals (page 84) Setting Auto-save (page 85) - Page 88 6.2 Time Plot Settings Types of settings to record data 1 RECORDING Rec. Data ALL DATA Records all the calculation values. P&Harm Records all calculation values except inter-har- Select from pull- monics. down menu Power Records all calculation values except harmonics and inter-harmonics.
- Page 89 6.2 Time Plot Settings Types of settings to record data 2 RECORDING MAX/MIN/AVE (Example) Records the average value only. Select from pull- MAX/MIN/AVE Records the maximum, minimum, and average val- down menu ues. You can display the values (MAX, MIN, and AVE values) selected in the Change in RMS value or Change in harmonics time series Confirm graphs.
- Page 90 6.2 Time Plot Settings Setting intervals RECORDING Available internal memory (only) recording time Interval 1, 3, 15, or 30 sec, 1, 5, 10, 15, or 30 min, 1/2 hour Depending on the data recorded and interval settings, the Select from pull- time series graph's possible recording time changes.
- Page 91 6.2 Time Plot Settings Setting Auto-save RECORDING Auto Save OFF, BINARY, TEXT Select from pull- You can set the 3196 to save data automatically to the PC down menu card. File Types (page 145) Saving and Loading Files (page 147) Confirm...
- Page 92 6.2 Time Plot Settings Setting measurement start/stop time RECORDING Start Time Stop Time When Manual setting: Set the values Numeric value When Automatic settings: settings Start time Set to the current time. Change Stop time Set to 1 hour after the start time. columns Set to 1 day...
- Page 93 6.2 Time Plot Settings Setting the repeated recording Repeated recording operations can be conducted up to 99 days at one-day measuring intervals, and up to 99 weeks at one-week measuring intervals. The measured data file of repeated recording is saved as a separate binary file for each one-day or one-week period on the PC card.
- Page 94 6.2 Time Plot Settings Setting the number of repeated recording RECORDING RepeatSave (example) Indicates required PC card 1 to 99 file capacity. Select from pull- down menu Increases the value Lowers the value Confirm Cancel When the repeated recording function is set, the number of repeated recording operations currently set will be indicated.
-
Page 95: Changes In Rms Value
6.3 Changes in RMS Value 6.3 Changes in RMS Value Display items calculated by the 3196 at 200 ms intervals can be dis- played in a time series for each interval. Example: 3P4W (three-phase four-wire) You can select a sin-... - Page 96 6.3 Changes in RMS Value Changing the display item SELECT Freq (Example) Select from pull- Reactive power Freq Frequency down menu Power factor Voltage K factor Upeak+ Voltage waveform peak (+) Uunb Voltage unbalance factor Upeak- Voltage waveform peak (-) Confirm Iunb Current unbalance factor...
- Page 97 6.3 Changes in RMS Value Changing the Y-axis scale SELECT Ydiv Select from pull- AUTO, x1, x2, x5, x10, x25, x50 down menu When you want to reduce the graph, make the scale smaller. When you want to enlarge the graph, make the scale larger. Confirm When recording, use AUTO.
- Page 98 6.3 Changes in RMS Value Scrolling through waveforms SCROLL Scroll through the graph Waveform display range Scroll bar Graph display All recorded data The waveform display range (white belt) on the scroll bar indicates what interval of recorded data is displayed on the screen.
-
Page 99: Changes In Voltage
6.4 Changes in Voltage 6.4 Changes in Voltage 6.4.1 Graphing Voltage Fluctuations for Each Interval You can display interval-by-interval time series graphs of voltages Δ U,S(t) as well as Urms) internally calculated from single half cycle- shifted waveforms VOLTAGE Example: 3P4W (three-phase four-wire) Displays a time series graph for U1, U2, and... - Page 100 6.4 Changes in Voltage Changing the Y-axis scale SELECT Ydiv Select from pull- AUTO, x1, x2, x5, x10, x25, x50 down menu When you want to reduce the graph, make the scale smaller. When you want to enlarge the graph, make the scale larger. Confirm AUTO scaling is used during recording.
- Page 101 6.4 Changes in Voltage Scrolling through waveforms SCROLL Scroll through the graph Waveform display range Scroll bar Cursor position Graph display range The cursor on the scroll bar in- All recorded data dicates where the cursor is po- The graph display range (white belt) on the scroll bar indi- sitioned on the all recorded cates what interval of recorded data is displayed on the data.
-
Page 102: Graphing Voltage Fluctuations For Events
6.4 Changes in Voltage 6.4.2 Graphing Voltage Fluctuations for Events When an event occurs, the voltage calculated by the 3196 for a single waveform shifted half a wave can be displayed in a time series graph spanning 10 seconds. VOLTAGE... - Page 103 6.4 Changes in Voltage Changing the Y-axis scale SELECT Ydiv Select from pull- AUTO, x1, x2, x5, x10, x25, x50 down menu When you want to reduce the graph, make the scale smaller. When you want to enlarge the graph, make the scale larger. Confirm AUTO scaling is used during recording.
- Page 104 6.4 Changes in Voltage Scrolling through waveforms SCROLL Scroll through the graph Waveform display range Cursor position Scroll bar Graph display range The cursor on the scroll bar indicates where the cursor is positioned on the all recorded All recorded data data.
- Page 105 6.4 Changes in Voltage Automatically recording multiple voltage fluctuation event graphs on a PC card Only one voltage fluctuation event graph is recorded in internal memory. By using a PC card, your can record multiple voltage fluctuation event graphs. When BINARY (binary format) or TEXT (text format) is selected as the auto save option, measurement files are automatically recorded on the PC card.
-
Page 106: Changes In Harmonics
6.5 Changes in Harmonics 6.5 Changes in Harmonics You can select six orders and display them in a harmonics time series graph. Example: 3P4W (three-phase four-wire) HARMONICS HARM Changing the display item (page 101) Changing the X-axis scale (page 101) Changing the order number displayed (page 102) Cursor measurements (page 102) - Page 107 6.5 Changes in Harmonics Changing the display item SELECT Select from pull- down menu U1, U2, U3, U4 Voltage (CH1/2/3/4) I1/I2/I3/I4 Current (CH1/2/3/4) P1/P2/P3 Active power (CH1/2/3/) Confirm Psum Total active power Cancel θ1/θ2/θ3 Phase difference (CH1/2/3) θsum Total phase difference The display items that can be selected differ depending on the connection method.
- Page 108 6.5 Changes in Harmonics Changing the order number displayed SELECT (Example) Select from pull- OFF, 1 to 50 HARM (When harmonics DF3[ ] is selected) down menu OFF, 0.5 to 49.5 INTERHARM (When Inter-harmonics DF3[ ] is selected) Confirm You can select up to six orders and display them simulta- neously.
- Page 109 6.5 Changes in Harmonics Scrolling through waveforms SCROLL Scroll bar Scroll through the graph Cursor position Scroll bar Graph display range The cursor on the scroll bar indicates where the cursor is positioned on the all recorded All recorded data data.
-
Page 110: Flicker
6.6 Flicker 6.6 Flicker Flicker analysis is not available when measuring 400 Hz. 6.6.1 IEC Flicker Meter and ΔV10 Flicker Meter A flicker meter is a device for measuring perceived instability in light resulting from variations in lighting brightness and wavelength. There are two types of flicker meters: the IEC flicker meter (UIE flicker Δ... - Page 111 6.6 Flicker Weighting Filter Processing uses one of three selectable weighting filters, a filter of 230 V lamp, 50 Hz systems, a filter for 120 V lamp, 60 Hz systems, and a filter for 100 V lamp, 50 Hz or 60 Hz systems. ω...
- Page 112 6.6 Flicker ΔV10 Flicker Meter ΔV10 Flicker The ΔV10 flicker function is calculated using the “perceived flicker curve” calculation method, which is based on digital Fourier transfor- mation. Calculation: ∞ Δ ∑ Δ ⋅ ΔVn: RMS value [V] for voltage fluctuations in frequency fn. Luminosity coefficient for fn where 10 Hz is 1.0.
-
Page 113: Iec Flicker Graph
6.6 Flicker 6.6.2 IEC Flicker Graph Displays the IEC flicker graph. FLICKER GRAPH Changing the Y-axis scale (page 107) Changing the X-axis scale (page 108) Cursor measurements (page 108) Scrolling through waveforms (page 109) • The graph is updated every 10-minute, regardless of the interval that is [SYSTEM]-DF2[MAIN]-[RECORDING] set for •... - Page 114 6.6 Flicker Changing the X-axis scale SELECT Tdiv Select from pull- AUTO, x1, x1/2, x1/4, x1/8, x1/16, x1/32, x1/64 down menu When you want to reduce the graph, make the scale smaller. When you want to enlarge the graph, make the scale larger. Confirm AUTO scaling is used during recording.
- Page 115 6.6 Flicker Scrolling through waveforms SCROLL Scroll bar Scroll through the graph Waveform display range Scroll bar Graph display range All recorded data The waveform display range (white belt) on the scroll bar indicates what interval of recorded data is displayed on the screen.
-
Page 116: Iec Flicker List
6.6 Flicker 6.6.3 IEC Flicker List Statistics on Pst and Plt are displayed every 10 minutes, along with the date and time. • Pst: short interval flicker value • Plt: long interval flicker value FLICKER LIST • The displayed statistics are for IEC flicker (Pst and Plt), and are displayed in the list every 10 minutes together with the date and time. -
Page 117: Δv10 Flicker Graph
6.6 Flicker 6.6.4 ΔV10 Flicker Graph FLICKER GRAPH Changing the Y-axis scale (page 112) Changing the X-axis scale (page 112) Cursor measurements (page 112) Scrolling through waveforms (page 113) • The graph is updated once a minute, regardless of the interval that is set MAIN RECORDING for [SYSTEM]-DF2[... - Page 118 6.6 Flicker Changing the Y-axis scale SELECT Ydiv Select from pull- AUTO, x1, x2, x5, x10, x25, x50 down menu When you want to reduce the graph, make the scale smaller. When you want to enlarge the graph, make the scale larger. Confirm AUTO scaling is used during recording.
- Page 119 6.6 Flicker Scrolling through waveforms SCROLL Scroll bar Scroll through the graph Waveform display range Scroll bar Graph display range All recorded data The waveform display range (white belt) on the scroll bar indicates what interval of recorded data is displayed on the screen.
-
Page 120: Δv10 Flicker List
6.6 Flicker 6.6.5 ΔV10 Flicker List The following ΔV10 flicker statistics are updated every hour and dis- played in the list together with the date and time. Δ • The maximum value over one hour for V10 Flicker Δ • The fourth maximum value over one hour for V10 Flicker Δ... -
Page 121: Using Events (Event Screen)
Event List Display (page 127) Analyzing Event Occurrences (page 130) Analyzing Transient Waveforms (page 131) Event Monitor Display (page 134) Events displayed by the 3196 • Measurement start events • Measurement stop events • Calculation events (events for which thresholds can be speci-... -
Page 122: Using The Event Screen
7.1 Using the EVENT Screen 7.1 Using the EVENT Screen Switching screen display Selecting the EVENT Screen EVENT Display screen selection LIST 7.4 "Event List Display" (page 127) MONITOR 7.7 "Event Monitor Display" (page 134) EN50160 (For details, see the instruction Manual for EN50160 (CD-R).) •... - Page 123 7.1 Using the EVENT Screen Screen operations depending on the internal operation status Screen operations are limited according to the internal operation sta- tus. Status Display update [SETTING] None [RECORDING] Each time an event occurs [ANALYZING] Stop Can be used in the SETTING status only with the event monitor. [RECORDING] [SETTING] [ANALYZING]...
-
Page 124: Event Detection Method
7.2 Event Detection Method 7.2 Event Detection Method Transient overvoltage Detection method: The voltage channels (U1 to U4) are sampled at 2 MHz and transients exceeding the absolute value of Threshold the threshold are detected. determines the variance from the voltage Threshold waveform. - Page 125 7.2 Event Detection Method Frequency Detection method: Reciprocal detection (sampling at 2 MHz) with measurement and detection approximately every 200 ms (about once every 10 cycles at 50 Hz, every 12 cycles at 60 Hz, or every 80 cycls at 400 Hz) The measurement source is U1, U2, or U3 (same as the PLL synchronization source) Voltage waveform peaks, current waveform peaks, RMS voltage (upper limit, lower limit, SENSE), RMS current, active power, reactive power, apparent power, power...
- Page 126 7.2 Event Detection Method Harmonic voltage distortion Reference waveforms are formed above and below the voltage waveform with an interval of 200 ms and with an offset equivalent to the threshold value, then detection is performed by comparing the measured waveform with these reference values.
-
Page 127: Event Settings
7.3 Event Settings 7.3 Event Settings Events and thresholds are set in the SYSTEM screen. Voltage/Power Event Settings (page 122) Harmonics Event Setting (page 126) Measure- Order Positive and Item ment Channel selection*5 Threshold*1 selection*2 negative*4 selection*3 Voltage frequency Approxi- 0 to 30 Hz mately source... -
Page 128: Voltage/Power Event Settings
7.3 Event Settings 7.3.1 Voltage/Power Event Settings Make the following settings in the SYSTEM screen. EVENT VOLTAGE POWER Automatic setting of event thresholds (page 123) Turning off all event thresholds (page 123) Setting the event recording sequence (page 124) Event ON/OFF settings (page 124) Setting of event thresholds (page 125) Setting of event thresholds (voltage waveform comparison) (page 125) - Page 129 7.3 Event Settings Automatic setting of event thresholds VOLTAGE Auto Setup Event thresholds (voltage, power, and harmonic) are set For device automatically, taking the current measurement as the normal anomalies value. It is recommended that thresholds be individually adjusted, For system using the thresholds set automatically for reference.
- Page 130 7.3 Event Settings Setting the event recording sequence VOLTAGE Event Record Set the order in which events (voltage, power, and harmonic) are displayed in the event list screen. FIFO FIFO Events are listed in the order in which they oc- curred.
- Page 131 7.3 Event Settings Setting of event thresholds Upper settable threshold limit VOLTAGE Frequency Currently set threshold (Example) Current measurement value Make threshold settings Lower settable threshold limit Thresholds can be set while viewing the current measure- Confirm ment values. Cancel Events set are stored internally regardless of the event ON/ OFF setting.
-
Page 132: Harmonics Event Setting
7.3 Event Settings 7.3.2 Harmonics Event Setting Make the following settings in the SYSTEM screen. EVENT HARMONICS Event ON/OFF settings and threshold settings (page 126) Event ON/OFF settings and threshold settings Set ON or OFF for each har- monic order. HARMONICS (ON: numeric value) The numeric value indicates the... -
Page 133: Event List Display
128) Scrolls the event details list. (page 128) Information that is recorded as the event includes the start time, stop time, the 3196 message, and event parameters set in the SYSTEM screen. A total of 100 events can be recorded. -
Page 134: Tran
7.4 Event List Display Scrolling through the event list Scrolls the event list up or down. Scrolls the event details list. Scroll the event details list up or down. See the specifications for details. Measurements (page 183) Correspondence between event settings and event category display Event setting Event category Start... - Page 135 7.4 Event List Display About the event list sequence Time order Example: When 35 events have occurred No.1 Dip CH1 OUT .... Indicates the event that occurred last. (Events ended with occurrence of a voltage dip. No.35 Start ......Indicates the event that occurred first. (Start event occurred.
-
Page 136: Analyzing Event Occurrences
7.5 Analyzing Event Occurrences 7.5 Analyzing Event Occurrences Analyzing event occurrences LIST Select an event Select an event to display a corre- Event details sponding waveform analysis. Confirm Return to event list From the event details screen (the event waveform screen), you can switch to the other screens related to event occur- rence (DF1[WAVE],... -
Page 137: Analyzing Transient Waveforms
7.6 Analyzing Transient Waveforms 7.6 Analyzing Transient Waveforms Displaying transients LIST Select an event category from the event list or an event indicated with “Tran” in the detailed event list. Confirm (Display changes to the VIEW screen waveform display.) TRANSIENT Voltage waveform Transient data year/month/... - Page 138 7.6 Analyzing Transient Waveforms Enlarging transient waveforms Changing the Y-axis range of waveforms SELECT Select from pull- down menu 1kV/div, 600V/div, 300V/div, 150V/div, 60V/div, 30V/div To reduce the waveform, make the voltage value larger. Confirm To enlarge the waveform, make the voltage value smaller. Cancel Changing the X-axis range of waveforms SELECT...
- Page 139 7.6 Analyzing Transient Waveforms Scrolling through transient waveforms SCROLL Scroll through the Scroll bar waveform Waveform display range Return to event list All recorded data (4 ms) The waveform display range (white belt) on the scroll bar indicates what interval of recorded data is displayed on the screen.
-
Page 140: Event Monitor Display
7.7 Event Monitor Display 7.7 Event Monitor Display MONITOR You can monitor all events to determine whether and how many occurred. If there are no events, 0 is displayed If there are events, they are indicated in when and a count shows the number of occurrences. -
Page 141: Using The External Control Terminals
Synchronized with an external device, This informs an external device when analyzes anomalies. anomalies occur within the 3196. When you connect the search signal of When you connect the event output ter- minal to a trigger input terminal on a... -
Page 142: Connecting To The External Control Terminal
8.1 Connecting to the External Control Terminal 8.1 Connecting to the External Control Ter- minal To avoid electric shocks, use the specified material only. Connecting to the external control terminals Electric wires that conform with: single line φ1.0 mm (AWG 18) or twisted line 0.75 mm Supported electric wires: single wire φ0.4 to 1.0 mm (AWG 26 to 18) twisted wire 0.3 to 0.75 mm... -
Page 143: Event Input Terminal (Event In)
(EVENT IN) By inputting a signal to the event input terminal externally, you can make the 3196 determine that an external event has occurred when that event was input. Similar to other events, you can record the volt- age and current waveforms, and the measurement values of external events. -
Page 144: Event Output Terminal (Event Out)
This allows you to record waveforms on the MEMORY HiCORDER when events occur on the 3196. You can record between 14 and 16 waveforms on the 3196 when events occur. When you want to record waveforms for a longer period of time, use the 3196 in parallel with a MEMORY HiCORDER. - Page 145 8.3 Event Output Terminal (EVENT OUT) Event output can be set for Smart Site. HARDWARE Smart Site Select from pull- down menu Decided Set the event output for Smart Site Set Smart Site to ON. • When the START event occurs, no pulse signal (Low pulse) is output from the event output terminal.
- Page 146 8.3 Event Output Terminal (EVENT OUT)
-
Page 147: Loading And Saving Settings And Measured Data141
Loading and Saving Settings and Measured Data Chapter 9 Card type: Flash ATA types I and II 3196 Slot: TYPE II x 1 Format: MS-DOS format Internal Memory: must support up to 528 MB memory PC card × : Possible/... -
Page 148: Using The Internal Memory
You can only save or load setting conditions in the internal memory. Save setting conditions MEMORY Select which number (No.) to save SAVE The setting conditions currently set on the 3196 are saved. Inputs the file Settings file names: up to 8 alphanumerical charac- name ters... -
Page 149: Using A Pc Card
• 9729 PC Card 1G is not compatible with this instrument. PC card capacity The 3196 has an internal memory of 13 MB. Therefore, to transfer all the data recorded in the internal memory to a PC card, you need a PC card with a capacity of 13 MB. -
Page 150: Inserting And Removing The Pc Card
9.2 Using a PC Card 9.2.2 Inserting and Removing the PC Card • Trying to force the PC card upside down or to insert the wrong end into the PC card slot, you can damage the PC card and/or this device. -
Page 151: File Types
9.2 Using a PC Card 9.2.3 File Types Three types of data can be saved to PC cards, including settings, measured data (binary and text format), and screen copy files. When using Model PQA HiVIEW series software, save in binary for- mat. - Page 152 9.2 Using a PC Card Binary format file capacity Time-series data Indicates the capacity of a time-series data file (.ITV) that can be saved at one interval. Power P&Harm ALL DATA MAX/MIN/AVE 720 bytes 10320 bytes 15216 bytes 264 bytes 3464 bytes 5096 bytes The capacity of data attached to one file is 128 bytes.
-
Page 153: Saving And Loading Files
• When loading binary files, the maximum time it takes to load a file is approximately 5 min. • The 3196 cannot read binary format files that exceed 13MB in size. • We recommend the use of the PQA HiVIEW series to analyze binary format files. - Page 154 9.2 Using a PC Card About file types and saving Settings file Manual save Auto-save _______ When the operation status is [SETTING]: PC-CARD SAVE When the operation status is [ANALYZING]: SAVE PC-CARD SETUP FILE Manual saving of the settings files (page 149) Measured data file Manual save Auto-save...
- Page 155 [SETTING] or [ANALYZING]. PC-CARD SAVE SETUP FILE [ANALYZING] only The setting conditions currently set on the 3196 are (Does not need to be se- saved. [SETTING] lected for Settings file names: up to 8 alphanumerical charac- ters :Selects characters...
- Page 156 9.2 Using a PC Card Manual saving of the measured data files 2 (Text format: time-series/ event list/ flicker data) You can save files when the operation status is [ANALYZING]. If you want to change or confirm the files that have PC-CARD been saved, make settings in the text item selection screen.
- Page 157 9.2 Using a PC Card The following table lists the items saved by settings (ON) made on the [Text Select] screen. Item RMS fluctuation graph Voltage fluctuation graph − Normal Item Freq Frequency Urms RMS voltage value RMS voltage value (Voltage fluctuation) −...
- Page 158 • Measured data files are saved automatically during recording. While auto-save is in progress, do not remove the PC card from the 3196. • In binary format, all measurement data of the 3196 can be saved to a PC card.
- Page 159 9.2 Using a PC Card When the memory is full When the memory is full: STOP Measurement Measurement forcibly ends starts Internal memory capacity Recorded data Internal memory Recorded data PC card PC card capacity When the memory is full: LOOP Current time Measurement...
- Page 160 Measured data files are saved automatically during recording. • While auto-save is in progress, do not remove the PC card from the 3196. • In this case, the only measurement data that can be saved to PC card in text format is time series data, event list data, flicker data, and volt- age fluctuation event data.
- Page 161 9.2 Using a PC Card Screen hard copies (auto-copy) Measured data files are saved to the PC card with the internal mem- ory automatically. HARDWARE 1. Set the RS connection point. RS-232C MODEM 2. Set to Timer. Timer COPY 3. Set the interval. Select from pull- 1 min, 5 min, 10 min, 30 min, 1 hour, 2 hour down menu...
- Page 162 9.2 Using a PC Card...
-
Page 163: Chapter 10 Using A Printer
10.1 Setting the Printer Using a Chapter 10 Printer Using the device’s RS-232C interface, you can create hard copies of the 3196 screen with the 9670 PRINTER. For details about the printer and printer connection methods, Refer to the Quick Start Guide. -
Page 164: Printing Hard Copies
10.2 Printing Hard Copies 10.2 Printing Hard Copies The two methods to create screen hard copies with the printer are to output them automatically at each set interval or to output them manu- ally by pressing the HARD COPY key. Printing screen images automatically HARDWARE Timer... -
Page 165: Chapter 11 Using The Pc
11.2 "Control and Monitoring Using a LAN Interface" (page 167) *1:The HTTP server function allows you to use any Internet browser, such as Internet Explorer, without having to install dedicated software on the PC to make settings for the 3196, acquire data, or observe screens. -
Page 166: Remote Control And Monitoring Using An Rs-232C Interface
11.1.3 "Setting the PC" (page 163) • The settings of the modem connected to this device are made automati- cally by the 3196. After reading the user's guide of the PC and modem, set the modem connected to the PC. -
Page 167: Connecting A Modem
If your PC does not support USB connection: RS-232C connection-type modem Notebook computer: PC card-type modem Make sure that a phone line is available both at the place where you set up the 3196 and near your PC. When the modem is connected to a cellular phone:... -
Page 168: Setting The 3196
11.1 Remote Control and Monitoring Using an RS-232C Interface 11.1.2 Setting the 3196 Configuring connection on the instrument time Connection point Baud rate Communication monitoring HARDWARE RS-232C 1. Set the connection point. MODEM Select from pull- down menu When the connection point is set to MODEM, lights on the upper left of the screen. -
Page 169: Setting The Pc
My Computer Make New Connection Set the dial-up connection point. Type a name (example: [3196]) in the connection name entry box. For the modem setting, select the modem that is to be used. * If you cannot select the modem here, install the modem beforehand. - Page 170 Dial-Up Networking settings, press the [ ] button on the final confir- Finish mation screen. Set the connection properties. A "3196" connection icon is created. Right-click the [ ] icon, or select 3196 ] from the [ ] menu. Properties...
- Page 171 * In address], be careful not to set the same IP address as that set for the 3196. For example, if you find that the setting on the computer is 192.168.0.2, then you could set the address on the instrument to something like 192.168.0.1.
- Page 172 [ ] button. Connect [Connecting to 3196] dialog box opens. Start up Internet Explorer, and enter the IP address that you set for the instrument (such as http://192.168.0.1/) in the address column, then press the Enter key.
-
Page 173: Control And Monitoring Using A Lan Interface
11.2 Control and Monitoring Using a LAN Interface 11.2 Control and Monitoring Using a LAN Interface Connecting the 3196 to a hub using a LAN cable and controlling/ observing the 3196 from a PC 10Base-T 10Base-T 3196 Straight Straight cable... -
Page 174: Connecting The 3196
When the computer’s IP address and subnet mask are as follows: IP address: 192.168.0.2 Subnet mask: 255.255.255.0 IP address of the 3196: 192.168.0.1 Set the last numerical value only in the computer’s IP address to a different number. Subnet mask of the 3196: 255.255.255.0... - Page 175 11.2 Control and Monitoring Using a LAN Interface • The number displayed to the right of the “Net Mask” is the MAC Address. This is the same as on the MAC Address label on the back panel. • When you set the printer as the RS connection point, you can use the printer and LAN simultaneously.
- Page 176 Unlike IP addresses, a text string host name is assigned and this is used instead of the IP address. The IP address and host name are changed depending on the DNS (Domain Name Server). In the 3196, there is no host name setting.
- Page 177 Example of a network environment structure Example 1: Connecting the 3196 to an existing network When you connect the 3196 to an existing network, the system administrator must make the set- tings beforehand. Make sure that the settings are unique to this device.
-
Page 178: Setting The Pc
11.2 Control and Monitoring Using a LAN Interface 11.2.3 Setting the PC Example Computer OS Windows 98 When connecting the instrument and computer directly: Confirm the properties for Internet protocol (TCP/IP). Move the cursor over [Network Neigh- and right-click the mouse to borhood] open the local area connection prop- erties. - Page 179 Example: IP address: 192.168.0.2 Subnet mask: 255.255.255.0 3196 IP address: 192.168.0.1 Subnet mask: 255.255.255.0 Connection to the instrument Start up Internet Explorer, and enter the IP address that you set for the instrument (such as http://192.168.0.1) in the address column,...
-
Page 180: Http Server Function
The HTTP server function allows you to use any Internet browser, such as Internet Explorer, without having to install dedicated software on the PC to make settings for the 3196, acquire data, or observe screens. You can use the following functions. -
Page 181: Setting The Http Server Function
11.3 HTTP Server Function 11.3.2 Setting the HTTP Server Function Main Page Start up Internet Explorer, and enter the IP address that you set for the instrument (exam- ple: http://192.168.0.1/) in the address column, then press the Enter key. When a normal connection is established, the Main page for the instrument’s HTTP server function opens. - Page 182 11.3 HTTP Server Function Event Detailed Screen Just like the instrument, this screen displays a list of representational event categories and simultaneously occurring events. You can also display waveforms, vectors, and harmonics for event occurrence by selecting a graph. The Internet browser displays the same screen as the instrument’s analysis screen when an event occurrence is moved from the event list screen using the ENTER key.
- Page 183 11.3 HTTP Server Function Event Harmonic Bar Graph Screen You can select the display channel, numeric display, and order number. Creating Reports You can select the display channel, numeric display, and order number. When using Internet Explorer as the Internet browser in the event details screen, you can cre- ate reports using MS-Word.
- Page 184 11.3 HTTP Server Function System Setting Screen Options can be selected in [SYSTEM] – [MAIN]. The event settings can be made. However, interface settings, text save option selections, and event settings cannot be made. Click setting items on the left side of the screen to display them on the right.
-
Page 185: Chapter 12 Specifications
12.1 Product Specifications Chapter 12 Specifications 12.1 Product Specifications The specifications below apply to the 3196 POWER QUALITY ANALYZER. For the product specifications of the EN50160, see the Instruction Manual for EN50160. Environmental and Safety Specifications Operating environment Indoors, altitude up to 2000 m (6562-ft.) Storage temperature and -20°C to 50°C (-4°F to 122°F), 80% RH or less (no condensation) -
Page 186: Basic Specifications
Rated voltage: 100 to 240 VAC (a change in voltage of ±10% taken into con- sideration), 50/60 Hz, maximum rated current: 1.2 A 9459 BATTERY PACK(Sanyo 6HR-AU Ni-MH) for backup during power off Recharge function Using the 9458 AC ADAPTER or 9459 BATTERY PACK to recharge while the 3196 is operating. - Page 187 12.1 Product Specifications Basic Specifications Maximum rated power 40 VA ° Continuous battery opera- Approx. 30 minutes with the 9459 BATTERY PACK (fully charged, 23 ° tion time Dimensions Approx. 298W x 215H x 67D mm (not including protrusions) (11.73"W x 8.46"H x 2.64"D) Mass Approx.
- Page 188 12.1 Product Specifications Accessories and Options Accessories 9438-02 VOLTAGE CORD 1 set: 8 cords (red, yellow, blue, and gray (one each), and 4 black cords) 9458 AC ADAPTER ..1 (The power cord can be selected in country spec- ifications.) 9459 BATTERY PACK (NiMH, 7.2 V/2700 mAh) Strap......1 Quick Start Manual..1 (booklet) Instruction Manual for EN50160..1 (booklet)
-
Page 189: Measurement Specifications
12.2 Measurement Specifications 12.2 Measurement Specifications Measurements Items detected at 2 MHz sampling without a gap 1P3W/ Item Variable 1P2W 3P3W3M 3P4W MAX/MIN/AVE 3P3W2M Transient overvoltage Utran 1, 2, 4 1, 2, 3, 4 1, 2, 3, 4 (impulse) When measuring at 50 Hz or 60 Hz, items measured in half cycles (calculates one wave- form overlapped by half a wave) without gaps When measuring at 400 Hz, items measured in a wave without gaps 1P3W/... - Page 190 12.2 Measurement Specifications Items measured every 200 ms (about once every 10 cycles at 50 Hz, every 12 cycles at 60 Hz, or every 80 cycles at 400 Hz) without a gap 1P3W/ MAX/MIN/ Item Variable 1P2W 3P3W3M 3P4W 3P3W2M Harmonic current phase angle θiharm 1, 2, 4...
- Page 191 12.2 Measurement Specifications Conditions of Guaranteed Accuracy Conditions of Guaranteed After 30 min warm-up, however, when measuring AC voltage; sine-wave in- put, PF=1, synchronized PLL Accuracy Temperature and humidity 23±5°C(73±9°F), 80% RH or less (applies to all specifications unless other- wise noted) for guaranteed accuracy Guaranteed accuracy period...
-
Page 192: Items
12.2 Measurement Specifications RMS Current Measurement method True RMS type Measurement at 256 points per cycle about once every 10 cycles at 50 Hz or every 12 cycles at 60 Hz (approximately every 200 ms). Measurement at 256 points per 8 cycles about once every 80 cycles at 400 Hz (approximately every 200 ms). - Page 193 12.2 Measurement Specifications Voltage Swell Displayed items Swell amplitude and duration Threshold and hysteresis % of basic voltage Voltage swell height swell to (threshold)% When measuring at 50 Hz or 60 Hz, if the RMS voltage (value calculated for one waveform shifted over half a wave) exceeds the threshold in the right direction, the swell is detected and the threshold height displayed.
- Page 194 12.2 Measurement Specifications Frequency Measurement accuracy At 50/60 Hz measurement, Less than ±10 mHz (For a sine wave input with a voltage range of 10% to 110%.) At 400 Hz measurement, Less than ±100 mHz (For a sine wave input with a voltage range of 30% to 110%.) Voltage Waveform Peak Measurement method...
- Page 195 12.2 Measurement Specifications Reactive Power Measurement method Calculated using apparent power S and active power P. Display item Reactive power of each channel and its sum for multiple channels. (For de- tails, see the formula.(page 202)) Measurement range Depends on the voltage x current range combination. (See the power range configuration table (page 193).) Measurement accuracy ±1 dgt.
- Page 196 12.2 Measurement Specifications Δ U Voltage Fluctuation Measurement method Change in RMS voltage (When measuring at 50/60 Hz, each waveform cal- culation value is obtained from a shifted half cycle. When measuring at 400 Hz, each is obtained from one full cycle.) with respect to standard voltage Display range Nominal voltage S(t) Instantaneous Flicker value...
- Page 197 12.2 Measurement Specifications Harmonic Voltage, Current and Power (including fundamental waveform content) Measurement accuracy At 50/60 Hz: Harmonic voltage and harmonic current: 1st to 20th orders: ±0.5% rdg. ±0.2% f.s. 21st to 50th orders: ±1.0% rdg. ±0.3% f.s. Harmonic power: 1st to 20th orders: ±0.5% rdg.
- Page 198 12.2 Measurement Specifications Harmonic Voltage/Current Phase Difference (including fundamental wave components) Measurement method After harmonic analysis, the difference between harmonic voltage and cur- rent phase angles is displayed Display items Harmonic voltage-current phase difference for each channel and sum (total) value for multiple channels (For details, see the formula.(page 209)) Measurement accuracy...
- Page 199 12.2 Measurement Specifications Power Range Configuration Tables When using a 1 mV/A (500A) sensor or When using a 0.1 mV/A (5000A) sensor 9661 sensor Current range Current range 500.00 A 5000.0 A 50.000 A 500.00 A Voltage range Voltage range 150.00 V 75.000 k 750.00 k...
-
Page 200: Setting Functions
12.3 Setting Functions 12.3 Setting Functions System Settings CH1, 2, 3 Measured line 1P2W, 1P3W, 3P3W2M, 3P3W3M, 3P4W AC, DC, and OFF Clamp sensor ratings 0.1 mV/A, 1 mV/A, 10 mV/A, 100 mV/A Same as CH1, CH2, and CH3. Voltage range For AC: 60 V, 150 V, 300 V, 600 V 150 V, 300 V, 600 V For DC: 60 V, 600 V... - Page 201 12.3 Setting Functions Hardware Settings Display language English, German, French, Italian, Spanish, Japanese Beep ON/ OFF Screen colors COLOR 1 to 4, MONO LCD backlight ON/ Auto OFF (I m, 5 m, 10 m, 30 m, 1 h) Real-time settings Year/month/day/hour/minute You can reset the unit to its defaults with the system's reset procedure.
- Page 202 12.3 Setting Functions Data Save Settings (save methods for time series data and event data) Data save area Always saves data in the internal memory (when a PC card is connected, saves data on the PC card as well) Settings when the data save STOP/ LOOP (When “LOOP”...
- Page 203 12.3 Setting Functions Event Settings Posi- Measure- Channel Order tive and Item ment selec- selec- Threshold selection nega- tion tion tive Transient overvoltage ± 1,2,3 0 to 2000 V pk Voltage swell 1,2,3 0 to 200% Voltage dip 1,2,3 0 to 100% Voltage interruption 1,2,3 0 to 100%...
- Page 204 12.3 Setting Functions Other Functions Warning functions Incorrect connection check Connection diagram screen: Check that the connection and clamp sensor are not reversed. Connection check screen: Check the phase order. Out of range When the input exceeds the range by 130%, displays ---.---. Out of crest factor When the input peak value of the waveform is 3 times the voltage range or 4 times the current range, displays Out of crest factor.
-
Page 205: Formulae
12.4 Formulae 12.4 Formulae Voltage dips, voltage swells, and interruptions U (V rms) Single-phase 2-wire Single-phase 3-wire Three-phase 3-wire Three-phase 3-wire Three-phase 4-wire 1P2W 1P3W 3P3W2M 3P3W3M 3P4W Line-to-line voltage Line-to-line voltage Phase-to-neutral voltage M 1 – M 1 – M 1 –... - Page 206 12.4 Formulae RMS voltage U (V rms) Single-phase 2-wire Single-phase 3-wire Three-phase 3-wire Three-phase 3-wire Three-phase 4-wire 1P2W 1P3W 3P3W2M 3P3W3M 3P4W line-to-line voltage Line-to-line voltage Phase-to-neutral voltage M 1 – M 1 – ∑ ∑ ---- - ---- - M 1 –...
- Page 207 12.4 Formulae RMS current I (A rms) Single-phase 2-wire Single-phase 3-wire Three-phase 3-wire Three-phase 3-wire Three-phase 4-wire 1P2W 1P3W 3P3W2M 3P3W3M 3P4W M 1 – ∑ ---- - -- - Iave -- - Iave -- - Iave Iave -- - •...
-
Page 208: Power Factor Pf
12.4 Formulae Reactive power Q (var) Single-phase 2-wire Single-phase 3-wire Three-phase 3-wire Three-phase 3-wire Three-phase 4-wire 1P2W 1P3W 3P3W2M 3P3W3M 3P4W Qc sic Sc – Qsum Q Qsum Q Qsum Q Qsum Q • The polarity symbol sic for reactive power Q indicates a LAG or LEAD in polarity; no symbol indicates a LAG, while the “-”... - Page 209 12.4 Formulae Displacement power factor DPF Single-phase 2-wire Single-phase 3-wire Three-phase 3-wire Three-phase 3-wire Three-phase 4-wire 1P2W 1P3W 3P3W2M 3P3W3M 3P4W θ DPFc sic DPFsum sisum P DPFsum sisum P DPFsum sisum P DPFsum sisum P sum1 sum1 sum1 sum1 ---------- - ---------- - ---------- -...
- Page 210 12.4 Formulae Current unbalance factor Iunb (%) Single-phase 2-wire Single-phase 3-wire Three-phase 3-wire Three-phase 3-wire Three-phase 4-wire 1P2W 1P3W 3P3W2M 3P3W3M 3P4W – 3 6β – – 3 6β – × × Iunb --------------------- - 100 Iunb --------------------- - 100 3 6β...
- Page 211 12.4 Formulae Inter-harmonic voltage Uk (V rms) Single-phase 2-wire Single-phase 3-wire Three-phase 3-wire Three-phase 3-wire Three-phase 4-wire 1P2W 1P3W 3P3W2M 3P3W3M 3P4W U′ck Uckr Ucki ⎧ ⎫ ∑ ⎨ ⎬ U′ ⎛ ⎞ 10k n ⎩ ⎭ -------------- - ⎝ ⎠...
- Page 212 12.4 Formulae Harmonic power Pk (W) Single-phase Three-phase Three-phase Single-phase 2-wire Three-phase 3-wire 3-wire 3-wire 4-wire 1P2W 3P3W3M 1P3W 3P3W2M 3P4W × × -- - U -- - U – – × × Pck U × × -- - U -- - U –...
- Page 213 12.4 Formulae Total harmonic voltage distortion factor THDUF (%) Single-phase 2-wire Single-phase 3-wire Three-phase 3-wire Three-phase 3-wire Three-phase 4-wire 1P2W 1P3W 3P3W2M 3P3W3M 3P4W THDUF1 THDUF1 THDUF12 THDUF12 THDUF1 THDUF4 THDUF2 THDUF32 THDUF23 THDUF2 THDUF31 THDUF3 ∑ THDUF4 THDUF4 THDUF4 THDUF4 ×...
- Page 214 12.4 Formulae Total harmonic current distortion factor THDIR (%) Single-phase 2-wire Single-phase 3-wire Three-phase 3-wire Three-phase 3-wire Three-phase 4-wire 1P2W 1P3W 3P3W2M 3P3W3M 3P4W THDIR1 THDIR1 THDIR1 THDIR1 THDIR1 THDIR4 THDIR2 THDIR2 THDIR2 THDIR2 THDIR3 THDIR3 THDIR4 THDIR4 THDIR4 THDIR4 ∑...
- Page 215 12.4 Formulae Harmonic voltage-current phase difference θk (deg) Single-phase 2-wire Single-phase 3-wire Three-phase 3-wire Three-phase 3-wire Three-phase 4-wire 1P2W 1P3W 3P3W2M 3P3W3M 3P4W θ θ θ θ θ θ θ θ θ θ θ θ θ θ ⎧ ⎫ ⎧ ⎫...
- Page 216 12.4 Formulae Voltage flicker ΔV10 (V) Single-phase 2-wire Single-phase 3-wire Three-phase 3-wire Three-phase 3-wire Three-phase 4-wire 1P2W 1P3W 3P3W2M 3P3W3M 3P4W Δ Δ Δ Δ ΔV 10(1) 10(12) 10(12) 10(1) 10 1 ( ) Δ Δ Δ Δ 10(2) 10(32) 10(23) 10(2) Δ...
- Page 217 12.4 Formulae Short interval voltage flicker Pst Single-phase Three-phase Three-phase Three-phase Single-phase 2-wire 3-wire 3-wire 3-wire 4-wire 1P2W 1P3W 3P3W2M 3P3W3M 3P4W • Indicates the following values: K =0.0314, K =0.0525, K =0.0657, K =0.28, K =0.08. • The cumulative probability function (CPF) is in the 1024 class. •...
- Page 218 12.4 Formulae...
-
Page 219: Appendix
Appendix Appendix Measurement Range and Nominal Voltage The voltage and current ranges of this unit are as follows. This unit is not equipped with an automatic range selection function, therefore you must select the operation ranges. Voltage CH 1 to 3 150 V, 300 V, 600 V range CH 4 (AC) - Page 220 Appendix Current range 5500A 5000 A Effective measurement range 5000Aレンジ 有効測定範囲 7.5A 5000A 6500A 550A 500Aレンジ Effective measurement range 有効測定範囲 500 A 0.75A 500A 650A 1A 100A 1000A 10000A 110A 100Aレンジ Effective measurement range 有効測定範囲 100 A 150mA 100A 130A 50Aレンジ...
-
Page 221: Time Plot Recording Method
Appendix TIME PLOT Recording Method TIME PLOT screen ---- HARMONICS MAIN RECORDING SYSTEM_DF2[ ] Interval setting period 200 ms (50 Hz: 10 waveforms, 60 Hz: 12 waveforms) RMS value 1 RMS value 2 RMS value 3 RMS value N ex. when Interval:1min, N=300 AVE RMS value MIN RMS value... -
Page 222: Event Waveform Recording Method
Appendix Event Waveform Recording Method TIME PLOT screen ---- (Event setting -power and harmonics) HARMONICS MAIN RECORDING SYSTEM_DF2[ ] Interval setting period 200 ms (50 Hz: 10 waveforms, 60 Hz: 12 waveforms) RMS calculation EVENT occur RMS calculation RMS calculation Displayed as event waveforms Event waveform are 200 ms to which are added... -
Page 223: Detecting Anomalies And Phenomena Due To Drops In Power Quality
Appendix Detecting Anomalies and Phenomena Due to Drops in Power Quality Troubles due to drops in power quality: Interruptions in the reception transformer and malfunctions in the terminal control device • Sometimes the device does not work correctly. • The light flickers. •... -
Page 224: Terminology
Appendix Terminology LAN is the abbreviation of Local Area Network. The LAN was devel- oped as a network for transferring data through a PC within a local area, such as an office, factory, or school. This device comes equipped with the LAN adapter Ethernet 10Base-T. 10Base-T is appointed by IEEE802 and has a data transfer speed of 10 Mbps. - Page 225 50 2 16-bit resolution -200 Crest factors of the 3196 (The crest factor of the current input area is 4.) However, when a measurement that exceeds the peak is input, it appears outside the crest factor and you are informed of data that con-...
- Page 226 Appendix Harmonics phase angle and harmonic phase difference The harmonic voltage phase angle and harmonic current phase angle are the standard for the PLL source phase (for input based on PLL when U1, U2, or U3 is selected on this device) fundamental wave component.
-
Page 227: Unbalance(I)
Appendix Unbalance factor If the phases of the three-phase alternating voltage (current) each have the same voltage and deviate from each other by 120 degrees, the voltage (current) is referred to as “balanced (symmetrical) three- phase voltage (current).” If the voltages (currents) of the three phases differ or if the difference between each of the phases is not 120 degrees, the voltage (current) is referred to as “unbalanced (asymmet- rical) three-phase voltage (current).”... - Page 228 3196. If the displacement power factor is low (the current is behind the voltage), add a phase-advancing capacitor to the electric system for correction.
- Page 229 Appendix Text Time-sequence Data-header Composition Remark: Each item is separated by a comma (,). Classifica- Header Explanation tion Date and Date Date 2001/8/20 Time Time Time 8:12:00 Voltage Umax1,..,Umax3 Max. value of voltage fluctuation CH1 - CH3 fluctua- Umin1,..,Umin3 Min. value of voltage fluctuation CH1 - CH3 tion* RMS val-...
- Page 230 Appendix Classifica- Header Explanation tion RMS val- MinFreq Frequency ue fluctua- MinUrms1,...,MinUrms4 RMS voltage value CH1 - CH4 tion MinU+peak1,...,MinU+peak4 Voltage waveform peak CH1 - CH4 Minimum value MinU-peak1,...,MinU-peak4 CH1 - CH4 Voltage waveform peak MinIrms1,...,MinIrms4 RMS current value CH1 - CH4 MinI+peak1,...,MinI+peak4 Current waveform peak CH1 - CH4...
- Page 231 Appendix Classifica- Header Explanation tion RMS val- AveFreq Frequency ue fluctua- AveUrms1,...,AveUrms4 RMS voltage value CH1 - CH4 tion AveU+peak1,...,AveU+peak4 Voltage waveform peak CH1 - CH4 Average value AveU-peak1,...,AveU-peak4 CH1 - CH4 Voltage waveform peak AveIrms1,...,AveIrms4 RMS current value CH1 - CH4 AveI+peak1,...,AveI+peak4 Current waveform peak CH1 - CH4...
-
Page 232: Δv10 Flicker Text Time-Sequence Data-Header Composition226
Appendix ΔV10 Flicker Text Time-sequence Data-header Composition Classification Header Explanation Example Date and Date Date 2001/11/02 Time Time Time 17:19:00 ΔV10 ΔV10 instantaneous value dv10 0.081 ΔV10 total maximum value 0.158 ΔV10 maximum value for one hour 0.000 dv10max ΔV10 fourth largest value for one dv10max4 0.000 hour... -
Page 233: Text Event Data-Format Composition
Appendix Text Event Data-format Composition Example 2001/10/12 13:08:35.354, Dip CH1,OUT,0.24V,0:00:02.342 Items Example Number of characters ():number of characters Date ..... 2000/8/22 ..........10 Time (up to ms) ..13:08:35.354 ..........12 Event category Items ......Number of characters Items......Number of characters Tran, ....Transient ......4 Unbalance(U) .. -
Page 234: Contents Of Automatic Setting Of Events (Thresholds)
Appendix Contents of Automatic Setting of Events (thresholds) Default setting of Setting of levels Items ON/OFF The current measured values shall be used as the Only those lines used in reference values. All hystereses should be 1% of the set wire connection the levels (thresholds). -
Page 235: Wave
Appendix Default setting of Setting of levels Items ON/OFF The current measured values shall be used as the Only those lines used in reference values. All hystereses should be 1% of the set wire connection the levels (thresholds). The levels (thresholds) are ON;... -
Page 236: Event Recording Sequence (Priority Order)
Appendix Event Recording Sequence (Priority Order) In sequence from higher event priority (prioritized in the sequence of items described) Transient overvoltage (peak-wise sequence) Interruption, voltage dip, voltage swell 1. In sequence of OUT - IN 2. If the items are the same, the event that shows a deeper deepest value (maximum value) is given priority. -
Page 237: Block Diagram (Analog)
Appendix Block Diagram (Analog) -
Page 238: Block Diagram (Digital)
Appendix Block Diagram (Digital) - Page 239 • In the interests of product development, the contents of this manual are subject to revision without prior notice. • The content of this manual is protected by copyright. No reproduction, duplication or modification of the content is permitted without the authorization of Hioki E.E. Corporation.
- Page 240 HEAD OFFICE 81 Koizumi, Ueda, Nagano 386-1192, Japan TEL +81-268-28-0562 / FAX +81-268-28-0568 E-mail: os-com@hioki.co.jp / URL http://www.hioki.com/ HIOKI USA CORPORATION 6 Corporate Drive, Cranbury, NJ 08512, USA TEL +1-609-409-9109 / FAX +1-609-409-9108 3196A983-09 07-12H Printed on recycled paper...
Need help?
Do you have a question about the 3196 and is the answer not in the manual?
Questions and answers