Table of Contents
Advertisement
Quick Links
Advertisement
Table of Contents
Troubleshooting

Related Manuals for Snap-On Modis Ultra


Summary of Contents for Snap-On Modis Ultra
- Page 1 User Manual EAZ0079L23C Rev. B 1-H-18 UK...
- Page 2 End User License Agreement. The Snap-on Incorporated Software End User License Agreement may be provided with the diagnostic tool, and is available at: https://eula.snapon.com/diagnostics. Patent Information For a listing of Snap-on products that are protected by patents in the United States and elsewhere, visit: https://patents.snapon.com User Manual Information This manual includes information and images applicable with diagnostic software version 18.4 and later.
- Page 3 “See Quick Tips”. NOTE: Sample titles are listed below. Not all titles may be available for all diagnostic tools, and are subject to change. Snap-on® Training Solutions® - Training Videos (examples) Introduction and Navigation Global OBD-II...
- Page 4 Diagnostic Quick Tips - Video Series Snap-on Diagnostic Quick Tips videos are available at no charge on our website and on our YouTube channel. These videos are developed from real repair case studies to help professional technicians use diagnostic tools to solve specific vehicle problems (e.g.
- Page 5 Diagnostic Quick Tips - Video Series Snap-on® Training Solutions® - Diagnostic Quick Tips Videos (examples) Hyundai Blind Spot Detection System Chrysler HVAC Test Calibration Chrysler VVT System Cleaning Hyundai Occupant Detection System Reset Chrysler Wheel & Tire Calibrations Ignition Coil Current and Voltage Comparison...
-
Page 6: Table Of Contents
Contents Safety Information ........................ 1 Chapter 1: Using This Manual .....................3 Conventions..........................3 Bold Text ..........................3 Symbols ...........................3 Terminology ........................3 Notes and Important Messages ..................4 Hyperlinks ........................4 Procedures........................4 Chapter 2: Introduction......................5 Functional Description ......................5 Technical Specifications ......................7 Control Keys ...........................8 Accept (Y/a) Key ......................8 Directional Keys ....................... - Page 7 Screen Layout ........................ 20 Chapter 5: Scanner......................23 Vehicle Identification......................23 Alternative Vehicle Identification ..................25 Connecting to a Vehicle......................25 Cables ..........................26 No Communication Message ..................26 Operations ..........................27 Codes Menu........................29 Data Display........................35 Functional Tests......................42 Exiting the Scanner ......................44 SureTrack ..........................
- Page 8 Low Amp Current Probe (optional)................. 73 Temperature Probe Adapter (optional) ................74 Pressure Transducers and Adapters (optional) ............. 74 Waveform Demonstration Tools (optional)..............75 General Information......................76 Scope Multimeter Screen Layout and Features............. 76 Measurement Out of Range (Alert) ................78 Operation and Controls ......................79 Test Lead / Probe Connection ..................
- Page 9 Checking if Wi-Fi is Connected ..................138 Wi-Fi Icons (Setup)......................138 Turning Wi-Fi On and Connecting to a Network..............138 Add Network Advanced (Connecting to a hidden network)......................140 Wi-Fi Testing ........................140 Wi-Fi Troubleshooting and Status Messages..............142 Informative Messages ....................144 Chapter 13: ShopStream Connect .................. 145 Using SSC (Connecting to your PC) ..................
-
Page 10: Safety Information
Safety Information For your own safety and the safety of others, and to prevent damage to the equipment and vehicles upon which it is used, it is important that the accompanying Important Safety Instructions be read and understood by all persons operating, or coming into contact with, the equipment. We suggest you store a copy near the unit in sight of the operator. - Page 11 Safety Information Safety Message Conventions Safety Message Conventions Safety messages are provided to help prevent personal injury and equipment damage. All safety messages are introduced by a signal word indicating the hazard level. Indicates an imminently hazardous situation which, if not avoided, will result in death or serious injury to the operator or to bystanders.
-
Page 12: Chapter 1 Using This Manual
Using This Manual Chapter 1 This manual contains tool usage instructions. Some of the illustrations shown in this manual may contain modules and optional equipment that are not included on your system. Contact your sales representative for availability of other modules and optional equipment. 1.1 Conventions The following conventions are used. -
Page 13: Notes And Important Messages
Using This Manual Conventions The above statement abbreviates the following procedure: 1. Navigate to and highlight the Brightness selection. 2. Press the OK, or similar, button. 1.1.4 Notes and Important Messages The following messages are used. Notes A NOTE provides helpful information such as additional explanations, tips, and comments. Example: NOTE: For additional information refer to... -
Page 14: Chapter 2 Introduction
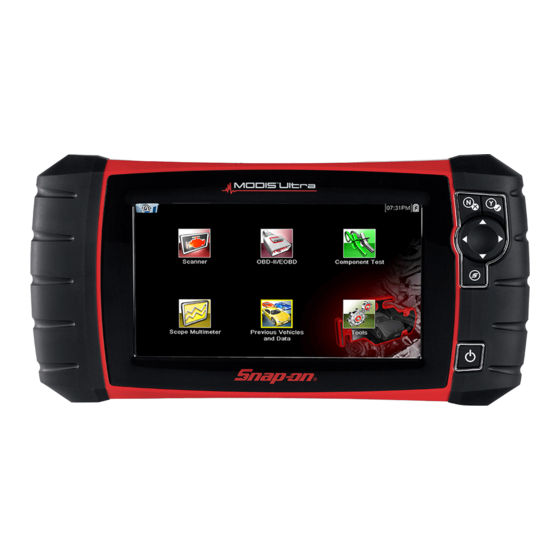
Introduction Chapter 2 The MODIS Ultra is a multi-function tool that combines a scan tool with a two-channel lab scope, graphing multimeter, and the exclusive Snap-on Guided Component Test database into a single hand-held unit. This chapter describes the construction of the diagnostic tool and addresses the use of the basic... - Page 15 Introduction Functional Description 1— Battery Status Indicator LED (light emitting diode) 2— DC Power Supply Input Port 3— Scope/Multimeter Jacks 4— Mini USB Client Port 5— Micro secure digital (microSD) Card Port 6— Data Cable Port Figure 2-2 Top view 1—...
-
Page 16: Technical Specifications
Introduction Technical Specifications 2.2 Technical Specifications Touch Screen Resistive Touch Panel Display: 8.0 inch diagonal, Color LCD 800 x 480 resolution SWVGA Battery: Rechargeable lithium-ion battery pack Approximately 3 hour run time Approximately 5 hour charge time DC Jack Operating Voltage 10V and 30V DC Dimensions: Width:... -
Page 17: Control Keys
Introduction Control Keys 2.3 Control Keys There are five control keys located on the right side of the unit near the handgrip: Icon Description Selects a menu or program, advances to the Accept, Yes next screen, or provides a yes answer to a question on the screen. -
Page 18: S (Shortcut) Key
Introduction Power Sources 2.3.4 S (Shortcut) Key Use the Shortcut key to quickly perform routine tasks, such as capturing an image of the current screen, with a single press. The Shortcut, or S, key can be programmed to perform a number of different functions. -
Page 19: Vehicle Power
Introduction The Stand 2.4.3 Vehicle Power The tool receives power from the test vehicle when it is connected to a powered data link connector (DLC) with the data cable. All OBD-II/EOBD compliant vehicles are required to have battery power available on the DLC. If the diagnostic tool does not power on when connected to an OBD-II/EOBD DLC, there may be a circuit problem on the vehicle. -
Page 20: Chapter 3 Getting Started
Getting Started Chapter 3 Make sure the diagnostic tool has a charged battery pack, is connected to a powered vehicle data link connector (DLC), or is connected to an AC power supply. 3.1 Powering Up The unit should automatically power on and open the Home screen (Figure 3-1) when ever power is supplied through the data cable or by the AC Power Supply. - Page 21 Getting Started Home Screen Elements of the Title bar let you know at a glance: What diagnostic module is currently active. • The source and status of the power being supplied to the tool. • Wi-Fi signal strength • The current time. •...
-
Page 22: Home Screen Buttons
Getting Started Home Screen 3.2.2 Home Screen Buttons The Home screen, which the diagnostic tool automatically opens to whenever power is supplied to the unit, allows you to select which of the primary tool functions, or modules to use. Each available module is represented by a button on the home screen. -
Page 23: Common Toolbar Control Icons
Getting Started Home Screen 3.2.3 Common Toolbar Control Icons Common control icon functions are described in the following table. Specific function control icons are described in their applicable chapters. Displayed control icons vary depending on the active function or test. Select a control icon on a screen to activate a control function. You can also use the control buttons to activate a function, a yellow border around the icon indicates it is highlighted, or in focus. -
Page 24: The Demonstration Program
Getting Started The Demonstration Program 3.3 The Demonstration Program A Scanner demonstration program allows you to become familiar with many of the test capabilities of the Scanner module without actually connecting to a vehicle. To start the demonstration program: 1. From the Home screen, tap the Scanner icon. The manufacturer menu, which lists all of the makes available for testing, displays. -
Page 25: Chapter 4 Navigation
Navigation Chapter 4 This chapter describes the screen layout, how to navigate the interface, and how to make selections using screen menus, buttons, and keys. It also explains the various types of messages that display while using the tool. The chapter is divided into the following sections: Screen Messages •... -
Page 26: Scanner Navigation
Navigation Scanner Navigation 4.2 Scanner Navigation Navigation applies to using both the Scanner and the OBD-II/EOBD modules. 4.2.1 Screen Layout 1— Title bar—shows test and tool status 2— Toolbar—contains test controls 3— Main body—displays menus and test data Figure 4-1 Sample scan tool screen The Title bar appears for all modules and displays information only, there are no selectable items. - Page 27 Navigation Scanner Navigation Table 4-1 Scanner toolbar buttons (part 2 of 2) Button Icon Function Indicates the data being displayed is paused and not Record being updated. Selecting resumes data collection. Erases all the data in the buffer and begins a new Clear recording.
- Page 28 Navigation Scanner Navigation Additional buttons appear on the toolbar when special operations are available. These buttons are explained in the Operations chapters when applicable. When a selectable item on the screen is highlighted, a yellow frame surrounds the item to indicate that it is in focus. Main Body The main body of the screen is the lower portion, which displays either a menu of available tests or data from the vehicle.
-
Page 29: Guided Component Tests And Scope Multimeter Navigation
Navigation Guided Component Tests and Scope Multimeter Navigation 4.3 Guided Component Tests and Scope Multimeter Navigation This section describes general navigation for Guided Component Test and Scope Multimeter screens. Although there are some differences, the interface operates similarly for both modules. 4.3.1 Screen Layout 1—... - Page 30 Navigation Guided Component Tests and Scope Multimeter Navigation A brief description of common toolbar button operations are shown in Table 4-2. Table 4-2 Guided Component Test and Scope Multimeter toolbar buttons Button Icon Function Returns to the previously viewed screen. This button Back is always at the left-hand edge of the toolbar.
- Page 31 Navigation Guided Component Tests and Scope Multimeter Navigation Additional buttons appear on the toolbar when special operations are available. These buttons are explained in the operations chapters where applicable. Main Body The main body of a Guided Component Test screen displays one of three things: A selectable menu •...
-
Page 32: Chapter 5 Scanner
Scanner Chapter 5 The Scanner establishes a data link to the electronic control systems of the vehicle being serviced. This allows you to retrieve diagnostic trouble codes (DTCs), view live data parameters, and perform tests. Scanner testing requires connecting the scan tool to the test vehicle using the data cable and test adapters. - Page 33 Scanner Vehicle Identification A confirmation screen displays once all the required data has been entered (Figure 5-2). Figure 5-2 Sample confirmation dialog box 4. From the Confirm Vehicle screen select: a. OK to continue. b. Cancel to return to the previous screen. When the vehicle identification is confirmed, a list of systems available for testing displays.
-
Page 34: Alternative Vehicle Identification
Scanner Connecting to a Vehicle 5.1.1 Alternative Vehicle Identification Occasionally, you may identify a test vehicle that the Scanner does not recognize, the database does not support, or has some unique characteristics that prevent it from communicating with the Scanner through the normal channels. In these instances, a menu of alternate choices displays. Alternate choices allow you to establish communication with the vehicle by other means. -
Page 35: Cables
Scanner Connecting to a Vehicle 5.2.1 Cables One of two data cables, one for OBD-II/EOBD compliant vehicles and an optional one for non-OBD-II/EOBD models, is used to connect the scan tool to the test vehicle. The 26-pin end of either cable attaches to the data cable port on the top of the scan tool. The connector is secured with captive screws. -
Page 36: Operations
Scanner Operations 5.3 Operations The Scanner allows you to establish a data link to the electronic control systems of the vehicle being serviced in order to view live data parameters and perform tests. Data may be available from multiple systems, such as engine, transmission, antilock brake system (ABS), and others. Functional tests, troubleshooting tips, and trouble code information are typically available. - Page 37 Scanner Operations Main menu options vary slightly by the year, make, and model of the test vehicle. The main menu may include: Data Display— displays data parameter information from the vehicle control module. • Selecting may open a submenu of viewing options. Codes Menu—displays diagnostic trouble code (DTC) records from the vehicle control •...
-
Page 38: Codes Menu
Scanner Operations 5.3.1 Codes Menu This selection may appear as Codes, Codes Menu, Codes Only, Codes (No Data), Service Codes or something similar on the menu. Selecting opens a list of viewing options that includes: Display Codes • Clear Codes‚ on page 31 •... - Page 39 Scanner Operations Submenu options include: Trouble Code Information—opens a list of codes in ECM memory • History Codes—opens a list of codes whose symptoms are not currently present. History • codes indicate an intermittently occurring problem. Failed This Ignition—opens a list of codes that set during the current ignition cycle. •...
- Page 40 Scanner Operations NOTE: (.XML) files transferred with ShopStream Connect are text files containing vehicle information, and the DTC list. The files can be viewed and printed from ShopStream Connect (Figure 5-8). Figure 5-8 Typical - (.XML) files, viewed in ShopStream Connect Clear Codes The Scanner clears codes from the control module memory on some vehicles.
- Page 41 Scanner Operations Code Scan One of the benefits of performing a code scan is that you can quickly show your customer diagnostic related issues with a pre scan report, and then after repairing the issues you can use the post scan report to show that the repairs were completed (Figure 5-9).
- Page 42 Scanner Operations Depending on the vehicle, Code Scan (if supported) may be available from the Systems menu. Selecting Code Scan starts an active scan of vehicle control modules, and opens the Code Scan results screen (Figure 5-10). A progress indicator is shown at the top indicating the active scanning progress.
- Page 43 Scanner Operations Figure 5-11 System icon (opens Main Menu) Saving Codes, and Code Scan Results) When using the code scan feature, or when viewing individual system codes (e.g. engine, transmission) selecting the Save icon from the toolbar saves the results as a data file. The saved file(s) can be viewed using two methods: On the diagnostic tool - See View Saved...
-
Page 44: Data Display
Scanner Operations 5.3.2 Data Display Select Data to view live datastream parameters from the vehicle ECM. In data display mode the screen has a toolbar and a main body (Figure 5-12). Figure 5-12 Sample data display screen The buttons on the toolbar operate as shown in Table 4-1 on page 17 while viewing data. - Page 45 Scanner Operations Use the slider to quickly scroll through the data. Use the toolbar buttons to more accurately position the cursor. The cursor, a vertical line that indicates your position when in the graph mode, appears once you begin navigating through the data (Figure 5-13).
- Page 46 Scanner Operations Customizing the Data List The Custom Data List button on the Scanner Toolbar is used to determine which specific parameters display. Minimizing the number of parameters on the data list allows you to focus on any suspicious or symptom-specific data parameters. You can add or remove most parameters from the list.
- Page 47 Scanner Operations Changing Screen Views Selecting the View button opens a dropdown menu of options: PID List • 1 Graph • 2 Graph • 4 Graph • The PID (parameter identification) List view is a 2-column display with the name of the parameters in the left column and their current values in the right column (Figure 5-12).
- Page 48 Scanner Operations To lock parameters: 1. Highlight the parameter to be locked. 2. Tap the Lock/Unlock button on the toolbar to lock it. A copy of the locked parameter is now shown at the top of the data list, and a lock icon appears alongside the parameter name.
- Page 49 Scanner Operations Saving The Save button is used to record movies of vehicle datastream values. Saving helps when trying to isolate an intermittent problem or to verify a repair during a road test. Saved files also provide documentation that helps you explain intermittent problems to your customers. A number of data movies can be stored, which can later be opened by selecting the Previous Vehicles and Data button on the home screen.
- Page 50 Scanner Operations Setting Trigger Levels The Trigger button on the toolbar allows you to configure the scan tool to automatically capture data when a parameter value crosses a threshold. When triggering is armed, a “trigger event” pauses data collection and records a data movie. These movies are similar to an OBD-II/EOBD freeze-frame event, but include much more information.
-
Page 51: Functional Tests
Scanner Operations 5. Tap a on the toolbar, or press the Y/a key, to set the upper threshold. A lower trigger level line now appears at the mid-point of the graph. 6. Tap the plus (+) and minus (–) buttons on the toolbar, or use the up b and down d arrow keys to position the lower trigger level line to where you want it on the graph. - Page 52 Scanner Operations Figure 5-18 Sample functional test screen Toggle and variable control tests often display functional test controls on the toolbar at the top of the screen with datastream information in the main body. A Test button on the toolbar activates the test, and a Return, or similarly named, button cancels the test.
-
Page 53: Exiting The Scanner
Scanner Exiting the Scanner Fast-Track Fixes—provides actual repair information for related repairs. • NOTE: Troubleshooter appears in a Scanner menu only if tips are available for the system selected on the identified vehicle. Certain PID data parameter values display directly within the tip when performing Troubleshooter tests and procedures. -
Page 54: Suretrack
Scanner SureTrack 5.5 SureTrack SureTrack is a comprehensive source of expert knowledge for professional technicians, combining diagnostic experience and detailed parts replacement records. SureTrack will help you improve diagnostic accuracy and reduce repair time. SureTrack features: A Common Replaced Parts graph displaying the parts that are most frequently replaced to •... - Page 55 Scanner SureTrack NOTE: The Common Replaced Parts graph can be viewed directly from the DTC results screen by selecting the Common Replaced Parts Graph icon, located to the left of Common Replaced Parts Graph title bar (Figure 5-20). Figure 5-20 SureTrack DTC results 1—...
- Page 56 Scanner SureTrack SureTrack Dashboard Selecting the Fix It! icon from the DTC results screen opens the SureTrack dashboard. The initial Dashboard screen displays both the Common Replaced Parts Graph and either a Tip or Real Fix for the current DTC (depending on availability). The Related Tips and Real Fixes icons are also available from this screen (Figure 5-21).
- Page 57 Scanner SureTrack Common Replaced Parts Graph The Common Replaced Parts graph is displayed by selecting the Fix It! icon or can be viewed directly from the DTC results screen by selecting the Common Replaced Parts Graph icon, located to the left of Common Replaced Parts Graph title bar. The Common Replaced Parts graph shows the percentage of verified fixes (using the parts listed) derived from the total number of repairs by mileage.
- Page 58 Scanner SureTrack Real Fixes and Related Fixes Real Fixes - Verified successful repair information and/or procedures for the selected – Related Real Fixes - Additional Real Fixes that may be related to the selected DTC. – Fixes have been researched and obtained from professional automotive OEM and specialty technicians from a vast range of repair shops.
- Page 59 Scanner SureTrack Tips and Related Tips Tips - Experience-based diagnostic and repair tips and information for the selected DTC – Related Tips - Additional Tips that may be related to the selected DTC – Tips have been researched and obtained from professional automotive OEM and specialty technicians from a vast range of repair shops.
-
Page 60: Chapter 6: Obd-Ii/Eobd
OBD-II/EOBD Chapter 6 This Home screen option allows you to access Generic OBD-II/EOBD Scanner tests without completing a vehicle identification. This presents a quick way to check for emissions-related diagnostic trouble codes (DTCs), isolate the cause of an illuminated malfunction indicator lamp (MIL), check monitor status prior to emissions certification testing, verify repairs, and perform a number of other emissions services. -
Page 61: Global Obd Ii Code Check
OBD-II/EOBD OBD Health Check 6.1.1 Global OBD II Code Check Global OBDII Code Check displays stored emission related generic DTCs reported by the ECM. Selecting opens a submenu with two choices: Codes and Pending Codes. Either option opens a code list (Figure 6-2). -
Page 62: Global Obd Ii Clear Codes
OBD-II/EOBD OBD Health Check 6.1.2 Global OBD II Clear Codes This option is used to clear all emission related diagnostic data, such as DTCs, freeze frame data, and test results, from the memory of the selected ECM. Although OBD-II/EOBD displays generic OBD-II/EOBD data only, clearing codes erases all of the stored data, including any enhanced codes and freeze frame information. -
Page 63: Eobd
OBD-II/EOBD EOBD 6.2 EOBD Selecting EOBD opens a menu of two choices: OBD Diagnose • OBD Training Mode • Training mode allows you to navigate through the menus without being connected to a vehicle. Selecting OBD Diagnose opens a menu that lets you choose from the following options: Start Communication—initiates a test session •... - Page 64 OBD-II/EOBD EOBD The information screen shows how many control modules were detected, which ECM is communicating, and which communication protocol is being used. 5. Select Continue. A Select Service menu of available tests opens: Readiness Monitors‚ on page 55 – Status‚...
- Page 65 OBD-II/EOBD EOBD MIL Status This item is used to check the current condition of the malfunction indicator lamp (MIL). Additional information, such as which ECM commanded the MIL on and the distance driven while the MIL is on (if supported), can also be displayed. The MIL Status report can also be saved as part of the vehicle records.
- Page 66 OBD-II/EOBD EOBD To clear emission related Data: 1. Select Clear Emissions Related Data from the menu. A confirmation message displays to help prevent loss of any vital data (Figure 6-7). Figure 6-7 Sample clear codes confirmation 2. Continue from the confirmation message. The screen updates several times as ECM memory is erased, then a “data has been cleared”...
-
Page 67: Select Communication Protocol
OBD-II/EOBD EOBD ($07) DTCs Detected During Last Drive This test opens a record of any DTCs that set during the last completed drive cycle. Select to open the DTC list. ($08) Request Control of On-board System This service enables bidirectional control of the ECM. This service allows the Scanner to control the operation of an onboard system, test, or component. -
Page 68: Connector Information
OBD-II/EOBD EOBD Figure 6-8 Sample communication protocol menu The Scanner attempts to establish communication using each protocol in order to determine which one the vehicle is broadcasting on when All Protocols setting is selected. Select Back or press the N/X key to return to the OBD-II/EOBD Main menu. 6.2.3 Connector Information This option opens a database of vehicle diagnostic connector locations that includes most makes and models. -
Page 69: Chapter 7 Guided Component Tests
Guided Component Tests Chapter 7 The Guided Component Tests software provides you with a robust diagnostic database for use with scopes and meters. It is like having access to a complete library of shop manuals for testing engine management, transmission control, and ABS components. Guided Component Tests helps you with everything from selecting the appropriate test for a specific part to pointing out the best location to hook-up the test leads and the pin configuration of the connector. -
Page 70: Training And Classes
Guided Component Tests Training and Classes Figure 7-1 Sample confirmation dialog box 6. Select OK from the confirmation screen. 7. Select ENGINE from the System Select screen and a list of tests available for the identified vehicle displays. 8. Select a test from the list to continue. The identification sequence is now complete, refer to the Operations section that follows for details on how to navigate through the Guided Component Tests information and perform tests. -
Page 71: Power User Tests
Guided Component Tests Training and Classes 7.2.1 Power User Tests The Power User Tests option gives you quick access to a pre-configured meter for conducting a number of control system tests. Tests are available with or without on-screen help. Help typically provides a description of the test along with expected results and a link to the pre-set meter. -
Page 72: Operations
Guided Component Tests Operations 7.3 Operations The Guided Component Tests software provides vehicle specific component test procedures and information that aid in setting up scopes and meters. Once a test vehicle is identified, you can select a component test from the list of available tests. A Guided Component Tests menu displays once a component is selected, two types of information are available on the menu: 1. -
Page 73: Tests
Guided Component Tests Operations Screens are divided into up to four sections to help quickly guide you to the correct information: Operation—provides a general description of normal component operation. – Tech note—provides component related tips (for example, common failures or faults) as –... - Page 74 Guided Component Tests Operations Figure 7-4 Sample Test screen A Guided Component Test initially opens with the information panel below the main body of the screen visible. Typically, connection information is on the screen and a scroll indicator displays along the right edge if there is additional information below what is shown. 4.
- Page 75 Guided Component Tests Operations To adjust profile: 1. Select Profile from the toolbar. The Profile window opens below the main body of the screen. 2. Use the touch screen or the control keys to make changes to the Profile: Profile—switches the trace on and off. –...
-
Page 76: Chapter 8: Scope Multimeter
Scope Multimeter Chapter 8 The Scope Multimeter function allows you to perform multiple types of circuit and component measurement tests. This chapter includes general operation procedures, instructions for saving and reviewing test data, optional settings, and general reference information. 8.1 Overview The Scope Multimeter test functions are: Digital Multimeter (DMM) •... -
Page 77: Graphing Multimeter (Gmm)
Scope Multimeter Overview 8.1.2 Graphing Multimeter (GMM) Unlike the DMM, the graphing multimeter provides two channels for testing and plots a visual graphing line of the signal instead of displaying digital values. The GMM displays a signal’s measurements over time on a two-dimensional grid. This plotted graph is basically a graphical history (histogram) of the signal’s measurements over time. -
Page 78: Lab Scope
Scope Multimeter Overview 8.1.3 Lab Scope Similar to the GMM, the lab scope (oscilloscope) plots a visual image line of a signal’s measurements over time on a two-dimensional grid. The visual line that is displayed is commonly called a trace, and the graphical form created by a signal is called a waveform. Unlike the DMM, the lab scope allows you to visually see a signals waveform, which in turn allows you to see the strength and shape of the signal, as well as any noise that may be occurring on the circuit. -
Page 79: Tests And Capabilities (Quick Reference)
Scope Multimeter Tests and Capabilities (Quick Reference) 8.2 Tests and Capabilities (Quick Reference) The following chart identifies and describes available tests by function. NOTE: Not all the tests listed are described in this manual. This list is intended as reference only. Test Function Two Channel Lab Scope... - Page 80 Scope Multimeter Tests and Capabilities (Quick Reference) Test Function Used to measure amperage of typical motors and devices Low Amps (40) that may draw up to 40A peak (startup) when initially started. Used to measure amperage of larger motors and devices Low Amps (60) that may draw up to 60A peak (startup) when initially started.
-
Page 81: Test Leads And Accessories
Scope Multimeter Test Leads and Accessories 8.3 Test Leads and Accessories Some of the leads, probes and adapters supplied with or that may be available, are explained in the following section. NOTE: Not all test leads and/or accessories may be available in all markets. Contact your sales representative for information, or to find out more about these and other available accessories. -
Page 82: Alligator Clips And Probes
Scope Multimeter Test Leads and Accessories 8.3.3 Alligator Clips and Probes Insulated alligator clips and probes (pointed type) can be attached to the end of the test leads. Each alligator clip is color matched with a test lead, and the probes are available in red and black. Figure 8-3 Alligator clips 8.3.4 Secondary Ignition Coil Adapter Lead and Clip-on Adapter (optional) -
Page 83: Temperature Probe Adapter (Optional)
Scope Multimeter Test Leads and Accessories 8.3.6 Temperature Probe Adapter (optional) The temperature probe adapter can be used to measure temperatures ranging from –50° F to 1,800° F. Different probes are available for surface, fluid and air temperature measurements. Figure 8-6 8.3.7 Pressure Transducers and Adapters (optional) Different pressure transducers and adapters are available for measuring positive and negative gas and liquid pressures. -
Page 84: Waveform Demonstration Tools (Optional)
Scope Multimeter Test Leads and Accessories 8.3.8 Waveform Demonstration Tools (optional) To help you sharpen your lab scope and graphing multimeter skills, optional waveform demonstration tools are available as a training aid. These demonstration tools generate common waveforms, and allow you to vary their display characteristics by turning glitches on/off, helping you to become more familiar with the lab scope controls. -
Page 85: General Information
Scope Multimeter General Information 8.4 General Information This section describes the general Scope Multimeter control icon functions, screen layout and optional settings. The screen layout and control icon functions are shared between the digital/graphing multimeters and lab scope. NOTE: Scope and Multimeter tests are not vehicle specific, therefore vehicle identification is not required. 8.4.1 Scope Multimeter Screen Layout and Features 1—... - Page 86 Scope Multimeter General Information Scope Multimeter Control Icons The following control icons are common across most Scope Multimeter functions, however use may vary depending on the active function or test. A yellow frame surrounding an icon (highlighted), indicates it is selected. Other control icons (not shown) are described in Common Toolbar Control Icons‚...
-
Page 87: Measurement Out Of Range (Alert)
Scope Multimeter General Information 8.4.2 Measurement Out of Range (Alert) When performing a test, if a group of arrows displays onscreen, this indicates that the measurement is out of range for the scale selected. Arrows pointing UP—measurement over maximum range •... -
Page 88: Operation And Controls
Scope Multimeter Operation and Controls 8.5 Operation and Controls This section describes the general operation and controls used to configure the scope or meter to perform testing. All three functions share similar control panel settings, see Control Panel and Settings‚ on page 81 for additional information. NOTE: The information in the following sections is intended as a guide and general overview of the controls and functions used within the Scope Multimeter. -
Page 89: Test Lead / Probe Calibration
Scope Multimeter Operation and Controls 8.5.2 Test Lead / Probe Calibration Certain tests may display a confirmation prompt asking “Do you wish to calibrate this probe?” before continuing with the test. As general practice, it is important to ensure the test probe is calibrated before testing, to ensure accurate results. -
Page 90: Control Panel And Settings
Scope Multimeter Operation and Controls 8.5.3 Control Panel and Settings The control panel is common to all three Scope Multimeter functions, and contains the channel (or “trace”) settings and controls that are used to monitor and adjust the signal being measured. - Page 91 Scope Multimeter Operation and Controls Scale, Sweep and Probe Settings The most common and typically the first adjustments made when performing tests are the setup or adjustment of the scales and selection of a probe. All three of these adjustments are made from the control panel and are described in the following sections.
- Page 92 Scope Multimeter Operation and Controls Example: Selecting 10V, changes the vertical scale to a 10V volt scale. The scale is “always” divided by 10, therefore each division is incremented by 1V. Figure 8-15 Example: Selecting 50 psi displays a 50 psi scale that is divided by 10, therefore each division is incremented by 5 psi.
- Page 93 Scope Multimeter Operation and Controls Sweep (Horizontal or Time scale adjustment) The horizontal scale (X-axis) represents time, and the unit of measurement it is being measured in. The horizontal scale is “always” divided into10 major divisions, how these divisions are defined, sets the scale of measurement.
- Page 94 Scope Multimeter Operation and Controls Probe (Probe type “test” selection) Different types of Probes are available from the probe option menu, depending on which type of test you are performing. Changing the probe selection, also changes the vertical scale to the applicable type of measurement.
- Page 95 Scope Multimeter Operation and Controls Channel Settings The majority of the channel (trace) settings and controls are located in the Control Panel. Each setting is represented by an icon, or a value. Icons are used to make adjustments, and the displayed values represent an individual characteristic.
- Page 96 Scope Multimeter Operation and Controls Show/Hide (Channel display on/off) The Show/Hide icons allow you to turn the channels on and off. To turn a channel on and off, select the applicable channel’s Show/Hide icon. Show/Hide Icons On (Channel displayed) Off (Channel not displayed) Trace (Zero Baseline position adjustment) The Trace icon identifies the channel number and is used to open the zero baseline adjustment controls.
- Page 97 Scope Multimeter Operation and Controls Peak Detect On When peak detect is “on”, all sample points are evaluated. The points stored to the data buffer memory are intelligently selected to capture fast events that might be missed at slower effective sample rates.
- Page 98 Scope Multimeter Operation and Controls Filter Using the filter feature can minimize or smooth out signal spikes and fast variations, depending on which function is its used with. Filter - Lab Scope Using the filter with the lab scope, smooths out fast spikes, which helps to provide a good balance between noise suppression and signal integrity.
- Page 99 Scope Multimeter Operation and Controls Coupling AC Coupling AC subtracts the average value of a signal so that small variations can be displayed in the waveform. This is accomplished by blocking the direct current (DC) portions of a signal in order to amplify (show) the alternating current (AC) portions of the signal, without driving the trace off of the screen.
- Page 100 Scope Multimeter Operation and Controls To turn a trigger on/off: A trigger is activated by selecting the trigger icon from the control panel, which then automatically initiates trigger slope setup. 1. Select the desired channel’s Trigger icon. Each tap of the icon sets the trigger to a different slope setting, or turns the trigger off. 2.
- Page 101 Scope Multimeter Operation and Controls 6. Press the N/X button, to exit. 1— Trigger Marker 2— Trigger Position Control Panel Figure 8-21 Trigger marker and position controls 1— Trigger Marker (out of range symbol) 2— Waiting for Trigger Message 3— Trigger Position Control Icon Figure 8-22...
- Page 102 Scope Multimeter Operation and Controls Trigger Auto/Manual Mode (Optional Setting) NOTE: The Auto and Manual Trigger modes allow you to set the criteria used to display signals on the screen. To change the trigger mode, the trigger must be set on one of the channels. In both Auto and Manual Trigger mode the screen is updated when the signal crosses the trigger point in the selected direction (rising or falling), however: Auto Trigger—(default mode)
- Page 103 Scope Multimeter Operation and Controls To activate the Threshold function, select the Threshold icon, then select Continue from the confirmation screen (Figure 8-23). Once selected, the Threshold function remains active until the test is exited. Figure 8-23 Auto Threshold Confirmation Screen If after enabling the Threshold function, if the signal is still not displayed, reduce the vertical scale setting.
- Page 104 Scope Multimeter Operation and Controls Min, Live and Max Display Panel When Cursors are turned off, the Min, Live and Max display panel (Figure 8-24) is turned on displaying each channel’s active signal minimum and maximum recorded measurements and live measurement.
- Page 105 Scope Multimeter Operation and Controls To turn the cursors on/off: 1. To turn the Cursors on (display), select the Cursor icon from the toolbar. Two cursors are displayed on the test screen, and the Refresh, Min, Live, Max display panel is switched off and replaced by the cursor measurements panel.
-
Page 106: Secondary Ignition Testing
Scope Multimeter Operation and Controls Cursor Measurements Panel When the cursors are turned on, the Refresh, Min, Live, Max display panel is switched off and replaced by the Cursor Measurements Panel. The cursor measurements panel displays the following signal and cursor measurements: Signal amplitude at two points •... - Page 107 Scope Multimeter Operation and Controls Different secondary ignition coil adapters are available as optional equipment. These adapters attach to either the secondary lead (spark plug lead) or directly to the secondary ignition coil in order to pick up the secondary ignition signal. Universal kV Ignition Clip-on adapter - clips over a spark plug or coil lead.
-
Page 108: Optional Settings
Scope Multimeter Optional Settings Once a signal is displayed, further channel settings may be required to display the pattern characteristics you a looking for. Figure 8-26 Typical Secondary Ignition Signal 8.6 Optional Settings The following optional Scope/Meter settings are available, and can be set to your preference: Trigger Auto/Manual Mode (Optional Setting)‚... -
Page 109: Divisions
Scope Multimeter Optional Settings Changing the Display (grid on/off): 1. Select the Tools icon from the Home screen. 2. Select Settings > Configure Scope/Meter > Display from the menu options. 3. Select the desired option: Show Grid—turns grid lines on –... - Page 110 Scope Multimeter Optional Settings To access the divisions option menu: 1. Select Tools from the Home screen. 2. Select Settings from the Tools and Setup menu. 3. Select Configure Scope/Meter from the Settings menu. 4. Select Divisions from the menu. 5.
- Page 111 Scope Multimeter Optional Settings Trace Per Division - changes the dropdown vertical scale menu selections to ##/div mode, which in turn changes the vertical scale to represent ## by division. ## - represents (variable) what is being measured (voltage, amperage, pressure etc.) Example (Figure 8-30): Selecting 1.0V/div, displays a vertical scale divided by 10.
- Page 112 Scope Multimeter Optional Settings Display Settings The Display setting allows you to change the displayed value in the Vertical Scale icon to your preference. NOTE: This setting ONLY changes the value displayed in the Vertical Scale icon. Display Full Scale - displays the value of the entire (full) scale Example (Figure 8-31): If the vertical scale is set to 1V, the value displayed is 1V.
-
Page 113: Saving And Reviewing Scope / Multimeter Data Files
Scope Multimeter Saving and Reviewing Scope / Multimeter Data Files 8.7 Saving and Reviewing Scope / Multimeter Data Files The following section describes the procedures used to save and review Scope/Multimeter and Guided Component Tests data files. 8.7.1 Data Buffer The graphing multimeter and lab scope functions have the capability to save, store and playback, data (test signals) utilizing internal storage memory and buffer memory. -
Page 114: Saving Files
Scope Multimeter Saving and Reviewing Scope / Multimeter Data Files 8.7.2 Saving Files Selecting the Save icon writes the data stored in buffer memory to a file. Saving data files is useful when trying to isolate an intermittent problem or to verify a repair during a road test. The saved file can be played back (similar to a movie clip) by selecting Previous Vehicles and Data >... -
Page 115: Stopping And Reviewing Data Files
Scope Multimeter Saving and Reviewing Scope / Multimeter Data Files 8.7.3 Stopping and Reviewing Data Files During normal scope multimeter operation, data is continuously being store stored in buffer memory as it is displayed onscreen. The Stop feature, allows you to temporarily stop the waveform (signal) to review it in detail. -
Page 116: Saving Screens
Scope Multimeter Saving and Reviewing Scope / Multimeter Data Files To resume: Select the Record icon. • The display changes back and the Stop icon is shown on the toolbar. NOTE: The Shortcut button can be set to perform the Pause/Play function. See Configure Shortcut Key‚... - Page 117 Scope Multimeter Saving and Reviewing Scope / Multimeter Data Files NOTE: Zoom playback controls are identical to the standard playback controls used when reviewing data files, with the following exception: Skip Forward / Skip Back control icons - (press once) moves multiple steps relative to set magnification level (e.g.
- Page 118 Scope Multimeter Saving and Reviewing Scope / Multimeter Data Files 1— Waveform Glitches 3— Magnification Level at 32X 2— Magnification Level at 128X Figure 8-38 Examples of Magnification Level at 32X and 128X Figure 8-39 shows an example at 16X of the same waveform shown in Figure 8-37 Figure 8-38.
-
Page 119: General Reference
Scope Multimeter General Reference 8.8 General Reference 8.8.1 Basic Setup Tips (unknown signal type) When conducting automotive diagnostics, situations may arise when you need to capture and analyze a signal that you are not familiar with, or know what the intended waveform pattern should look like, or even how to set the scope to acquire the signal. -
Page 120: Using Known Good Waveforms
Scope Multimeter General Reference As a default setting, trigger is normally off. The scope/meter uses internal circuitry to display a signal if present. However, in certain circumstances additional channel adjustments may be required, or the trigger mode may have to be turned on, for a signal that is present but is not displayed. -
Page 121: Troubleshooting Signals
Use the shortest test leads possible. • Try different test leads, to verify the issue. Use the recommended snap-on leads or probes • available for the diagnostic tool or equivalent. Shielded test leads are recommended. Check the test lead or probes for damage. -
Page 122: Units Of Measurement / Conversions
Scope Multimeter General Reference 8.8.4 Units of Measurement / Conversions Base Units (Symbol) / Unit Prefix Typical Expressions (µ) micro 0.000001 or 10 or 1/1,000,000 (m) milli 0.001 or 10 or 1/1,000 (c) centi 0.01 or 10 or 1/100 (k) kilo or 1,000 (M) mega or 1,000,000... - Page 123 Scope Multimeter General Reference Pressure Units (Symbol) / Description Equivalents (kPa) KiloPasca 1 kPa = 1000 Pa (MPa) Megapascal 1 MPa = 1,000,000 Pa 1 inHg = 0.03386388 bar (inHg) inches of mercury 1 inHg = 0.4911541 psi 1 inHg = 3386.388 Pa Pressure Conversions psi x 0.0689 = bar psi x 6.8950 = kPa...
-
Page 124: Glossary Of Common Terms
Scope Multimeter General Reference Duty % to Dwell Conversions Duty Cycle Dwell 4 cyl 6 cyl 8 cyl 36.0 24.0 18.0 45.0 30.0 22.5 54.0 36.0 27.0 63.0 42.0 31.5 72.0 48.0 36.0 81.0 54.0 40.5 90.0 60.0 45.0 8.8.5 Glossary of Common Terms Term / Abbreviation Description Alternating Current - electrical current that switches polarity at... - Page 125 Scope Multimeter General Reference Term / Abbreviation Description Horizontal Scale See Sweep Scale Invert Function used to switch signal polarity, Used to represent a numerical value denoting the actual measured air/fuel ratio with respect to the ideal air/fuel ratio at stoichiometry.
- Page 126 Scope Multimeter General Reference Term / Abbreviation Description The threshold function automatically sets a trigger and determines a threshold level in the middle of the signal range Threshold (calculated from the Min and Max measurements) to be used as a reference point to calculate the measurement. Trace The actual visible line displayed on the scope screen.
-
Page 127: Chapter 9 Previous Vehicles And Data
Previous Vehicles and Data Chapter 9 The Previous Vehicles and Data Home screen selection allows you to quickly configure the diagnostic tool to the identity of a recently tested vehicle, and to access saved data files. A menu of options opens when Previous Vehicles and Data is selected: Vehicle History •... -
Page 128: View Saved Data
Previous Vehicles and Data View Saved Data 9.2 View Saved Data Selecting the View Saved Data menu option opens a list of all the data movies and screen images that are stored in memory. Saved files are listed in chronological order by the date and time that they were created with the most recent files are at the top of the list. -
Page 129: Viewing Codes And Code Scan Results
Previous Vehicles and Data Viewing Codes and Code Scan Results 9.3 Viewing Codes and Code Scan Results When code scan or single system code results are saved, they are saved in (.XML) file format (Figure 9-3). Figure 9-3 Typical - Code Results (.XML) file The saved (.XML) file(s) can be viewed using these methods: On the diagnostic tool - See Viewing Code Results on the Diagnostic... -
Page 130: Delete Saved Data
Previous Vehicles and Data Delete Saved Data Viewing Code Results on the Diagnostic Tool Selecting a system code or a code scan results file from your saved file list (Figure 9-3), opens the file onscreen. When opened, the (.XML) file displays basic vehicle information and a list of DTCs with a brief description of each. -
Page 131: Chapter 10 Tools
Tools Chapter 10 The Tools option on the home screen is used to configure the diagnostic tool for your personal preferences. Tap the Tools button to open a menu of options. Figure 10-1 Sample Tools menu 10.1 Tools Menu The following options are available from the Tools menu: Connect-to-PC—use to transfer and share files with a personal computer (PC) •... -
Page 132: Configure Shortcut Key
Tools Tools Menu To connect the diagnostic tool to a PC: 1. Connect the supplied USB cable to the diagnostic tool and then to the PC. A USB cable, supplied with your diagnostic tool, is used to connect the diagnostic tool to the PC. -
Page 133: System Information
Tools Tools Menu 10.1.3 System Information The System Information option lets you view configuration information for your diagnostic tool. Figure 10-3 Sample system information screen To display the System information screen: 1. Select Tools from the Home screen to open the menu. 2. - Page 134 Tools Tools Menu Display options include: Brightness‚ on page 125—adjusts the intensity of the screen back lighting. • Color Theme‚ on page 125—changes the background color of the screen display. • High Contrast Toolbar‚ on page 126—enhances toolbar graphics for poor lighting conditions. •...
- Page 135 Tools Tools Menu Selecting opens a menu with two choices: Day Theme (white background) and Night Theme (black background). Make a selection and a “please wait” message momentarily displays followed by the Home screen. The new toolbar setting is now active. Figure 10-5 Sample Night Theme menu screen High Contrast Toolbar This option allows you to switch to a high contrast toolbar.
- Page 136 Tools Tools Menu Font Type This option allows you to select between standard and bold faced type for the display screen. Bold type makes screen writing more legible under poor lighting or bright sunlight conditions. Figure 10-7 Sample bold type on a black background Selecting opens a menu with two choices: Normal Font and Bold Font.
- Page 137 Tools Tools Menu Figure 10-8 Sample calibration screen 4. Touch each box on the screen as it displays. The display returns to the Settings menu once the screen calibration procedure is complete. IMPORTANT: It is critical to complete the touch screen calibration sequence once it has begun. Never power down the unit while a screen calibration is in process, serious damage to the unit may result.
- Page 138 Tools Tools Menu Figure 10-9 Sample Clock Settings screen 4. Tap the up (+) button on the screen or press the up (b) key on the keypad to incrementally increase the number in the highlighted field. Tap the down (–) button on the screen or press down (d) on the keypad to incrementally decrease the number.
- Page 139 Tools Tools Menu Make a selection, then tap the Back button or press the N/X key to return to the menu. Configure Wi-Fi Wi-Fi Connection / Troubleshooting‚ on page 137. Configure Scanner This option determines whether or not the scales are displayed on the data graphs when using the Scanner.
- Page 140 Tools Tools Menu Trigger Mode Configure Scope/Meter allows you to choose the type of trigger, see Trigger‚ on page 84 for additional information. Two triggering choices are available: Auto Trigger—updates the screen when the signal crosses the trigger threshold in the •...
- Page 141 Tools Tools Menu Divisions The option allows you to switch between Full Scale or Per Division settings for the trace setup and the display settings. Full Scale configures the meter so one division, or unit, is the full viewing area of the screen.
- Page 142 Tools Tools Menu Figure 10-13 Sample Configure Units menu To change the units setup: 1. Select Tools from the Home screen to open the menu. 2. Select Configure Units to open the menu. 3. Select an item from the Configure Units menu. 4.
-
Page 143: Chapter 11 Maintenance
Maintenance Chapter 11 This chapter covers how to care for your diagnostic tool. 11.1 Cleaning and Inspecting the Diagnostic Tool When using the diagnostic tool perform the following tasks to keep it in top shape: Check the housing, wiring, and connectors for dirt and damage before and after each use. •... -
Page 144: Battery Safety Guidelines
If the battery pack no longer holds a charge, contact your sales representative to order a new one. IMPORTANT: Replace the battery pack with original Snap-on replacement parts only. To replace the battery pack: 1. Loosen the two captive screws that retain the battery compartment cover on the back-side of the diagnostic tool. -
Page 145: Disposing Of The Batteries
Maintenance Battery Service 1— Battery 2— Battery Cover 3— Captive Screws Figure 11-1 Battery pack replacement 11.2.3 Disposing of the Batteries Always dispose of the battery pack according to local regulations, which vary for different countries and regions. The battery pack, while non-hazardous waste, does contain recyclable materials. -
Page 146: Chapter 12 Wi-Fi Connection / Troubleshooting
The diagnostic tool is equipped with the ability to connect to a Wi-Fi network, however the connection is solely dedicated to the Snap-on Web Services Network. Connecting to Wi-Fi allows the tool to receive important messages from Snap-on, and if applicable connect to information services. -
Page 147: Checking If Wi-Fi Is Connected
Wi-Fi Connection / Troubleshooting Checking if Wi-Fi is Connected 12.2 Checking if Wi-Fi is Connected Check the Wi-Fi indicator in the title bar: Wi-Fi is on and connected to a network (1 to 3 bars). Wi-Fi is on, but not connected (zero bars). See Wi-Fi Troubleshooting and Status Messages‚... - Page 148 Wi-Fi Connection / Troubleshooting Turning Wi-Fi On and Connecting to a Network The screen will change to display available supported network connections. 4. Select your network. Use the scroll feature to show all active connections (Figure 12-2). Figure 12-2 Wi-Fi Configuration Screen 1—...
-
Page 149: Add Network Advanced
Wi-Fi Connection / Troubleshooting Add Network Advanced (Connecting to a hidden network) 12.5 Add Network Advanced (Connecting to a hidden network) The Add Network selection allows you to connect to a network that is not broadcasting its name (not visible in the displayed network list). These networks are also known as "hidden" networks. To connect to a hidden network you will first need to know the following: Network Security Type •... - Page 150 Wi-Fi Connection / Troubleshooting Wi-Fi Testing The network connection test is an automated test that begins when the screen is displayed. Network connection systems are tested in sequence and display a status indicator (Red = test failed, Yellow = test is process, or Green = test completed satisfactorily) when finished (Figure 12-4).
-
Page 151: Wi-Fi Troubleshooting And Status Messages
There may be some situations that require your time for router connection troubleshooting and/or additional consultation and equipment. Snap-on Incorporated is not responsible for any costs incurred for any additional equipment, labor or consultation charges or any other costs that may result from correcting non-connectivity issues with this device. - Page 152 Wi-Fi Connection / Troubleshooting Wi-Fi Troubleshooting and Status Messages 3. Repeat steps (1) and (2) for ALL saved Wi-Fi networks. 4. Once all saved Wi-Fi networks have been deleted (forgotten) turn off the diagnostic tool. 5. Turn on the diagnostic tool and connect to the desired Wi-Fi network, see Turning Wi-Fi On and Connecting to a Network‚...
-
Page 153: Informative Messages
Wi-Fi Connection / Troubleshooting Wi-Fi Troubleshooting and Status Messages Check Wi-Fi signal strength - out of range or interference. Move closer (within 50 Ft. (15 M) or into a direct open sight-line of the router or if applicable, remote wireless access point. Eliminate This device is not interference from overhead lights, windows, walls, Router... -
Page 154: Chapter 13 Shopstream Connect
ShopStream Connect Chapter 13 This chapter includes a brief introduction to some of the key features of the ShopStream Connect software. For detailed ShopStream Connect information and instructions, download the ShopStream Connect User Manual from our website: https://www.snapon.com/diagnostics/uk/User-Manuals.htm The ShopStream Connect™ (SSC) software is PC-based software that extends the capabilities of your diagnostic tool. -
Page 155: Ssc Main Screen
ShopStream Connect SSC Main Screen If the ShopStream Connect software does not open, open it from the Windows Start menu or use the ShopStream Connect shortcut icon on the Windows desktop (automatically created during installation). 13.2 SSC Main Screen The ShopStream Connect software will open automatically when you connect the diagnostic tool to your PC USB connection, Using SSC (Connecting to your PC)‚... -
Page 156: Scanner Dataviewer
ShopStream Connect Scanner DataViewer 6— Main display—shows stored data files details. NOTE: The files listed are sortable (ascending/descending) by clicking on the column tab at the top (e.g. File Name, Type, etc.) Sort preferences are saved when the ShopStream Connect program is closed. 7—... -
Page 157: Image Viewer
ShopStream Connect Image Viewer 13.4 Image Viewer SSC allows you to view and print .bmp, .jpg and .sps image files (screenshots) saved on your diagnostic tool, with your PC. NOTE: File extension types vary depending on the diagnostic tool. Not all the file extensions described here may be available on your diagnostic tool. -
Page 158: Printing The Code Scan Report
ShopStream Connect Printing the Code Scan Report 13.5 Printing the Code Scan Report To print the Code Scan Report, the saved code scan .XML file must be opened using ShopStream Connect. To print the Code Scan Report using ShopStream Connect: 1. - Page 159 ShopStream Connect Printing the Code Scan Report Selecting Print opens the Windows print dialog window (Figure 13-7). Select your printer from the list, then select Print to print the report. My printer 1 My printer 2 Figure 13-7...
-
Page 160: Software Upgrades And Updates
1. Select Tools > Update Software > (diagnostic tool type - e.g. ETHOS Edge, MODIS Edge, SOLUS Edge, etc.) from the Menu bar (Figure 13-8). The software checks the Snap-on web server for available updates. My Diagnostic Tool Figure 13-8 2. If service release updates are available, select Next to continue, then select Download and... -
Page 161: End User License Agreement
Use of Software is governed by the terms and conditions of the End User License Agreement. The diagnostic tool should not be initially operated until the End User License Agreement is read. Use of the device acknowledges your acceptance of the End User License Agreement. The Snap-on Incorporated Software End User License Agreement is available at: https://eula.snapon.com/diagnostics...
Need help?
Do you have a question about the Modis Ultra and is the answer not in the manual?
Questions and answers