
Related Manuals for YOKOGAWA WT310E


Summary of Contents for YOKOGAWA WT310E
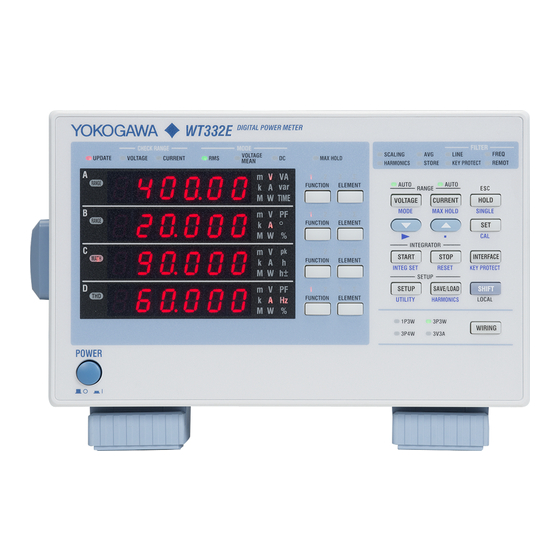
- Page 1 WT310E/WT310EH/WT332E/WT333E Digital Power Meter User’s Manual IM WT310E-01EN 2nd Edition...
- Page 2 Thank you for purchasing the WT310E, WT310EH, WT332E, or WT333E Digital Power Meter. This instrument is a power measurement instrument that can measure parameters such as voltage, current, and power. This User’s Manual explains the features of this instrument and how to use them. To ensure correct use, please read this manual thoroughly before beginning operation.
-
Page 3: Symbols And Notation Used In This Manual
Characters That Appear on the 7-Segment LED Because this instrument uses a 7-segment LED display, numbers, letters, and mathematical symbols are displayed using special characters in the manner shown below. Some of the characters shown below are not used by this instrument. ^ (exponentiation) Lowercase c Lowercase h × ÷ IM WT310E-01EN... - Page 4 SET key will be reflected in the settings. Explanation This section describes the setup items and the limitations regarding the procedures. It may not give a detailed explanation of the feature. For a detailed explanation of the feature, see chapter 1. IM WT310E-01EN...
-
Page 5: Entering Values
Moving the Decimal Point Press SHIFT+▲ (.) to move the decimal point to the right. If you press SHIFT+▲ (.) when the decimal point is as far to the right as it can be, the decimal point will move to the leftmost possible position. Increases the number Moves the decimal point to the right Reduces the number Moves the digit that is being set to the right IM WT310E-01EN... -
Page 6: Table Of Contents
Displaying the Efficiency (WT332E/WT333E only), Crest Factors, the Results of Computations Using Basic Arithmetic, and Average Active Powers ..............4-8 Setting the MAX Hold Feature ..................4-15 Setting the Number of Displayed Digits ................4-16 Chapter 5 Integration 5.1 Integration Feature ......................5-1 5.2 Setting the Integration Mode and Timer ................5-5 5.3 Displaying Integrated Values .................... 5-6 5.4 Notes about Using Integration ..................5-9 IM WT310E-01EN... - Page 7 Symbols and Determination of Measurement Functions ........App-1 Appendix 2 Power Basics (Power, harmonics, and AC RLC circuits) ........App-6 Appendix 3 Power Range ....................App-14 Appendix 4 Setting the Measurement Period ..............App-17 Appendix 5 Measurement Accuracy and Measurement Error ..........App-21 Appendix 6 Menu Transition Diagram ................. App-26 Appendix 7 Block Diagram ....................App-34 Index IM WT310E-01EN...
-
Page 8: Chapter 1 Features
The items that you can measure with this instrument are listed below. For details about how the values of measurement functions are determined, see appendix 1. For explanations of the terms measurement function, input element, wiring unit, and Σ function, see “What Is a Measurement Function?” (page 1-4). WT310E and WT310EH The WT310E and WT310EH are only equipped with one input element. Because of this, they can only measure single-phase measurement functions. They cannot measure comprehensive measurement functions that treat multiple input elements as a single wiring unit (Σ functions). - Page 9 * This measurement function is set using the MATH feature of the WT332E/WT333E. Basic Arithmetic Measurement Panel Indicator Description Function Light (Symbol) MATH MATH A×B A×B MATH A÷B A÷B MATH A÷B^2 A÷B MATH A^2÷B ÷B MATH * This measurement function is set using the MATH feature of this instrument. IM WT310E-01EN...
- Page 10 ΦU(k) V° 2 to 50* ΦI(k) 2 to 50* A° k: The harmonic order * The maximum measured harmonic order varies depending on the frequency of the fundamental wave. (See section 7.4, “Harmonic Measurement,” in the Getting Started Guide, IM WT310E- 02EN.) IM WT310E-01EN...
- Page 11 Voltage input Wiring System The WT310E/WT310EH uses a single-phase, two-wire system. Wiring Units and Σ Functions The WT310E/WT310EH does not have multiple input elements that can be combined into wiring units and Σ functions. WT332E/WT333E Input Elements An input element is a set of input terminals that a single phase of voltage and current that you want to measure can be applied to.
-
Page 12: Measurement Conditions
The average of one period of the voltage or current. This mode is useful for determining the average value of a DC input signal or the value of a DC signal that is superimposed on an AC signal. f(t) : Input signal (t) dt : One period of the input signal Index IM WT310E-01EN... - Page 13 Wiring Systems (For procedures, see section 2.1) The wiring systems that you can select vary depending on the model. WT310E and WT310EH The WT310E and WT310EH are only equipped with one input element. You can measure single- phase, two-wire systems. Because there is only one input element, you cannot select different wiring systems. WT332E (Two Input Element Model) The WT332E is equipped with two input elements (element 1 and element 3).
- Page 14 You can turn range skipping on and off from the display menu of this instrument. You can specify which measurement ranges to skip by sending communication commands through the communication interface or by using WTViewerFreePlus. IM WT310E-01EN...
- Page 15 (EXT) from a current sensor that produces voltage. Set how many millivolts the current sensor transmits when 1 A of current is applied (conversion ratio). When using a current sensor that produces current, set the conversion ratio as the CT ratio. IM WT310E-01EN...
-
Page 16: Function
3, measurement at a crest factor of 300 is possible. The voltage range, current range, effective input range, and measurement accuracy vary depending on the crest factor setting. For details, see chapter 7 in the Getting Started Guide, IM WT310E-02EN. IM WT310E-01EN... - Page 17 To capture relatively fast load fluctuations in the power system, select a fast data update interval. To capture low frequency signals, select a slow data update interval. If the fluctuation in the input signal period is large, select Auto. IM WT310E-01EN 1-10...
- Page 18 With the specified attenuation constant, the numeric data is exponentially averaged according to the equation below. −D − − Dn: Displayed value that has been exponentially averaged n times. (The first displayed value, D , is equal to M Dn–1: Displayed value that has been exponentially averaged n–1 times. Mn: Numeric data at the n time. K: Attenuation constant (select from 8, 16, 32, and 64) IM WT310E-01EN 1-11...
-
Page 19: Function
The measurement functions that are directly averaged are indicated below. Other functions that use these functions in their computation are also affected by averaging. For details about how the values of measurement functions are determined, see appendix 1 in the Getting Started Guide, IM WT310E- 02EN. -
Page 20: Holding Measured Values And Performing Single Measurements
While the display is held, the signal is measured once at the data update interval, and then the display is re-held. If you press SHIFT+HOLD (SINGLE) when the display is not held, measurement restarts from that point. Index IM WT310E-01EN 1-13... -
Page 21: Measuring Power
Average Active Power during Integration (For procedures, see section 4.5) You can compute the average active power within the integrated period. This instrument determines the average active power by dividing the watt hour (integrated active power) by the integration time. IM WT310E-01EN 1-14... -
Page 22: Integrated Power (Watt Hour)
START, integration starts, and it continues until you press STOP. However, if either of the conditions below is met, integration is stopped, and the integration time and integrated value are held. • The integration time reaches the maximum integration time (10000 hours). • The integrated value reaches its maximum or minimum displayable value. Hold Hold When the maximum integrated value is reached Hold Hold Index Start Stop Reset Start Reset IM WT310E-01EN 1-15... - Page 23 Stop. If either of the conditions below is met, integration is stopped, and the integration time and integrated value are held. • You press STOP. • The integrated value reaches its maximum or minimum displayable value. Hold Hold Timer Timer Timer value value value Start Stop Reset Integration Methods (Equations) For information on the equations used for integration, see appendix 1. IM WT310E-01EN 1-16...
-
Page 24: Harmonic Measurement (Option)
Total Harmonic Distortion Equation (For procedures, see section 6.3) You can select the equation for determining the total harmonic distortion from the options listed below. The following explanations are for when the upper limit of measured harmonic order is 50. If the maximum number of measured harmonic orders is less than 50, the equation will be applied to the harmonic orders up to the specified maximum number. • IEC: The ratio of the rms value of harmonics 2 to 50 to the rms value of the fundamental wave (1st harmonic) is calculated. Index • CSA: The ratio of the rms value of harmonics 2 to 50 to the rms value of harmonics 1 to 50 is calculated. IM WT310E-01EN 1-17... -
Page 25: Storing Measured Data And Saving And Loading Setup Parameters
PC, and you can then view the data on the PC. Saving and Loading Setup Parameters (For procedures, see section 7.2) You can save four sets of setup parameters on this instrument. You can load saved setup parameters and restore the saved settings. IM WT310E-01EN 1-18... -
Page 26: Communication Functions
PC and change the settings of this instrument without creating your own communication control programs. PC monitor WT332E/WT333E WT310E/WT310EH Saved data Setting changes Example of a window for configuring Example of a window showing measured data this instrument Index IM WT310E-01EN 1-19... -
Page 27: Other Features
You can output voltage, current, active power, apparent power, reactive power, power factor, phase angle, frequency, voltage peak, current peak, and integrated values as a ±5 V FS DC voltage. You can output values using 4 output channels on the WT310E/WT310EH and 12 output channels on the WT332E/WT333E. Remote Control (Option; for details, see chapter 5 of the Getting... -
Page 28: Chapter 2 Measurement Conditions
π f(t) : Input signal · (t) dt : One period of the input signal Select this mode when the input voltage or current is DC. The input signal is linearly averaged, and the result is displayed. IM WT310E-01EN... - Page 29 • Ep • Ep • Ep • Ep Pulse 2π 2π 4π 2π τ τ When the above is expressed using duty D (= 2π π πD • Ep D • Ep D • Ep D • Ep IM WT310E-01EN...
-
Page 30: Configuring The Wiring System Settings (Wt332E/Wt333E Only)
Configuring the Wiring System Settings (WT332E/WT333E only) Procedure Press WIRING to select the wiring system. Each time you press WIRING, the wiring system changes in the order shown below. The WT310E and WT310EH only have one input element, so there is no wiring system selection. 1P3W 3P3W WT332E (2 input elements) 3P4W 3V3A... - Page 31 3. The following options appear when the crest factor has been set to 6 or 6A. Auto 10, 5, 2.5, 1, 0.5, 0.25 ←A 100, 50, 25, 10, 5, 2.5 ←mA SEnSor The unit is “mA.” IM WT310E-01EN...
-
Page 32: 2.3 Setting The Measurement Range When Using Direct Input
SEnSor only appears when the external current sensor input option is installed. For details about the procedure when selecting SEnSor, see section 2.4. Index Voltage and Current Range in Quick Configuration Mode Press the VOLTAGE or CURRENT key. In quick configuration mode, the VOLTAGE or CURRENT key and the ▼ and ▲ keys illuminate. No display appears on the menu. The currently set range appears temporarily in display B, for the voltage range, or display D, for the current range, and then the measured data reappears. IM WT310E-01EN... - Page 33 You can select a fixed voltage range from a list of options. Even if the size of the input signal changes, the selected voltage range will not change. Set the ranges according to the rms values of the input signal. Voltage Ranges • When the crest factor is 3, you can select 600 V, 300 V, 150 V, 60 V, 30 V, or 15 V. • When the crest factor is 6 or 6A, you can select 300 V, 150 V, 75V, 30 V, 15V, or 7.5 V. IM WT310E-01EN...
- Page 34 Note When the WT310E is measuring using one of the following fixed current ranges and receives excessive input for a given period of time, to protect the input circuit, the WT310E forcefully changes the current range to 1 A (0.5 A if the crest factor is 6 or 6A) and switches from fixed range mode to auto range mode.
- Page 35 W, the unit on the display will change to “kW.” When the result exceeds 1000 kW, the unit on the display will change to “MW.” • For specific voltage and current range combinations and power range values, see appendix 3. Note • In auto range mode, because the voltage and current ranges switch independently according to range increase and decrease conditions, different power ranges may be set for the same measured or computed power value. • If you open the voltage input terminal, a voltage value of up to 0.3 V may be displayed due to hum noise at the power line frequency of 50 Hz or 60 Hz and other phenomena. This is because of the high input resistance of the voltage input terminal. Shorting the terminal will result in a value of 0 V. IM WT310E-01EN...
-
Page 36: Setting The Measurement Ranges When Using An External Current Sensor (Option)
(Display C) Confirm The same as step 6. Close menu. The same as step 6. the setting. Note The setting method selection menu (which allows you to select ALL or EACH) will not appear on the WT310E or WT310EH. IM WT310E-01EN... - Page 37 Auto, E 1, E 0.5, E 250, E 100, E 50, E 25, dirECt The above menu is displayed on the WT332E/WT333E. On the WT310E, SEnSor appears after the 5 mA range. On the WT310EH, SEnSor appears after the 1 A range. External Current Sensor Measurement Range in Quick Configuration Mode Press CURRENT. In quick configuration mode, the CURRENT key and the ▼ and ▲ keys illuminate. No display appears on the menu. IM WT310E-01EN 2-10...
- Page 38 Setting All the Values or Individual Values (WT332E/WT333E) On the WT332E/WT333E0, you can set the method for setting the scaling constant to ALL or EACH. The default setting is ALL. The setting method selection menu will not appear on the WT310E or WT310EH. • ALL: Select this option to set all the scaling constants of each element to the same value.
- Page 39 The procedure for setting scaling constants varies depending on the setting method that you have selected. You can set a scaling constant to a value between 0.001 and 9999. The default setting is 10.00. On the WT310E and WT310EH, the scaling constant is set in display C. • When the Setting Method Has Been Set to ALL In display D, you can set the scaling constant for all the elements.
- Page 40 8. Press to set the number. Press to move the digit. Press to move the decimal point. Confirm the setting. Close menu. Note The input element selection menu (ALL/EL1/EL2/EL3/End) will not appear on the WT310E or WT310EH. IM WT310E-01EN 2-13...
-
Page 41: 2.5 Setting The Scaling Feature When Using A Vt Or Ct
Setting All the Coefficients or Individual Coefficients On the WT332E/WT333E, you can select the elements whose coefficients you want to set. The default setting is ALL. The setting method selection menu will not appear on the WT310E or WT310EH. • ALL: Select this option to set all the coefficients of each element to the same value. - Page 42 After you have set the coefficients, select whether to set scaling to on or oFF. The default setting is oFF. • on: Scaling starts, and the SCALING indicator illuminates. • oFF: Scaling is stopped. The SCALING indicator turns off. Note • When the product of the coefficient and the measurement range exceeds 9999 M (10 ) , the computation overflow indication (--oF--) appears. • When you use an external current sensor for measurement and scaling is enabled, the external current sensor’s scaling constant is further multiplied by the VT or CT ratio. The scaling constant is different from the scaling feature that is explained in this section. For details, see section 2.4. Index IM WT310E-01EN 2-15...
-
Page 43: Configuring Measurement Range Skipping
You can specify which measurement ranges to skip by sending communication commands through the communication interface. You cannot specify which measurement ranges to skip from the display men of this instrument. For details, see the Communication Interface User’s Manual, IM WT310E-17EN. You can also specify which measurement ranges to skip using the WTViewerFreePlus software. -
Page 44: Setting The Crest Factor
* 220% for the maximum range (20 A range for crest factor 6) on the WT310EH Note • When you set the crest factor and are using fixed ranges, the voltage and current ranges are set to their maximum values. • If you set the crest factor when auto range is in use, the voltage and current ranges are set to their maximum ranges, and then auto range is applied. • Set the crest factor to six to meet the measurement condition of a crest factor of 5 or greater, which is required by IEC62018, etc. • The voltage range, current range, effective input range, and measurement accuracy vary depending on the crest factor value. For details, see chapter 7 in the Getting Started Guide, IM WT310E-02EN. IM WT310E-01EN 2-17... -
Page 45: Setting The Measurement Period
Note • The measurement period for determining the numeric data of the peak voltage or peak current (peak values) is always the entire span of the data update interval. • For details about setting the measurement period, see appendix 4. • When the data update interval (see section 2.10) is set to Auto, the measurement period is determined by the synchronization source set from the menu described in section 2.10. • For information about the measurement period for measurement functions used in harmonic measurement (option), see section 6.3. IM WT310E-01EN 2-18... -
Page 46: Configuring The Input Filters
Line Filter The line filter is only applied to the measurement circuit. The line filter removes noise components from the input signal. The cutoff frequency is 500 Hz. The default setting is oFF. • on: The line filter is enabled and the LINE indicator illuminates. • oFF: The line filter is disabled. The LINE indicator turns off. IM WT310E-01EN 2-19... - Page 47 Even if you enable the frequency filter, the measured voltage and current values will include harmonic components. Note You cannot enable or disable input filters between the time when integration is started and the time when it is stopped and reset. IM WT310E-01EN 2-20...
-
Page 48: 2.10 Setting The Data Update Interval
(described later) is detected, the UPDATE indicator blinks, measured data is updated, output as analog signals, and transmitted through the communication interface. * 100 ms or more. • To capture relatively fast load fluctuations in the power system, select a fast data update interval. To capture low frequency signals, select a slow data update interval. • If the fluctuation in the input signal period is large, select Auto. IM WT310E-01EN 2-21... - Page 49 Set the following items. Synchronization Source • The synchronization source that you will set in this section is a special synchronization source that is used only when the data update interval is Auto is used.* * For details on synchronization sources, see section 2.8. • You can select the synchronization source from the options listed below. The default value is U1 for the WT310E/WT310EH and I1 for the WT332E/WT333E. • U1: The synchronization source is set to the voltage of element 1. • I1: The synchronization source is set to the current of element 1. • U2: The synchronization source is set to the voltage of element 2. (WT333E only) • I2: The synchronization source is set to the current of element 2. (WT333E only) • U3: The synchronization source is set to the voltage of element 3. (WT332E and WT333E) • I3: The synchronization source is set to the current of element 3. (WT332E and WT333E)
-
Page 50: 2.11 Setting Averaging
(Display B) (Display C) Select the type of processing. (Display C) Set the coefficient. (Display D) Confirm Close menu. the setting. Turning Averaging On and Off Select averaging. (Display B) Index (Display C) Confirm Close menu. the setting. IM WT310E-01EN 2-23... - Page 51 The specified average count is used to compute linear averages according to the equation below. + • • • M − − − − : Displayed value of the linear average of a total of m items of numeric data from the n–(m–1) the n time : Numeric data at the n–(m–1) time n–(m–1) ……………………………………………… ……………………………………………… : Numeric data at the n–2 time n–2 : Numeric data at the n–1 time : Numeric data at the n time m: Average count IM WT310E-01EN 2-24...
- Page 52 After you set the averaging coefficient (the attenuation constant or average count), select whether to set averaging to on or oFF. The default setting is oFF. • on: Averaging starts, and the AVG indicator illuminates. • oFF: Averaging is stopped. The AVG indicator turns off. Note • When you start integration, averaging is disabled. Even after integration stops and is reset, averaging is not enabled again. • In harmonic measurement, only exponential averaging is available. For details, see section 6.1. Index IM WT310E-01EN 2-25...
-
Page 53: Chapter 3 Holding Measured Values And Performing Single Measurements
You can use the hold operation to stop measuring and displaying the measured data at each data update interval and hold the display of all measurement function data. The D/A output, communication output, and other values reflect the held values. Note For information about holding during integration, see section 5.1. Index IM WT310E-01EN... -
Page 54: Performing Single Measurements
If you press SHIFT+HOLD (SINGLE) when the display is not held, measurement restarts from that point. Holding the SHIFT key for at least two seconds makes the shifted state continuous (SHIFT lock feature). If you plan on performing single measurements frequently, you can enable the SHIFT lock and perform single measurements just by pressing HOLD. To disable the SHIFT lock, press SHIFT. IM WT310E-01EN... -
Page 55: Chapter 4 Measuring Power
Press ELEMENT to select which element to display. Each time you press ELEMENT, the input element changes in the order shown below. The WT310E and WT310EH only have one input element, so there is no input element selection. Σ WT332E... - Page 56 4.1 Displaying Voltages, Currents, and Active Powers Continuous Maximum Allowable Input Voltage Peak voltage of 1.5 kV or rms value of 1.0 kV, whichever is less. Current Direct Input • WT310E/WT332E/WT333E When the crest factor is 3: 0.5 A to 20 A When the crest factor is 6 or 6A: 0.25 A to 10 A Peak value of 100 A or rms value of 30 A, whichever is less. • WT310E When the crest factor is 3: 5 mA to 200 mA When the crest factor is 6 or 6A: 2.5 mA to 100 mA Peak value of 30 A or rms value of 20 A, whichever is less.
-
Page 57: Displaying Apparent Powers, Reactive Powers, And Power Factors
The procedure for selecting an input element is the same as the procedure in section 4.1. The WT310E and WT310EH only have one input element, so there is no input element selection. Explanation Displayed Function Select which measurement function to show on the display. - Page 58 The elements that you can select vary depending on the model. Check the model when selecting elements. • 1, 2, or 3: Display the measured values of element 1, 2, or 3. • Σ: See section 4.1. Note • A power factor of 1.0001 to 2.0000 is displayed as 1.0000. A power factor of 2.0001 or greater is displayed as an error (“Error”). A power factor of –2.0000 to –1.0001 is displayed as –1.0000. A power factor of – 2.0001 or less is displayed as an error (“Error”). • Even when the input signal is the same, the display may change if you change the measurement mode (RMS, VOLTAGE MEAN, or DC). For details on measurement modes, see section 2.1. • When either the voltage or current falls to 0.5% or less (1% or less if the crest factor is set to 6 or 6A) of the measurement range, the power factor will be displayed as an error (“Error”). IM WT310E-01EN...
-
Page 59: Displaying Phase Angles And Frequencies
The procedure for selecting an input element is the same as the procedure in section 4.1. The WT310E and WT310EH only have one input element, so there is no input element selection. Explanation Displayed Function Select which measurement function to show on the display. - Page 60 • The period cannot be detected if the AC amplitude is small. For information on the detectable frequency levels, see the conditions listed under “Accuracy” under “Frequency Measurement” in chapter 7, “Features,” in the Getting Started Guide, IM WT310E-02EN. • This instrument measures the frequency by synchronizing with the cycle of the input signal. We recommend that you enable the frequency filter when measuring an inverted waveform or a waveform with a high noise level.
-
Page 61: Displaying Peak Values
Press the ELEMENT key for display C to select which element to display. The procedure for selecting an input element is the same as the procedure in section 4.1. The WT310E and WT310EH only have one input element, so there is no input element selection. Explanation Displayed Function Select which measurement function to show on the display. -
Page 62: Displaying The Efficiency (Wt332E/Wt333E Only), Crest Factors, The Results Of Computations Using Basic Arithmetic, And Average Active Powers
Each time you press FUNCTION, the displayed function changes in the order shown below. Display MATH • Vpk, Apk, Wpk, Wh±, and Ah± all illuminate twice. The first time is for the positive measurements and the second time is for the negative measurements. • The MATH indicator is on the left side of the 7-segment LED display. • Press SHIFT before pressing FUNCTION to change the displayed function in reverse order. When the displayed function is set to MATH, there is no element indication. Pressing ELEMENT has no effect. IM WT310E-01EN... - Page 63 There are four types of computation functions: efficiency (WT332E/WT333E only), crest factor, basic arithmetic, and average active power. The default setting is the crest factor function (CF u1) on the WT310E/WT310EH and the efficiency function (EFFi) on the WT332E/WT333E. Efficiency (EFFi; WT332E/WT333E only) The efficiency of the DUT is computed.
- Page 64 • The meanings of the displayed symbols are explained below. : + (Addition) : − (Subtraction) : × (Multiplication) : ÷ (Division) : ^ (exponentiation) • When the function displayed in display A is the elapsed integration time (TIME), the computed result is displayed using the no data indication (------). • In division, if the value of the display B function is less than or equal to 0.0001% of the rated value, the computed value will be displayed as an error (“Error”). 4-10 IM WT310E-01EN...
- Page 65 Display C Wiring System P1–P3 Inverter Computation example 2: Display A Display B Display C Wiring System PΣ(=P1+P3) PΣ–P2 3P3W Inverter Index Computation example 3: Display A Display B Display C Wiring System PΣ(=P1+P3) P2–PΣ 3P3W Inverter IM WT310E-01EN 4-11...
- Page 66 A÷B : The result of dividing the value of display A by the square of the value of display B is displayed. When computing impedance (Z), resistance (R), or reactance (X) Computation example: Display A Display B Display C Wiring System S1 (VA) I1rms | Z | = (I1rms) P1 (W) I1rms (I1rms) Q1 (var) I1rms | X | = (I1rms) Power supply Load IM WT310E-01EN 4-12...
- Page 67 4.1 when “P” is replaced with “WP.” Note This computation function is only valid during integration (during integration or after integration has been aborted). If you reset integration, the watt hour and elapsed integration time values become zero, and the no Index data indication (------) is displayed. For details about integration, see chapter 5. IM WT310E-01EN 4-13...
- Page 68 • Efficiency: 0.000 to 99.999 to 100.00 to 999.99 (%) • Other computations (crest factor, basic arithmetic, and average active power): 99999 • Units • Average active power: The unit is W, but it does not appear on the display. • Efficiency: The unit is %, but it does not appear on the display. • Crest factor and four arithmetic operation: No unit • Unit Prefixes • Basic arithmetic and average active power: m, k, or M • Other computations (efficiency and crest factor): No prefix When the displayed function is set to MATH, there is no element indication. Pressing ELEMENT has no effect. IM WT310E-01EN 4-14...
-
Page 69: Setting The Max Hold Feature
U (voltage), I (current), P (active power), S (apparent power), Q (reactive power), U+pk and U-pk (peak voltage), I+pk and I-pk (peak current), and P+pk and P-pk (peak power) • on: The MAX HOLD indicator illuminates, and the MAX hold feature is enabled. • oFF: The MAX HOLD indicator turns off, and the MAX hold feature is disabled. Note The D/A output, communication output, and other values reflect the held maximum values. Index IM WT310E-01EN 4-15... -
Page 70: Setting The Number Of Displayed Digits
The default setting is Hi. • Hi: 5 digits are displayed (99999). • Lo: 4 digits are displayed (9999). Note • The actual number of displayed digits may be lower than the maximum number of displayed digits as a result of voltage and current range combinations and automatic digit increases. • The displays of the phase angle, integrated value, and elapsed integration time are not affected by the displayed digit setting in this section. Please see the various sections that explain these items. IM WT310E-01EN 4-16... -
Page 71: Chapter 5 Integration
00000:00:00, this instrument performs integration in manual integration mode. When you press START, integration starts, and it continues until you press STOP. However, if either of the conditions below is met, integration is stopped, and the integration time and integrated value are held. • The integration time reaches the maximum integration time (10000 hours). • The integrated value reaches its maximum or minimum displayable value. Hold Hold When the maximum integrated value is reached Index Hold Hold Start Stop Reset Start Reset IM WT310E-01EN... - Page 72 Stop. If either of the conditions below is met, integration is stopped, and the integration time and integrated value are held. • You press STOP. • The integrated value reaches its maximum or minimum displayable value. Hold Hold Timer Timer Timer value value value Start Stop Reset IM WT310E-01EN...
- Page 73 999999 counts when the unit is MWh or MAh. When the integrated value becomes large and reaches 100000 counts, the decimal point is automatically moved. For example, when 0.0001 mWh is added to 9.9999 mWh, the display switches to 10.000 mWh. Index IM WT310E-01EN...
- Page 74 Using an External Signal to Control Integration (Option) On models with the D/A output option (/DA4 or /DA12), you can use the remote control feature to use an external signal to start, stop, and reset integration. For information about the remote control feature, see section 5.2 in the Getting Started Guide, IM WT310E-02EN. IM WT310E-01EN...
-
Page 75: Setting The Integration Mode And Timer
• 0.00.01 to 10000.00.00: Set the integration time to a value within this range when the mode is standard integration mode or continuous integration mode. You can choose between standard integration mode and continuous integration mode in the integration mode menu. IM WT310E-01EN... -
Page 76: Displaying Integrated Values
Press the ELEMENT key for display C to select which element to display. The procedure for selecting an input element is the same as the procedure in section 4.1. The WT310E and WT310EH only have one input element, so there is no input element selection. Starting and Stopping Integration Press START. - Page 77 The number of digits in the displayed time varies as indicated below depending on the elapsed Index integration time. Elapsed Integration Time Display A Indication Display Resolution 0 to 99 h, 59 m, 59 s 0.00.00 to 99.59.59 100 h to 9999 h, 59 m, 59 s 100.00 to 9999.59 10000 h 10000 Note • For details about Wh, Wh±, Ah, and Ah±, see section 5.1. • For details about the average active power during integration, see section 4.5. • Regardless of the MAX hold feature, this instrument determines and displays the integrated value by summing the value that is measured at every data update interval. IM WT310E-01EN...
- Page 78 • When the integrated values reach their maximum value (999999 MWh/MAh) or minimum value (– 99999MWh/MAh), integration stops and the display of the integration results at that point in time is held. • When the elapsed integration time reaches the maximum integration time (10000 hours), integration is stopped and the display of the integration results at that point in time is held. • When integration overflow occurs, both the START and STOP keys illuminate. IM WT310E-01EN...
-
Page 79: Notes About Using Integration
HOLD SINGLE Displayed Index value (The dotted line is the integrated value.) Elapsed integration time START STOP RESET IM WT310E-01EN... - Page 80 Performing the above procedure when the function is on will turn it off. In this case, “OPT.01/OFF” appears. Checking the On/Off State of the Function From the menu select UTILITY(SHIFT+SETUP) →“inFo”→“VEr.” For details how to select from the menu, see section 8.1. If the function is on, display D shows “OPT.01.” IM WT310E-01EN 5-10...
-
Page 81: Chapter 6 Harmonic Measurement (Option)
For details, see section 2.6. Note When an irregular pulse waveform is applied, a steady range may not be maintained. If this occurs, use a fixed range. IM WT310E-01EN 5-11... - Page 82 DC or the lower frequency limit determined by the data update interval to approximately 45 kHz When the measurement mode is DC or the lower frequency limit determined by the data update VOLTAGE MEAN interval to approximately 45 kHz DC to 45 kHz When the measurement mode is DC IM WT310E-01EN 5-12...
-
Page 83: Harmonic Measurement Feature
: Shows the power factor of the fundamental wave (1st harmonic). : Shows the voltage frequency. : Shows the current frequency. THD V % : Shows the total harmonic distortion of voltage. THD A % : Shows the total harmonic distortion of current. IM WT310E-01EN... -
Page 84: Error Display
Over Range Indication Harmonic measurements do not have over range indication (---oL-) or indication for measured values that are too small. * See “Indications When the Measured Value Is Too Small” on page 1-12 in the Getting Started Guide, IM WT310E-02EN. Measurement Suspension/No Data Indication (Hyphens) Hyphens are displayed in the following circumstances. • When there is no analysis data to display during harmonic measurement data display • Immediately after the harmonic measurement data display is turned on... -
Page 85: Displaying Harmonic Measurement Data
Press ELEMENT to select which element to display. Index Each time you press ELEMENT, the input element changes in the order shown below. The WT310E and WT310EH only have one input element, so there is no input element selection. WT332E (2 input elements) - Page 86 Shows the phase angle of the harmonic voltage with respect to the fundamental voltage. A minus sign (–) appears in front of the value when the harmonic lags the 1st harmonic. The display range is –180.0 to 180.0°. • A°: • When display A is showing the 1st harmonic (fundamental) The same as V°. • When display A is showing a harmonic between 2 and 50 Shows the phase angle of the harmonic current with respect to the fundamental current. A minus sign (–) appears in front of the value when the harmonic lags the 1st harmonic. The display range is –180.0 to 180.0°. IM WT310E-01EN...
- Page 87 Source Element (WT332E/WT333E only) Set the input element that you want to display harmonic measurement data of. The element types that you can select vary depending on the model. Check your model when selecting. • 1/2/3: Shows the measured data of element 1, 2, or 3. Note If harmonic measurement data display is set to ON, the element display will not move to Σ even if you press ELEMENT. IM WT310E-01EN...
-
Page 88: Setting The Pll Source, Measured Harmonic Order, And Thd Equation
The default value is U1. Be sure to specify a signal with the same period as the harmonic measurement source waveform. Selecting an input signal with small distortion and fluctuation for the PLL source will enable stable harmonic measurement. • U1: The PLL source is set to the voltage of element 1. • I1: The PLL source is set to the current of element 1. • U2: The PLL source is set to the voltage of element 2 (WT333E only). • I2: The PLL source is set to the current of element 2 (WT333E only). • U3: The PLL source is set to the voltage of element 3 (WT332E and WT333E). • I3: The PLL source is set to the current of element 3 (WT332E and WT333E). IM WT310E-01EN... - Page 89 (1st harmonic) frequency. This is because the upper limit of harmonics that are computed varies depending on the fundamental frequency. The default value is 50. Example • Up to 50 when the fundamental frequency is 50 Hz • Up to 4 when the fundamental frequency is 1.2 kHz Note • When a harmonic order exceeding the upper limit is specified, display B shows hyphens (-----). • For details on the upper limit of measured harmonic order, see section 7.3 in the Getting Started Guide, IM WT310E-02EN. THD equation Select the THD equation from below. The default value is iEC. The following explanation is for when the upper limit of measured harmonic order is 50. If the upper limit is less than 50, computation is performed to the upper limit. • iEC: Computes the ratio of the rms value of the 2nd to 50th harmonic component to that of the fundamental (1st order). • CSA: Computes the ratio of the rms value of the 2nd to 50th harmonic component to that of the rms value of the 1st to 50th component.
-
Page 90: Chapter 7 Storing Measured Data And Saving And Loading Setup Parameters
If the harmonic data display is set to ON (see section 6.2) on a model with the harmonic measurement option, all measured data, computed data, integrated data, and frequencies (voltage and current) including those of harmonic measurement are stored. IM WT310E-01EN... - Page 91 • When the storage setting is set to oFF (while storage is in progress) Note • Measured data that has been stored cannot be recalled on the screen of this instrument. • Measured data that has been stored can be transmitted to a PC through the communication feature. You can view the data on the PC. For details, see the Communication Interface User’s Manual, IM WT310E- 17EN. Storage Interval Set the time interval for repeating the storage operation. The default value is00.00.00.
-
Page 92: Saving And Loading Setup Parameters
• Saved setup parameters are retained by a lithium battery. For information on the service life of the lithium battery, see section 5.3 in the Getting Started Guide, IM WT310E-02EN. Loading Setup Parameters You can load setup parameters that have been saved to restore the settings. This instrument is configured according to the loaded setup parameters. After the settings are loaded, this instrument starts measuring. IM WT310E-01EN... -
Page 93: Chapter 8 Other Features
You can display the following information about this instrument. Item Meaning Model Model Suff.1 Suffix code Suff.2 The rest of the suffix code Instrument number Ver. Firmware version For details on models and suffix codes, see page ii in the Getting Started Guide, IM WT310E-02EN. Index IM WT310E-01EN... -
Page 94: Initializing The Settings
Display function: W, element: 1 Display D Display function: PF, element: 1 Hi (5 digits) Number of displayed digits 0.25 s Data update interval When set to Synchronization source WT310E/WT310EH: U1 Auto WT332E/WT333E: I1 Timeout: 1s Line filter Frequency filter WT310E/WT310EH: VoLt (voltage) Measurement synchronization source WT332E/WT333E: Curr (current) - Page 95 If you turn on the power while holding down SET, this instrument will start up with the default settings. Continue holding SET until after all the LEDs have lit and turned off (part 2 under “Power-on Messages” on page 2-10 in the Getting Started Guide, IM WT310E-02EN). All of the setup parameters, Index including the communication settings, will be initialized.
-
Page 96: Performing Zero-Level Compensation
It must be performed to meet the specifications of this instrument (see chapter 7 in the Getting Started Guide, IM WT310E-02EN). Zero-level compensation is automatically performed when you change the measurement range. -
Page 97: Configuring D/A Output Items (Option)
B. Press to select an element (you cannot select an element for 1 The number of channels varies depending on the specific option that is installed. • /DA4 option on the WT310E/WT310EH: 4 channels • /DA12 option on the WT332E/WT333E: 12 channels 2 When you press SET in step 11, the output channel shown in display B changes to the next channel. For example, ch1 changes to ch2. -
Page 98: Output Format
Select one of the default settings to output preconfigured (default) items. Default Values for Normal Measurement: dFLt-n Select this setting to output normal measurement values. The output settings are as follows: Suffix Code /DA4 /DA12 Product Name WT310E WT332E WT333E WT310EH Output channel ch1 UΣ... - Page 99 8.4 Configuring D/A Output Items (Option) Default Values for Integration: dFLt-i Select this setting to output integrated values. The output settings are as follows: Suffix code /DA4 /DA12 Product Name WT310E WT332E WT333E WT310EH Output channel ch1 PΣ PΣ WPΣ...
- Page 100 You can set this feature by sending communication commands through the communication interface. You cannot set this feature from the display menu of this instrument. For details, see the Communication Interface User’s Manual, IM WT310E-17EN. Fixed (Fixed range mode) When a measurement function’s rated value is received, +5 V is output. For details, see “Relationship between Output Items and the D/A Output Voltage” on page 8-10.
- Page 101 Maximum and Minimum Values in Manual Range Mode and Comparison Upper and Lower Limits in Comparator Mode You can select a value between -9.999E+12 and 9.999E+12. The default settings are shown below. Manual Range Mode Maximum Value 100.0 Minimum Value -100.0 Comparator Mode Comparison Upper Limit 100.0 Comparison Lower Limit -100.0 Index IM WT310E-01EN...
- Page 102 –100 Displayed value (%) –5.0 V –100% Approx. - 7.0 V –140% –5.0V Approx. –7.0 V Approx. –7.5 V • The range between +5 to +7 V and –5 to –7 V is not output for λ and Φ. When an error occurs, the output is approximately ±7.5 V. • For the efficiency math function, +5 V represents 100%. • For Upk and Ipk, ±5 V represents the application of 3 times the rated range value (6 times the rated range value when the crest factor is 6 or 6A). • When the selected output function is “----” or there is no numerical data, the output is 0 V. IM WT310E-01EN 8-10...
-
Page 103: Enabling Key Protection
In the key protected condition, press SHIFT+INTERFACE (KEY PROTECT). The KEY PROTECT indicator turns off, and all keys are enabled. Explanation Key Protection You can disable (lock) the front panel keys. The following switch and key are exceptions. • Power switch • KEY PROTECT (to disable key lock) Index IM WT310E-01EN 8-11... -
Page 104: Carrying Out Self-Tests (Selftest)
The display changes in this order. End test. Close menu. Panel Key Test Execute self-test. (Display B) Test item (Display C) Execute test. Pressing a key causes the corresponding number to appear. Close menu. Press SHIFT twice to end the test. IM WT310E-01EN 8-12... - Page 105 Test item (Display C) Execute test. Pressing the keys causes the LED to illuminate one by one. End test. Close menu. Ending a Test Execute self-test. (Display B) Test item Index (Display C) End test. Close menu. IM WT310E-01EN 8-13...
- Page 106 LEDs turn on and off one by one. • To exit from the LED test, press SHIFT. Ending the Self-Test (End) The self-test ends. If an Error Occurs during a Self-Test If any of the tests fail after trying them a few times, contact your nearest YOKOGAWA dealer. IM WT310E-01EN 8-14...
-
Page 107: Appendix
Voltage crest factor: CfU Voltage crest factor CfU = Current crest factor CfI = Current crest factor: CfI Urms Irms Upk= |U+pk| or |U-pk|, Ipk = |I+pk| or |I-pk|, whichever is larger whichever is larger (Continued on next page) IM WT310E-01EN App-1... - Page 108 • The numbers 1, 2, and 3 used in the equations for UΣ, IΣ, PΣ, SΣ, QΣ, WPΣ, and qΣ indicate the case when input elements 1, 2, and 3 are set to the wiring system shown in the table. IM WT310E-01EN App-2...
- Page 109 Therefore, for distorted signal input, the value obtained on this instrument may differ from that obtained on other instruments that use a different method. • For Q, when the current leads the voltage, the Q value is displayed as a negative value; when the current lags the voltage, the Q value is displayed as a positive value. The value of QΣ may be negative, because it is calculated from the Q of each element with the signs included. Index IM WT310E-01EN App-3...
- Page 110 Fundamental frequency of the voltage or current set as the PLL source fU, fI [Hz] (Continued on next page) Note • k denotes a harmonic order, r denotes the real part, and j denotes the imaginary part. • U(k), Ur(k), Uj(k), I(k), Ir(k), and Ij(k) are expressed using rms values. • The upper limit of measured harmonic order is denoted by max. max is either an automatically determined value or the specified maximum measured harmonic order, whichever is smaller. • Harmonic measurement functions are measured only for input elements, not Σ functions. IM WT310E-01EN App-4...
- Page 111 Ithd [%] • • I(Total)* I(1) U(Total) = I(Total) = P(Total) = k = 1 k = 1 k = 1 Note • k denotes a harmonic order. • The upper limit of measured harmonic order is denoted by max. max is either an automatically determined value or the specified maximum measured harmonic order, whichever is smaller. Index IM WT310E-01EN App-5...
-
Page 112: Appendix 2 Power Basics (Power, Harmonics, And Ac Rlc Circuits)
With I as the DC value that produces the same thermal action as the alternating current: 2π ω The mean of i over one period = 2π Because this value corresponds to the root mean square of the instantaneous values over 1 period, the effective value is normally denoted using the abbreviation “rms.” IM WT310E-01EN App-6... - Page 113 Normally, a dot is placed above the symbol representing a quantity to explicitly indicate that it is a vector. The magnitude of a vector represents the rms value. When the current leads the voltage When the current lags the voltage Φ IM WT310E-01EN App-7...
- Page 114 (the two-wattmeter method). If the magnitude of each phase voltage is equal and each phase is offset by 120°, the magnitude of the line voltage is times the magnitude of the phase voltage, and the line voltage phase is offset by 30°. Below is a vector representation of the relationship between the phase voltages and line currents of a three-phase AC voltage when the current lags the voltage by Φ°. Φ Φ Φ IM WT310E-01EN App-8...
- Page 115 P = UIcosΦ π ωt 2π Negative Φ power When phase difference π between voltage and current is 2 Average power π π P = UIcos ωt π 2π The positive and negative powers are the same. IM WT310E-01EN App-9...
- Page 116 Reactive Power If current I lags voltage U by Φ, current I can be broken down into a component in the same direction as voltage U, IcosΦ, and a perpendicular component, IsinΦ. Active power P, which is equal to UIcosΦ, is the product of voltage U and the current component IcosΦ. The product of voltage U and the current component IsinΦ is called the reactive power. It is expressed as Q. The unit of reactive power is the var. Q = UIsin Φ [var] Isin Φ Icos Φ Φ The relationship between S, the apparent power, P, the active power, and Q, the reactive power is as follows: = P IM WT310E-01EN App-10...
- Page 117 The electromagnetic induction caused by harmonics creates noise voltage. • Control devices Harmonic distortion of control signals can lead to erroneous operation. • Audio visual devices Harmonics can cause degradation of performance and service life, noise-related video flickering, and damaged parts. IM WT310E-01EN App-11...
- Page 118 When the polarity of the voltage changes, the largest charging current with the same polarity as the voltage flows through the capacitor. When the voltage decreases, discharge current with the opposite polarity of the voltage flows. Thus, the current phase leads the voltage. π π IM WT310E-01EN App-12...
- Page 119 The equations below express the current relationships when resistance R [Ω], inductance L [H], and capacitance C [F] are connected in parallel. I = (I + (I – I – – Φ = tan – 1 Index Φ The relationship between resistance R , reactance X , and impedance Z is expressed by the equations below. – X + XP IM WT310E-01EN App-13...
-
Page 120: Appendix 3 Power Range
75.000 mW 150.00 mW 375.00 mW 750.00 mW 1.5000 W 75.000 mW 150.00 mW 750.00 mW 1.5000 W 30.000 300.00 mW 3.0000 W 75.000 187.50 mW 375.00 mW 750.00 mW 1.8750 W 3.7500 W 7.5000 W 150.00 375.00 mW 750.00 mW 1.5000 W 3.7500 W 7.5000 W 15.000 W 750.00 mW 1.5000 W 7.5000 W 15.000 W 300.00 3.0000 W 30.000 W IM WT310E-01EN App-14... - Page 121 300.00 W 15.000 W 75.000 W 150.00 W 30.000 30.000 W 300.00 W 600.00 W 75.000 37.500 W 75.000 W 187.50 W 375.00 W 750.00 W 1.5000 kW 150.00 75.000 W 150.00 W 375.00 W 750.00 W 1.5000 kW 3.0000 kW 150.00 W 750.00 W 1.5000 kW 300.00 300.00 W 3.0000 kW 6.0000 kW Index IM WT310E-01EN App-15...
- Page 122 45.000 W 112.50 W 225.00 W 450.00 W (3P4W) 22.500 W 45.000 W 225.00 W 450.00 W 30.000 90.000 W 900.00 W 75.000 56.250 W 112.50 W 225.00 W 562.50 W 1.1250 kW 2.2500 kW 150.00 112.50 W 225.00 W 450.00 W 1.1250 kW 2.2500 kW 4.5000 kW 225.00 W 450.00 W 2.2500 kW 4.5000 kW 300.00 900.00 W 9.0000 kW IM WT310E-01EN App-16...
-
Page 123: Appendix 4 Setting The Measurement Period
For example, if a switching power supply is being measured and the voltage waveform distortion is smaller than the current waveform distortion, set the synchronization source to the voltage signal. Voltage waveform Index Synchronization source set to the voltage signal Current waveform IM WT310E-01EN App-17... - Page 124 Also, the period cannot be detected if the AC amplitude is small. For information on the detectable frequency levels, see the conditions listed under “Accuracy” under “Frequency Measurement” in section 7.4, “Features,” in the Getting Started Guide, IM WT310E-02EN. If the synchronization is set to voltage and this instrument cannot detect the voltage period, it will detect and use the current period.
- Page 125 Set the synchronization source according to the signal under measurement and the measurement objective. * See the conditions listed under “Accuracy” under “Frequency Measurement” in section 7.4, “Features,” in the Getting Started Guide, IM WT310E-02EN. IM WT310E-01EN App-19...
- Page 126 Appendix 4 Setting the Measurement Period Data update interval Data update interval Measurement period Measurement Synchronization period source OFF Unintended zero crossing caused by pulse noise IM WT310E-01EN App-20...
-
Page 127: Appendix 5 Measurement Accuracy And Measurement Error
• Range error: 1 [A]×0.05% = 0.0005 [A] The error included in 1.0000 [A] is the sum of the reading and range errors, which is ±0.0015 [A]. This corresponds to 0.15% of the displayed value. Note Application of an input signal whose value is the same as the name of the measurement range is referred to as rated range input. And, such input signals are called rated range signals. IM WT310E-01EN App-21... - Page 128 • Current measurement range: 1A, measured current: 0.800 A • Measured power: 80.00 W • 60 Hz sine wave for both voltage and current • Phase difference between the voltage and current signals = 0° Power Range The power measurement range is defined as voltage measurement range × current measurement range. In this example, the power measurement range is 150 V×1 A = 150 W. We use this power measurement range to calculate the range error. The reading error and range error included in the measured power (80.00 W) are as follows: • Reading error: 80.00 [W]×0.1% = 0.08 [W] • Range error: 150 [W]×0.05% = 0.075 [W] The error included in 80.00 [W] is the sum of the reading and range errors, which is ±0.155 [W]. This corresponds to 0.19375% of the displayed value. IM WT310E-01EN App-22...
- Page 129 When the Power Factor Is Greater Than 0 but Less Than 1 As an example, let us calculate the error for when the power factor is 0.5, or in other words, when the phase difference between the voltage and current (Φ) is 60°. • Voltage measurement range: 150 V, measured voltage: 100.00 V • Current measurement range: 1A, measured current: 0.800 A • Power measurement range: 150 W, measured power: 40.00 W, measured apparent power: 80.00 VA, measured reactive power: 69.28 var When 0 < λ < 1, the power error on this instrument is defined as follows: (Power reading) × [(power reading error %) + (power range error %) × (power range/indicated apparent power value) + {tan Φ × (influence when λ = 0)%}], If we substitute the above value into this equation, the power error becomes as follows: 40.00 [W] × [ 0.1% + 0.05% × (150/80.00) + {tan60° × (influence (%) when λ = 0)}] = 40.00 [W] × {0.1 + 0.05 × (150/80.00) + √3 × 0.1}% = 0.1468 [W] The error in the measured power (40.00 W) is ±0.1468 [W]. Index IM WT310E-01EN App-23...
- Page 130 (3P3W) column. Voltage and Current Three-phase voltage (UΣ) measurement range = (U1 measurement range + U3 measurement range)/2 = (150 + 150)/2 = 150 Three-phase current (IΣ) measurement range = (I1 measurement range + I3 measurement range)/2 = (1 + 1)/2 = 1 The reading error and range error included in the measured three-phase voltage (UΣ; 100.00 V) are as follows: • Reading error: 100.00 [V]×0.1% = 0.1 [V] • Range error: 150 [V]×0.05% = 0.075 [V] The error included in 100.00 [V] is the sum of the reading and range errors, which is ±0.175 [V]. This corresponds to 0.175% of the displayed value. Because the measured values of U1 and U3 are the same, UΣ also has the same error. The same calculation method applies for the currents. Power Referring to the table of Σ function equations on page App-2, the power range is as follows: Three-phase power (PΣ) measurement range = P1 measurement range + P3 measurement range = (U1 measurement range × I1 measurement range) + (U3 measurement range × I3 measurement range) = (150 × 1) + (150 × 1) = 300 The reading error and range error included in the measured three-phase power (PΣ; 138.56 W) are as follows: • Reading error: 138.56 [W]×0.1% = 0.13856 [W] • Range error: 300 [W]×0.05% = 0.15 [W] The error included in 138.56 [W] is the sum of the reading and range errors, which is ±0.28856 [W]. This corresponds to approximately 0.208% of the displayed value. IM WT310E-01EN App-24...
- Page 131 For example, let us consider the measured results of two voltmeters when 1.00 V is measured three times. Voltmeter A Voltmeter B 1st measurement 1.02 V 1.04 V 2nd measurement 1.00 V 1.05 V 3rd measurement 0.98 V 1.06 V Voltmeter A measurements are closer to the true value (1.00 V). So we can say that voltmeter A is more accurate than voltmeter B. On the other hand, the three voltmeter B measurements are closer to each other than those of voltmeter A. So we can say that voltmeter B is more precise than voltmeter A. Measurement Error A measurement error is the difference between the actual measurement and the true value. Index IM WT310E-01EN App-25...
-
Page 132: Appendix 6 Menu Transition Diagram
Appendix 6 Menu Transition Diagram This section shows the characters on the 7-segment LED using their corresponding alphabet and numbers. SETUP Menu (WT310E/WT310EH, 1/2) Measurement display Press HOLD (ESC) while the menu is displayed to return to the measurement display. - Page 133 Appendix 6 Menu Transition Diagram SETUP Menu (WT310E/WT310EH, 2/2) Frequency filter Data update interval* Averaging MATH function To SCALE on To L.FiLt on the previous the previous page page (Not Auto) (oN/oFF) × ÷ (Auto) (tYPE) ÷ ÷ * If the data update interval is...
- Page 134 Press HOLD (ESC) while the menu is displayed to return to the measurement display. Sensor conversion ratio Scaling (option) Measurement period Line filter To F.FiLt on the next page (oN/oFF) (dAta) (ALL) (EACH) (ELEMENT1) (ELEMENT2) (ELEMENT3) Set ELEMENT1, 2, 3 (End) (ALL) (EL1,EL2,EL3) Set V, C, and F. IM WT310E-01EN App-28...
- Page 135 (Not Auto) (oN/oFF) (WT333E) (WT333E) (Auto) (tYPE) × ÷ ÷ ÷ (WT333E) * If the data update interval is set to Auto, Timeout and SyncSource are shown in Display D. Index 1: WT333E 2: WT332E/WT333E IM WT310E-01EN App-29...
- Page 136 Set h, M, and S. HARMONICS Menu (Option) Measurement display Press HOLD (ESC) while the menu is displayed to return to the measurement display. Measured harmonic order Display PLL source THD equation 1 to 50 1: WT333E 2: WT332E/WT333E IM WT310E-01EN App-30...
- Page 137 Press HOLD (ESC) while the menu is displayed to return to the measurement display. GP-IB or RS-232 comes standard. Ethernet GP-IB RS-232 (option) Command mode Index Instrument IP address number UTILITY menu to set it Handshaking Format Baud rate Terminator IM WT310E-01EN App-31...
- Page 138 Press HOLD (ESC) while the menu is displayed to return to the measurement display. Number of displayed digits System information Initialization Crest factor To StorE on the next page (no) (YES) Suffix code (1/2) Suffix code (2/2) Instrument number Firmware version IM WT310E-01EN App-32...
- Page 139 MEMory, PAnEL, or LEd is met. (ConFiG) (iP.AdrS,MASK,GAtE) (End) (ch) Index (bind) A Press SET on the bind menu to return to A. B Press SET on a menu other than the bind menu to return to B. IM WT310E-01EN App-33...
-
Page 140: Appendix 7 Block Diagram
Isolator Zero ± crossing Detector D/A output External current 500Hz (option) sensor input Peak Detector (EXT, option) WT310E current input (CURRENT INPUT) Current input circuit CURRENT Current input Isolator Zero crossing Detector 500 Hz ± Peak Detector External current sensor input... - Page 141 A/D converter is converted to digital values at a sampling frequency that is determined by the PLL source signal. The CPU derives the measured value of each harmonic measurement item by performing an FFT on the converted digital values. Index IM WT310E-01EN App-35...
- Page 142 ............... 1-7, 2-6 power .................. App-6 form factor ................App-7 power coefficient ............1-9, 2-14 frequency ................4-5 power factor ................4-3 frequency filter ............. 1-11, 2-19 power factor error ............. App-23 power factor influence ............App-23 power range............1-8, 2-8, App-22 IM WT310E-01EN Index-1...
- Page 143 ..................4-1 voltage mean ................1-5 VOLTAGE MEAN ..............2-1 voltage range ................2-4 voltage transformer............... 2-13 VT ratio ................1-9, 2-14 Page watt hour ................1-15 wiring systems ............1-4, 1-6, 2-3 wiring unit ................1-4 WTViewerFreePlus ............... 1-19 Index-2 IM WT310E-01EN...
Need help?
Do you have a question about the WT310E and is the answer not in the manual?
Questions and answers