Dranetz hdpq xplorer User Manual
Hide thumbs
Also See for hdpq xplorer:
- User manual (306 pages) ,
- Datasheet (27 pages) ,
- Firmware update instructions (7 pages)

Related Manuals for Dranetz hdpq xplorer


Summary of Contents for Dranetz hdpq xplorer
- Page 1 USER GUIDE PowerMeterStore 1.877.766.5412 www. .com Shop for Power Metering products online at:...
- Page 2 No part of this book may be reproduced, stored in a retrieval system, or transcribed in any form or by any means—electronic, mechanical, photocopying, recording, or otherwise—without prior written permission from the publisher, Dranetz, Edison, NJ 08818-4019. Printed in the United States of America. P/N UG-HDPQ Rev. B PowerMeterStore 1.877.766.5412...
- Page 3 ADVERTENCIA na conexión incorrecta de este instrumento puede producir la muerte, lesiones graves y riesgo de incendio. Lea y entienda este manual antes de conectar. Observe todas las instrucciones de instalación y operación durante el uso de este instrumento. La conexión de este instrumento a un sistema eléctrico se debe realizar en conformidad con el Código Eléctrico Nacional (ANSI/NFPA 70-2014) de los E.E.U.U., además de cualquier otra norma de seguridad correspondiente a su establecimiento.
-
Page 4: Safety Summary
Safety Summary WARNING statements inform the user that certain conditions or practices could result Definitions in loss of life or physical harm. CAUTION statements identify conditions or practices that could harm the HDPQ Xplorer, its data, other equipment, or property. NOTE statements call attention to specific information. - Page 5 WARNUNGEN informieren den Benutzer darüber, daß bestimmte Bedingungen oder Definitionen Vorgehensweisen körperliche oder tödliche Verletzungen zur Folge haben können. VORSICHTSHINWEISE kennzeichnen Bedingungen oder Vorgehensweisen, die zu einer Beschädigung von HDPQ Xplorer, seiner Daten oder anderer Geräte bzw. von Eigentum führen können. HINWEISE machen auf bestimmte Informationen aufmerksam. Symbole Die folgenden Symbole der Internationalen Elektrotechnischen Kommission (International Electrotechnical Commission;...
- Page 6 DO NOT install any connection of the HDPQ Xplorer to live power lines. • Connections must be made to the HDPQ Xplorer first, then connect to the circuit to be monitored. • If the equipment is used in a manner not specified in this User Guide, the protection provided by the equipment may be impaired.
-
Page 7: Statements And Notices
User replaceable instrument batteries are warranted for a period of one year from the date of invoice. Certain Dranetz branded accessories, such as current transformers and other accessories not manufactured by Dranetz, are warranted to the original purchaser against defective material and workmanship for a period of one year from the date of invoice. - Page 8 Dranetz, 1000 New Durham Road, Edison, New Jersey 08818. Copyright © 2014 Dranetz All Rights Reserved.
-
Page 9: Table Of Contents
Statements and Notices......................CHAPTER 1 - Getting Started Overview ..........................Unpacking the HDPQ Xplorer ....................Standard Accessories......................HDPQ Xplorer Controls, Indicators, and Connectors ............Top View......................... Left Side View ........................ Right Side View ......................Front View ........................Rear View ........................ - Page 10 Table of Contents, Continued Advanced Meter Tab ......................3-10 Advanced Demand & Energy Meter Tab ................3-11 Advanced Flicker Meter Tab....................3-14 Section C -Scope Mode........................ 3-15 Overview ..........................3-15 Turning Channels On/Off...................... 3-16 Viewing Plots - Stacked/Overlay ..................3-17 Checking Input Range ......................
- Page 11 Overview ..........................Time and Date Settings......................Select Language........................Communications Options ...................... Set Up the HDPQ Xplorer for Wireless (WiFi) Connectivity..........5-15 Set Up the HDPQ Xplorer for Bluetooth Connectivity............5-19 Download Data Remotely via Network, WiFi & Bluetooth PAN ........
- Page 12 Table of Contents, Continued Event Plot - RMS........................6-22 Event Waveform........................6-28 Section C -Reports ........................6-34 Overview ..........................6-34 Voltage Compliance Report ....................6-35 Compliance History....................... 6-37 Compliance Summary ......................6-39 EN50160 Compliance Limits (Default) ................6-43 Event Satistics........................6-46 Min/Max Table for Power Frequency and RMS Voltage .............
- Page 13 Table of Contents, Continued APPENDIX E - Common Circuit Connections Overview ..........................Verifying Voltage and Current Connections ................. Interconnect Jumpers......................Single Phase........................... Split Phase ..........................3 Phase, Four Wire Wye......................E-10 3 Phase (Floating or Grounded) Delta................... E-11 3 Phase 2-Watt Delta ......................E-12 Generic Circuit ........................
- Page 14 ® Dranetz HDPQ Xplorer PowerMeterStore 1.877.766.5412 www. .com Shop for Power Metering products online at:...
-
Page 15: Chapter 1 - Getting Started
NOTE: This User Guide provides information on the features and functionalities for Dranetz model HDPQ Xplorer. Functionalities of other product models are each specified in its own user guide. For inquiries contact the Dranetz Customer Service Department at (732) 287-3680 or 1-800-372-6832. - Page 16 Compatible with devices such as Smartphone or equivalent devices with small, typically 3” to 4" display. The capabilities are based on various “apps” that the user can download from the Dranetz web site, like viewing real time and stored data in a format compatible with smaller display.
-
Page 17: Unpacking The Hdpq Xplorer
DO NOT return the HDPQ Xplorer without prior instructions from Dranetz Customer Service Department. Dranetz Customer Service Department can be reached at (732) 287-3680 or 1-800-372-6832. If the unit must be returned to Dranetz for service or repair, wrap the unit securely in Repacking for return shipment heavy packaging material and place in a well padded box or crate to prevent damage. -
Page 18: Standard Accessories
FAX: (732) 248-1834 Fill out the Repair/Service Order form enclosed in the shipping carton and ship it along with the unit to the Dranetz Repair Department. (If this form is missing, ask the Dranetz Customer Service Department for a replacement.) PowerMeterStore 1.877.766.5412... -
Page 19: Hdpq Xplorer Controls, Indicators, And Connectors
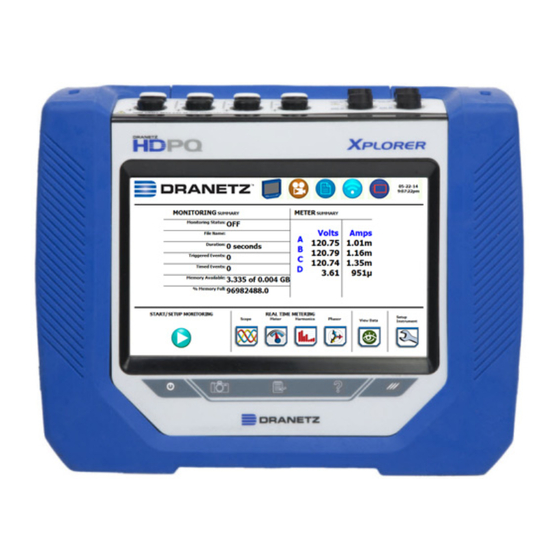
7” (diagonal) WVGA wide screen display and measuring 2.75" (7.00 cm) deep by 10" (25.4 cm) wide by 8" (20.3 cm) high. This section identifies and describes the controls, indicators, and connectors on all sides of the HDPQ Xplorer, shown with rubber boot installed. -
Page 20: Top View
HDPQ Xplorer Controls, Indicators, and Connectors, continued The top (circuit connection) view features the input voltage and current connectors. See Top view below for description of the top connectors. Parts table Part Function CH A, + Differential Voltage Input Connector; color black. -
Page 21: Left Side View
CH 1/ Getting Started The left side contains the power switch, GPS receiver port and AC adapter input Left side view connector. See below for descriptions of the left side connectors. PowerMeterStore 1.877.766.5412 www. .com Shop for Power Metering products online at:... -
Page 22: Right Side View
HDPQ Xplorer Controls, Indicators, and Connectors, continued The right side contains the ethernet port and the two USB port connectors for the USB Right side view flash drive and the USB cable for plug & play file transfer directly to a computer. See below for description of the right side connectors. -
Page 23: Front View
NOTE 3: Touch Icons. The three touch icons are used to perform various functions i.e. take a Snapshot of the active screen, capture Mini-Reports and access Help screens. See section HDPQ Xplorer Touch Icons for detailed desccriptions. These icons cannot be activated with gloves on as they employ capacitive or touch technology. -
Page 24: Rear View
Note if you do not want to hang the instrument on a panel, the hanger bracket is replaceable with the Dranetz-supplied accessory Keyhole Mounting Kit (P/N 118313-G1). This kit allows you to mount the instrument on the wall or install it in the optional weather resistance enclosure. -
Page 25: Keyhole Mounting Procedure
Keyhole mounting kit your purchase of the HDPQ Xplorer, Guide, or Visa, and can be used to replace the mounting hanger bracket. Instead of hanging the instrument on a panel, you can use the kit to have the instrument wall mounted or installed in the optional Weather Resistant Enclosure (P/N ENCL-HDPQ). -
Page 26: Upgrading Firmware
Illustration below shows the high level process for updating firmware: • Download the latest firmware update release from the Dranetz website into the root directory of a USB flash drive. • Once the firmware file is copied, insert the USB flash drive into the USB connector on the right panel of the instrument. - Page 27 CH 1/ Getting Started HDPQ Xplorer firmware upgrade Refer to Chapter 5 Instrument Settings > Update Firmware for the (continued) detailed steps on how to upgrade firmware. HDPQ-514 1-13 PowerMeterStore 1.877.766.5412 www. .com Shop for Power Metering products online at:...
-
Page 28: Hdpq Xplorer Ui Touchscreen Features
HDPQ Xplorer UI Touchscreen Features HDPQ Xplorer UI Touchscreen Features All HDPQ Xplorer screen functions are operable using the color LCD touch screen Touchscreen functions display. Use your finger and/or a stylus to apply light pressure to the LCD screen to result in touch screen recognition. -
Page 29: Taskbar Icons
The shortcut buttons include Start Monitoring, Real Time Data, Recorded Data and Instrument Setup. Repeated pressing of the Dranetz logo alternately displays the Home page and the Home Monitoring page. Start/Stop... - Page 30 HDPQ Xplorer UI Touchscreen Features, continued Instrument Real-time Data • Text Display Meters - Meter mode also functions as a true rms control functions (cont.) voltmeter, a true rms ammeter, and a watt meter. Voltage, (continued) current, power measurements, along with hundreds of other calculated and advanced power and power quality parameters, are displayed on the meter screens in textual/tabular format.
- Page 31 CH 1/ Getting Started Instrument Recorded Data Recorded Data displays captured information in either graphic or control functions textual form, including events and trends, along with voltage (continued) compliance and mini-reports. These include both trended data and events generated from user programmed triggers or thresholds. One instance of this can be invoked while another screen is open and will return to prior screen upon exit.
-
Page 32: Monitoring Status Functions
HDPQ Xplorer UI Touchscreen Features, continued Monitoring status presents the current status of the instrument such as monitoring on/ Monitoring status functions off, errors/warnings, etc. These functions invoke pop-up windows and return to the prior screen upon exit. Instrument This window displays status information about the instrument,... -
Page 33: Housekeeping Functions
Press Setup Instrument to configure the instrument’s Wireless Options (WiFi) and Bluetooth communications options. The Xplorer requires the addition of a Dranetz supplied Bluetooth external adapter in order to connect to a wireless-enabled device using the Bluetooth networking mode. The Bluetooth interface uses a PAN network that is only available on PC based devices. - Page 34 HDPQ Xplorer UI Touchscreen Features, continued Housekeeping functions Battery / Power Displays battery charge status when powered externally. Displays (continued) Supply Status battery percent charge remaining when operating from internal battery as well as charging level if power supply is plugged in to a valid AC source.
-
Page 35: General Navigation Functions
CH 1/ Getting Started General navigation screens include the numeric and alphanumeric keypads. General navigation functions Numeric Features numeric keypad window for multiple uses. Press a Keypad numeric entry field to display the numeric keypad. This keypad also appears automatically when you press a screen that requires numeric entry. -
Page 36: Hdpq Xplorer Touch Icon Buttons
HDPQ Xplorer Touch Icon Buttons HDPQ Xplorer Touch Icon Buttons There are three touch icons located below the LCD screen - Snapshot, Mini-Report Touch icon functions Capture and Help. The icon buttons allow you to perform functions specific to the... -
Page 37: Basic Operation
Introduction Adapter/Battery Charger is used to charge the battery. Always charge the battery fully before use. HDPQ Xplorer will always operate on the charger and is designed to do so, regardless of the state of charge of the battery. Type: Sealed, rechargeable NiMH (Nickel Metal Hydride) cells. -
Page 38: Power-On Sequence
Basic Operation, continued Follow these steps to turn on the HDPQ Xplorer and display the Home page. Power-on sequence Step Action Connect the AC adapter/battery charger plug into the left side of the instrument. Plug the AC adapter into an AC power source. -
Page 39: Home Start-Up Page
You can also load previously saved setups or previously saved data from memory. Setup is a configuration of parameter thresholds that control the data recorded by HDPQ Xplorer. See Chapter 4 Setup Monitoring. Real-Time Data - Displays voltage and current measurements, along with other calculated parameters in different modes. - Page 40 This page intentionally left blank. 1-26 PowerMeterStore 1.877.766.5412 www. .com Shop for Power Metering products online at:...
-
Page 41: Chapter 2 - Voltage Measurement Cable And Current Probe Connections
C H A P T E R Voltage Measurement Cable and Current Probe Connections Overview This section describes how to connect the HDPQ Xplorer to make basic single phase Introduction voltage measurements. For multi-phase connection diagrams, refer to Appendix E. - Page 42 Overview, continued ADVERTENCIA Una conexión incorrecta de este instrumento puede producir la muerte, lesiones graves y riesgo de incendio. Lea y entienda este manual antes de conectar. Observe todas las instrucciones de instalación y operación durante el uso de este instrumento.
- Page 43 DO NOT install any connection of the HDPQ Xplorer to live power lines. • Connections must be made to the HDPQ Xplorer first, then connect to the circuit to be monitored. • If the equipment is used in a manner not specified in this User Guide, the protection provided by the equipment may be impaired.
-
Page 44: Connecting Voltage Measurement Cables
Optional fused voltage adapter measurement cables for the HDPQ Xplorer. A single kit (P/N FVA-1K1) contains one (1) fuse voltage adapter and one (1) black measurement connecting cable 50 cm in length. The other kit (P/N FVA-1K4) contains four (4) fuse voltage adapters and four (4) black measurement connecting cables 50 cm in length. - Page 45 CH 2/ Voltage Measurement Cables and Current Probe Connections • WMV-KIT (118376-G1) wire marker kit is included with the standard measurement Wire markers (continued) cable set and is used for identifying voltage cables. • WMI-KIT (118377-G1) wire marker kit is included with the standard measurement cable set and is used for identifying current probes.
- Page 46 Refer condition to a qualified technician. Contact Dranetz Customer Service for more information on the fused voltage adapter. Refer to Dranetz Information Sheet titled Fuse Voltage Adapter 1000V AC/DC FVA- 1K1 &...
- Page 47 CH 2/ Voltage Measurement Cables and Current Probe Connections Follow these guidelines when making voltage connections. Connection guidelines • Refer to the measurement cable set figure for probes that connect to input channel connectors A, B, C, and D. • Each channel input has plus (+) and minus (-) differential inputs of 1 to 1000 Vrms max.
- Page 48 Connecting Voltage Measurement Cables, continued The following figure shows a voltage connection using channel D as a differential input Example: Neutral to for measuring neutral to ground voltage or other applications. Connections are identical ground for split phase and wye configurations. One probe connects the source neutral line to connection the D+ input.
- Page 49 CH 2/ Voltage Measurement Cables and Current Probe Connections The following safety precautions apply to current probe connections in addition to Safety precautions those safety precautions stated on page 2-3. • DO NOT attempt to measure current in any circuit in which the circuit to ground voltage exceeds the insulation rating of the current probe (see Appendix B Technical Specifications - Current Probes for ratings of current probes).
-
Page 50: Connecting Current Probes
Connecting Current Probes Connecting Current Probes Several Dranetz current probes can be used with the HDPQ Xplorer. Actual photos of Current probes typical probes compatible with the HDPQ Xplorer - TR (B Series) probes, PR (B Series) probes, DRANFLEX (XLB and MHB Series) - are illustrated in the next pages, with corresponding part numbers and descriptions. - Page 51 Note all the typical probes described below and in the next pages have Hypertronics connectors that plug directly into the current inputs of the HDPQ Xplorer without any cable adapter. Contact Dranetz Customer Service Department for information on pricing and availability.
- Page 52 Actual photo of PR (B Series) probe is shown below as aid in probe identification. PR (B Series) current probes PR150/SP1B and PR1500/SP7B require an external power supply while PR150/SP2B and PR1500/SP8B are battery powered. Contact Dranetz Customer Service Department for information on pricing and availability. PR (B Series) Probe Description Model No.
- Page 53 XLB & MHB probe identification. These probes are available in different sizes, allowing current current probes measurements in Single Phase or 3 Phase circuits. Contact Dranetz Customer Service Department for information on pricing and availability. DRANFLEX Probe Description Model No.
- Page 54 ISOFLEX-MHXL has a 12VDC input that is powered from the AC adapter supplied as a standard accessory for HDPQ Xplorer, HDPQ Guide or HDPQ Visa. This power supply provides a pass through 12VDC output for connection to power the instrument and a 3VDC isolated output to power flex type current probes only.
- Page 55 CH 2/ Voltage Measurement Cables and Current Probe Connections The following figure shows how to connect a current probe to channel A for current Single phase current probe monitoring of a single phase line. connection example The current probe may be connected to the return line if desired to measure the return current when checking for load current leakage, loop current relationships, etc.
- Page 56 This page intentionally left blank. 2-16 PowerMeterStore 1.877.766.5412 www. .com Shop for Power Metering products online at:...
-
Page 57: Chapter 3 - Real Time Data
C H A P T E R Real Time Data Overview HDPQ Xplorer allows you to view power quality phenomena as it happens, when it Introduction happens. The instrument is able to capture and process data in real time, and allows you to view it in Dial Meters (graphical), Tabular Meters (textual), Scope Mode, Dashboard, Harmonics and Phasor display. - Page 58 Overview, continued Access to real time data Action... Result... (continued) 3rd: Real-Time Data icon is also accessible on the taskbar of most typical screens, where shortcuts to common instrument functions are found. Example: You can access Real- Time Data from the taskbar of the Communications setup screen.
-
Page 59: Section A -Dial Meters
CH 3/ Real Time Data Section A Dial Meters Overview Dial Meters allow you to define the parameters and create dial-type readings of each Introduction channel or parameter. The readings are updated at approximately once every three seconds. The Dial Meters screen can be displayed by pressing Dial Meters from the Real-Time Dial meters Data menu. - Page 60 Dial Meters - Overview, continued metered parameters pops up showing groupings and arrangements of parameter/ Function keys (continued) channel combinations. Check your desired parameter/channel, then click on Exit to view the selections made. Refer to Section B Text Display Meters for the list of parameters available for display.
-
Page 61: Section B -Text Display Meters
The Exit key returns to the Real Time Data menu. HDPQ Xplorer is designed to provide setup as well as data display. Metered parameters are available for display regardless if they are being journalled under Start Menu >... -
Page 62: Standard Meter Tab
Standard Meter Tab Standard Meter Tab At start-up, text display meter defaults in the Standard tab featuring the basic power Standard meter list quality parameters available as shown below. HDPQ-307 Standard Tab Parameter Name Label Fx: Volts & Amps Voltage (L-N) line-neutral Voltage (L-L) line-line... - Page 63 CH 3/ Real Time Data Standard meter Standard Tab Parameter Name Label list (continued) Fx: Power Active Power Active Power Apparent Power Apparent Pwr Reactive Power Reactive Pwr True Power Factor True PF Displacement Power Factor Displace PF Fx: Demand Current Demand Dmd Current Active Power Demand...
-
Page 64: Distortion Meter Tab
Distortion Meter Tab Distortion Meter Tab HDPQ Xplorer is able to meter distortions or uncharacteristic changes in the waveform Distortion meter list of original signals. Distortion calculations measure the deviation of complex waveshapes from pure sine waves. Harmonics are measured in accordance with IEC 61000-4-7 Class I. -
Page 65: Unbalance Meter Tab
CH 3/ Real Time Data Unbalance Meter Tab Unbalance The Unbalance metering tab shows positive, negative and zero sequence components meter list for voltage and current, as well as the NEMA definition of maximum deviation from the average of the three phases. HDPQ-309 Unbalance Tab Parameter Name... -
Page 66: Advanced Meter Tab
Advanced Meter Tab Advanced Meter Tab The Advanced metering tab shows positive, negative and zero sequence components Advanced meter list for voltage and current. HDPQ-310 Advanced Meter Tab Parameter Name Label Fx: Current V/I Phase V/I Phase Residual Current Resid. Current Net Current Net Current Fx: V Distortion... -
Page 67: Advanced Demand & Energy Meter Tab
CH 3/ Real Time Data Advanced Demand & Energy Meter Tab Advanced energy metering tab meters multiple total apparent power and power factor Advanced energy meter list parameters, calculated using arithmetic and vector sums of the individual phases. These methods may produce different values with distorted and/or unbalance phases. Demand/Advanced Energy include various energy parameters on per phase and total basis as well as in forward and reverse mode. - Page 68 Advanced Demand & Energy Meter Tab, continued Advanced energy meter list Advanced Energy Tab Parameter Name Label (continued) Fx: Predicted/Peak Peak Active Power Demand Peak W Dmd Peak Apparent Power Peak VA Dmd Demand Peak Reactive Power Peak var Dmd Demand Peak Current Demand Peak I Dmd...
- Page 69 CH 3/ Real Time Data Advanced energy meter list Advanced Energy Tab Parameter Name Label (continued) Fx: Arith & Vector Arithmetic Sum Power Arithmetic Sum PF Factor Arithmetic Sum Arithmetic Sum DPF Displacement Power Factor Arithmetic Sum Volts Arithmetic Sum VA Ampere Fundamental Arithmetic Fundamental Arithmetic...
-
Page 70: Advanced Flicker Meter Tab
Advanced Flicker Meter Tab Advanced Flicker Meter Tab The Advanced flicker parameters are used primarily for specialized testing. Flicker Advanced flicker list measurements are calculated as per IEC 61000-4-15 and IEEE 1453. HDPQ-312 Advanced Flicker Tab Parameter Name Label Fx: Advanced Flicker Instantaneous Flicker PInst PInst LPF... -
Page 71: Section C -Scope Mode
CH 3/ Real Time Data Section C Scope Mode Overview Scope mode allows you to view real-time voltage (V) and current (I) waveforms for up Introduction to eight channels simultaneously (four V and four I). Waveforms may be displayed on a single or dual axis (overlaid or stacked). -
Page 72: Turning Channels On/Off
Turning Channels On/Off Turning Channels On/Off From Scope mode, press Select Channel to turn Volts/Amps channel selection on/off. Select channels to display The pop-up window lets you select which channels will appear in the Scope mode display. HDPQ-314 Doing any of the following actions will turn channels on/off: •... -
Page 73: Viewing Plots - Stacked/Overlay
CH 3/ Real Time Data Viewing Plots - Stacked/Overlay The Stacked/Overlay button from Scope mode toggles between single, multiple or Plot display dual axis plots and views, samples shown below. This function allows you to view all voltage and current channels either in: Overlay Plot - single axis plot HDPQ-315a Multiple Stacked Plot - separate, multiple plots with voltage and current pairs... -
Page 74: Checking Input Range
Checking Input Range Checking Input Range From Scope mode, press Check Range. The input range window pops up showing the Input range status of the voltage and current input channels, whether under range, normal, or over range. For Current, under range is reported below 0.4% of full scale and over range is reported above 200% of full scale. -
Page 75: Section D -Dashboard
CH 3/ Real Time Data Section D Dashboard Overview The Dashboard is a visual way of seeing present values as well as if any events Dashboard display occurred, such as out-of-limit conditions, for each of the displayed parameter. The dashboard displays meter data (or event count) in a 2x3, 3x4, or 4x6 matrix. It is color coded to indicate whether or not the parameter is within limits. - Page 76 Overview, continued NOTE: Where applicable, the values reported within a parameter in the dashboard Dashboard display refer to measurements on channels A, B, C, and D respectively. The measurement (continued) values for each channel are updated approximately once per second while monitoring is on.
- Page 77 CH 3/ Real Time Data Motor Health - displays parameters that affect the operation of motors. The default Dashboard function keys parameters for Motor Health as displayed in the 3x4 (medium) panel are (from first row (continued) left to right): Vrms, Irms, Freq, Vthd, Horsepower, Derating, Active Power, Reactive Power, Power Factor, V neg/pos unbalance, I neg/pos unbalance.
-
Page 78: Parameter Details In Dashboard Display
Parameter Details in Dashboard Display Parameter Details in Dashboard Display The dashboard displays metered data for the selected parameter. The metered data is Dashboard color scheme updated once per second. This is the same data that appears in the meter screen, and used in calculating journals. - Page 79 CH 3/ Real Time Data Parameter Action... Result... details (continued) STEP 2: Once Select Parameters is pressed, the Change Parameter/ Channel window showing groupings and arrangements of parameter/channel combinations, is displayed. Check your desired parameter/channel and then click on Exit to view the selections made.
-
Page 80: Section E -Voltage And Current Phasor
Overview Section E Voltage and Current Phasor Overview The phasor screen displays a graph that indicates the phase angle and magnitude Phasor display relations between the voltage and current based upon the angles of the fundamentals, as determined by Fourier analysis. Phasor screen shows eight phasors autoscaled with zero degrees to the right (normally channel A voltage) for counterclockwise rotation and with synchronized channels. -
Page 81: Phasor Screen
CH 3/ Real Time Data Phasor Screen The Phasor window is displayed by pressing Phasor from the Real-Time Data menu or Phasor screen display by pressing the Phasor real-time metering icon on the work area of the Home Monitoring page. The Phasor window shows eight phasors autoscaled with zero degree to the right for clockwise rotation and with synchronized channels. -
Page 82: Phasor Rotation
Phasor Rotation Phasor Rotation Graphic illustration in the form of rotating phasors relative to the sine wave graph of a Animated phasor rotation four wire wye circuit is available by pressing the Demo button on the Phasor window. The Demo key will be replaced by Start/Stop once phasor rotation has been viewed. Press Start to replay animated phasor rotation. - Page 83 CH 3/ Real Time Data The following diagrams describe the positive phase rotation of voltage and current Sample 3-Phase, three wire delta phasors (for Resistive, Inductive and Capacitive loads) for a three phase, three wire rotation delta connection. An arrow head on the line indicates direction pointing toward the (continued) load.
-
Page 84: Phasor Channel/Parameter Selection
Phasor Channel/Parameter Selection Phasor Channel/Parameter Selection The Channel/Parameter selection screen is displayed by pressing Channel & Channel/ Parameter Parameter on the phasor Demo window. Depending on the phases being monitored, up display to three channels may be displayed at any one time for both Volts or Amps. HDPQ-325 Press to enable/disable the channel/parameter for display in the animated phasor rotation. -
Page 85: Section F -Harmonics
CH 3/ Real Time Data Section F Harmonics Overview HDPQ Xplorer allows you to view voltage and current harmonics/interharmonics in Harmonics display graphical or in tabular form. Harmonics are waveform distortion, steady-state deviations from an ideal power frequency sinusoid and are characterized by the spectral content of the waveform. - Page 86 Overview, continued Harmonic screen and function keys (continued) HDPQ-326 Channel Parameter - allows you to change and select your desired channel/parameter with which to create the harmonic graph/table. If you press this, the Change Parameter/ Channel window pops up showing groupings and arrangements of parameter/channel combinations.
-
Page 87: Harmonic Channel/Parameter Selection
CH 3/ Real Time Data Harmonic Channel/Parameter Selection From the Harmonic Graph window, press Channel Parameter to turn Volts/Amps/ Channel/ Parameter Watts channel selection on/off. One channel/parameter combination can be displayed at display a time for the spectrum graph, magnitude list, or phase angle list for the harmonics. Selections can be made from Channels A, B, C and D, and Parameters V, I, W. -
Page 88: Harmonic Graph/Table
Harmonic Graph/Table Harmonic Graph/Table The Graph/Table function key toggles between spectrum graph to table of magnitude Harmonic graph/table and phase in text form. Use this key if you want to switch views between harmonic display graph to harmonic magnitude table, as shown below. HDPQ-328 HDPQ-329 The harmonic parameters displayed on list include: (from leftmost column) the... - Page 89 CH 3/ Real Time Data Harmonic phase degree values from 1 to 127 are displayed for voltage and current; Harmonic graph/table phase degree values from 1 to 127 are displayed for harmonic watts. Harmonic phase display angle values can be normalized to the phase of the fundamental of the displayed (continued) channel.
-
Page 90: Harmonic Detail
Harmonic Detail Harmonic Detail HDPQ Xplorer allows you to determine the number or the range of harmonic Harmonic graph details frequencies to trend. HDPQ-332 The Zoom function allows you to zoom in/out of the plot display using the controls described below. -
Page 91: Harmonic Options
CH 3/ Real Time Data Harmonic Options The voltage and current harmonics and/or interharmonics for each phase channel can Harmonic/ Interharmonic be trended using the Options button. The properties specified under Harmonic Options data plots apply when harmonic/interharmonic data is viewed in either graph or tabular form. Properties under Calculate Harmonics as pertain to both the graph and the table, and determine how the harmonics and interharmonics are used. - Page 92 Harmonic Options, continued The IEC 61000-4-7 and IEEE 519 Standards specify that the interharmonic bins Harmonic computation adjacent to the harmonic be included in the computation of that harmonic called grouping, for example, if there was a 3rd harmonic (150 Hz) of 10%, and the value of the 145 Hz bin was 1%, and the value of the 155 Hz bin was 2%, then the value reported in the bin labelled “150 Hz”...
-
Page 93: Section G -Strip Chart Recorder
CH 3/ Real Time Data Section G Strip Chart Recorder Overview Strip Chart Recorder displays a real-time auto-scaled graph of selected parameters, Introduction updated once every 3 seconds. The initial strip chart screen records up to 10-minutes worth of horizontal scale data, with the vertical axis also initially on auto-scale. Once the 10-minutes worth of data is complete, the horizontal scale continues to shift forward in time with each update. - Page 94 This page intentionally left blank. 3-38 PowerMeterStore 1.877.766.5412 www. .com Shop for Power Metering products online at:...
-
Page 95: Chapter 4 - Setup Monitoring
C H A P T E R Setup Monitoring Overview The Start Menu allows you to perform the following: set up HDPQ Xplorer for Start menu options monitoring of an electrical system, load previously saved setups, and load data files from memory. - Page 96 Start Monitoring. Proceed to Step 2. NOTE: Repeated pressing of the Dranetz logo, located at the top left of the taskbar, alternates HDPQ-110a between the Home page and the Home Monitoring page (screen below), back and forth.
- Page 97 CH 4/ Setup Monitoring Displaying Start Action... Result... Menu (continued) STEP 2: Start Menu contains menu selections for Automatic Setup for Power Quality, Automatic Setup for Energy/ Demand, Wizard Setup, Monitor same circuit, Load setup template, Load data file from memory, Change Instrument Configuration and View/Save Monitoring Setup.
-
Page 98: Section A -Automatic Setup For Power Quality
Overview Section A Automatic Setup for Power Quality Overview Automatically configures the setup for monitoring quality of supply based on IEEE and Automatic Setup procedure IEC typical trigger settings. Automatic Setup is a one-stop process using pre-defined values to set up the unit automatically. You have the option to view the summary list of parameter settings, change probe types if current will be monitored, and/or proceed directly with data monitoring. - Page 99 CH 4/ Setup Monitoring Automatic Setup Action... Result... procedure (continued) STEP 2: Summary displays the list of parameter settings for Automatic Setup for Power Quality. The setup summary is available for review before, during and after monitoring. • Press and drag the scroll bar to move the page up or down.
- Page 100 Overview, continued Automatic Setup Action... Result... procedure (continued) CT Scale Factor Set the CT scale factor when using a current probe that is not on the list or if there are additional scale factors from other CTs in the system that need to be taken into account.
-
Page 101: Section B - Automatic Setup For Energy/Demand
Overview Section B Automatic Setup for Energy/Demand Overview Automatically configures the setup for monitoring energy/demand. Automatic Setup is Automatic Setup procedure a one-stop process using pre-defined values to set the unit automatically. You have the option to view the summary list of parameter settings, change probe types if current will be monitored, and/or proceed directly with data monitoring. - Page 102 Overview, continued Automatic Setup Action... Result... procedure (continued) STEP 2: Summary displays the list of parameter settings for Automatic Setup. The setup summary is available for review before, during and after monitoring. • Press and drag the scroll bar to move the page up or down.
- Page 103 CH 4/ Setup Monitoring Automatic Setup Action... Result... procedure (continued) CT Scale Factor Set the CT scale factor when using a current probe that is not on the list or if there are additional scale factors from other CTs in the system that need to be taken into account.
-
Page 104: Section C -Wizard Setup
Inrush- type events such as motor start-up typically requires extended duration cycle-by-cycle recording. With HDPQ Xplorer, you can capture and store detailed data to evaluate system performance against specifications and previous benchmark data. Under the current inrush mode, triggers are current-based. - Page 105 HDPQ Xplorer is designed to facilitate long-term monitoring by collecting min/max/avg data at each predetermined interval in order to perform post-process harmonic and other events analysis. HDPQ Xplorer is also designed to be left unattended in the field, recording statistically representative data for long-term analysis.
- Page 106 Overview, continued Follow these steps to set up the circuits via Wizard Setup. Wizard setup Action... Result... STEP 1: From the Start Menu, press Wizard Setup. Menu Tab You can go through the monitoring setup step-by-step by clicking on the Next function key or you can skip ahead and select the menu tab on top of the screen that you want to change/view.
- Page 107 CH 4/ Setup Monitoring Wizard setup Action... Result... (continued) • Pressing Exit will prompt the Exit Setup screen where you can either accept the setup changes (proceed with monitoring) or not. You can also use the instrument as a meter, retaining setup changes without turning monitoring on.
-
Page 108: Current Probes - Turns Ratios Setup
Current Probes - Turns Ratios Setup Current Probes - Turns Ratios Setup Follow these steps to monitor current and select probe type. Select current probe Action... Result... STEP 1: Press the Probes Scaling tab, or from the Wizard Setup screen press Next. The Current Probes - Turns Ratios window is displayed. - Page 109 What is a scale factor? or potential transformer (PT). A scale factor is entered in HDPQ Xplorer and then multiplied automatically by the measured voltage or current so the unit displays the correct values, as referenced to the primary side, rather than the secondary side of the PT or CT (for CTs that are used in addition to those set up in the current probe menu).
- Page 110 Current Probe - Turns Ratios Setup, continued After setting up the current probe, define the Turns Ratios using the same screen. Scale factor setup Action... Result... STEP 1: The Current Scale Factor properties are shown on the right side of the Probe setup screen. You need to set the current turns ratios when using a current probe that is not on the list.
-
Page 111: Circuit Type Selection
CH 4/ Setup Monitoring Circuit Type Selection HDPQ Xplorer is able to display wiring diagrams from which you can select the circuit Circuit setup type appropriate to your application. The instrument will automatically select and display the detected circuit type when entering the screen and compare the detected voltages, currents, and phase sequence (if applicable) to the selected circuit type. -
Page 112: Nominal Values
HDPQ-412 NOTE: Make sure that the nominal values Nominal Values computed by HDPQ Xplorer are correct. • To enter a new internal Nominal values are used as basis for setting Frequency, Voltage and/or default thresholds and other parameters for Current value, press the circuit monitoring. - Page 113 Check to specify the external sync mode to show which channel the signal is connected to. • Channel A Volts/Amps: When set to Ch A, HDPQ Xplorer attempts to sync to an incoming voltage/current signal. • Channel D Volts/Amps: When...
- Page 114 AC voltage signal input on CH A (or CH D according to setup). Loss of external sync causes the HDPQ Xplorer to hold the last valid frequency for the synch channel until adequate frequency returns. If none exists, then internal sync is automatically selected.
-
Page 115: Monitoring Mode
CH 4/ Setup Monitoring Monitoring Mode HDPQ Xplorer provides nine monitoring modes of operation from which to monitor Choose a monitoring and capture data relevant to the user application. mode Action... Result... STEP 1: Press the Monitor Mode tab or from the Nominal & Frequency screen, press Next. -
Page 116: Trigger Limits Setup Options
Trigger Limits Setup Options Trigger Limits Setup Options After selecting a monitoring mode, the system is now ready to begin monitoring and to Limits setup options record data in memory. Prior to actual monitoring, you have the option to accept the default threshold settings and proceed with monitoring, or to review and/or modify monitoring settings. -
Page 117: Rms Variation
HDPQ Xplorer allows you to set the limits for each of the triggers, as well as the amount of rms value (in cycles) to record before and after the trigger cycle. - Page 118 RMS Variation Limit, continued The following parameters are required to define how an rms variation is triggered: Procedure to record rms • Low Limit variation • High Limit • Very Low Limit Action... Result... STEP 1: From the Trigger Limits Setup Options screen, press Set RMS Limits.
- Page 119 CH 4/ Setup Monitoring Procedure to record rms Action... Result... variation (continued) STEP 2: You can define the number of rms summary and waveform cycles to be saved before the start (pre-), after the start (post-start), and after the end (post-end) of the event.
- Page 120 RMS Variation Limit, continued Procedure to record rms Action... Result... variation (continued) Waveform Capture (Cycles): These values can also be used for transient waveform capture. • Press Pre-Trigger to set the number of cycles for Pre-event start waveform cycles. Use the keypad to enter the number of waveform cycles to be saved before the event start and event...
-
Page 121: Transients
CH 4/ Setup Monitoring Transients Dranetz instruments label rms voltage or current variations as either sags (voltage or Transient detection current decreases below low limit) or swells (voltage or current increases above high limit) as per IEEE 1159. Voltage disturbances which are shorter in duration than typical sags and swells (which are usually 1/4 cycle or longer) are classified as transients. -
Page 122: Set Peak Transients
Set Peak Transients Set Peak Transients HDPQ Xplorer uses four different algorithms to detect and record transients: Peak transient disturbance • Peak or Instantaneous trigger magnitude • Waveshape threshold duration (window) and magnitude (tolerance) cycle to cycle • Waveshape rms deviation cycle to cycle •... - Page 123 CH 4/ Setup Monitoring Peak transient Action... Result... disturbance STEP 2: Select how you want to (continued) specify the number of waveform cycles to record before (Pre- Trigger Cycles) and after (Post- Trigger Cycles) the trigger cycle. • Click on the Defaults key to set the waveform trigger cycle counts for transient events to the default settings:...
-
Page 124: Set Waveshape Transients
Result... detection STEP 1: From the Trigger Limits Setup Options screen, press Set Waveshape Transients. HDPQ Xplorer shows the “floating window” algorithm used for waveshape fault detection. • Press the limit field under Threshold to change limit. Use the keypad to enter the threshold limit or tolerance. -
Page 125: Set Rms Distortion
STEP 1: From the Trigger Limits Setup Options screen, press Set RMS Diff Transients. HDPQ Xplorer allows you to set the rms distortion waveshape limit. • Press the limit field to change limit. Use the keypad to enter the treshold limit beyond which rms voltage variations occur. -
Page 126: Set High Frequency Transients
Only HDPQ Xplorer and HDPQ Xplorer-400 are designed with high speed sampling analog board that can capture voltage and current transients. Because these types of disturbances usually exhibit very narrow widths and fast rise and fall times, they are quickly damped by the system. -
Page 127: Waveform Capture
CH 4/ Setup Monitoring Waveform Capture HDPQ Xplorer allows you to set the trigger channels/parameters for waveform capture Trigger channel setup to determine which channel’s data will be saved when a trigger occurs. Action... Result... STEP 1: From the Trigger Limits Setup Options screen, press Waveform Capture. - Page 128 Waveform Capture, continued The table below shows the channels that will have waveforms recorded should rms or Trigger channel matrix transient triggers occur. Trigger Type Waveforms Recorded If RMS or Transient For Column 1: save waveform data for triggered channel event occurs only V or I, and Chan D if enabled For Column 2: save waveform data for triggered channel...
-
Page 129: Timed Intervals
CH 4/ Setup Monitoring Timed Intervals The Timed Intervals screen allows you to define how often HDPQ Xplorer saves data Introduction periodically, regardless of power quality disturbances and journal limits. Power Values Definitions Power Values Interval - Power parameter values are based upon all cycles during a one second interval. - Page 130 Timed Intervals, continued The intervals for timed readings are user programmable. Timed intervals menu Action... Result... STEP 1: From the Trigger Limits Setup Options screen, press Timed Intervals. The Timed Intervals menu will be displayed. Press the parameter that you want to change.
- Page 131 CH 4/ Setup Monitoring Timed intervals Action... Result... menu (continued) • Disable - deactivates or turns all field values to Off. Pressing this key a second time will activate or turn on the field values to previous settings. • Set to Defaults - sets all field values to default settings.
-
Page 132: Journal Limits
Journal Limits Journal Limits HDPQ Xplorer allows power parameters to be trended using periodic readings that are Journal entry settings stored in a journal. Statistical information is always captured regardless of the limit settings, so you will never be without a trend even if you did not set the limits correctly. - Page 133 CH 4/ Setup Monitoring To review/modify journal limit setups, press the Journal Limits key. Journal parameter list The following parameters are available for recording by exception. This menu lets the user specify thresholds to force journal recording at the moment the threshold is crossed.
- Page 134 Journal Limits, continued Journal Distortion Parameters parameter list (continued) HDPQ-424 Distortion [Fx: none] Voltage Crest Factor Current Crest Factor ANSI Transformer Derating Factor Transformer K Factor Current TDD (rms) Unbalance Parameters HDPQ-425 Unbalance Fx: V Unbalance Fx: I Unbalance Positive Sequence Voltage Positive Sequence Current Negative Sequence Voltage Negative Sequence Current...
- Page 135 CH 4/ Setup Monitoring Journal Advanced Meter Parameters parameter list (continued) HDPQ-426 Advanced Meter Fx: Current Fx: V Distortion Fx: I Distortion User Specified User Specified V Frequency* I Frequency* V/I Phase Voltage Total Current Total User Specified User Specified Harmonic Harmonic 5Hz Frequency...
- Page 136 Journal Limits, continued Journal Advanced Demand & Energy Parameters parameter list (continued) HDPQ-427 Advanced Demand & Energy Forward & Predicted/ Peak @ Peak @ Peak @ Arith & Reverse Peak (Peak P (Peak Q (Peak S Vector Demand) Demand) Demand) Forward Predicted P Avg PF at...
- Page 137 CH 4/ Setup Monitoring Journal Advanced Flicker Parameters parameter list (continued) HDPQ-428 Advanced Flicker [Fx: none] PInst (Instantaneous Flicker) 4-43 PowerMeterStore 1.877.766.5412 www. .com Shop for Power Metering products online at:...
-
Page 138: Voltage Compliance En50160 (For Strict En50160 Monitoring)
Voltage Compliance EN50160 (for strict EN50160 Monitoring) Voltage Compliance EN50160 (for strict EN50160 Monitoring) EN50160 is a statistical analysis of power quality data based on the EN (EuroNorm) Setup options for EN50160 standard. The statistical firmware called Quality of Supply (QOS) is built into HDPQ Xplorer, with monitoring and setup protocols set to determine voltage measurement compliance required for EN50160 monitoring. - Page 139 CH 4/ Setup Monitoring EN50160 Action... Result... optional settings (continued) • Define up to five frequency signals set in 5Hz resolution. Mains signalling compliance or non-compliance is determined by calculating/adding the status of each of the defined frequencies. • To modify frequency settings for EN50160 monitoring, press the desired frequency field.
-
Page 140: Finalize Monitoring
Finalize Monitoring Finalize Monitoring Once the instrument has been set up for monitoring or after reading a setup template Finalize setup from memory, you can finalize and configure the monitoring process using the parameters below. Press the Finalize tab. Prior to finalizing the monitoring setup, you have the option to: •... - Page 141 • To return to the Trigger Limits screen, press Previous. • To accept/abort the monitoring settings, press Next or Exit. The Exit Setup screen will be displayed. See next page. HDPQ Xplorer treats the internal memory and the external memory device like a USB Guidelines on file data transfer flash drive storing files in Windows-compatible format.
-
Page 142: Exit Setup
Exit Setup Exit Setup At the end of the Wizard Setup, the Exit Setup screen prompts you to either accept the Exit Setup setup changes or not, before going on to start monitoring (if accepted). You also have the option to use the instrument as a meter, where monitoring setup changes are retained without turning monitoring on. -
Page 143: Section D -Monitor Same Circuit
CH 4/ Setup Monitoring Section D Monitor Same Circuit Overview Menu options for monitoring become available only after setting up the instrument or Introduction from reading a setup template from memory. You can make use of existing setups for monitoring using the Monitor Same Circuit key. Follow these steps to display the monitoring options menu. -
Page 144: Turn Monitoring On/Off
Turn Monitoring On/Off Turn Monitoring On/Off Once the instrument has been set up for monitoring or after reading a setup template Start/Stop monitoring from memory, you can finalize and configure the monitoring process using the parameters on the Finalize tab. Action... - Page 145 CH 4/ Setup Monitoring Start/Stop Action... Result... monitoring (continued) STEP 1 (continued): • To end monitoring at a specified time and date, press Time/Date. Use the corresponding windows provided to specify the time and date when you want monitoring to end. •...
- Page 146 ON. FILE NAME: User specified or HDPQ Xplorer xx.ddbx (where xx increments every time data is saved using the same file name) DURATION: length of period...
- Page 147 CH 4/ Setup Monitoring Start/Stop Action... Result... monitoring (continued) STEP 3: There are three (3) ways to end monitoring: 1st: Manually by pressing the Stop Monitoring icon once the instrument is actively monitoring on the Home Monitoring page (described below). 2nd: Automatically when the specified end monitoring time is reached.
-
Page 148: View/Save Setup Configuration
View/Save Setup Configuration View/Save Setup Configuration Under Configuration settings, select one from the following. Setup configuration settings HDPQ-430 View Summary - press View Summary to display the parameter settings in effect. Setup summary is available for review before, during, and after monitoring. The Setup Summary page is displayed. -
Page 149: Section E -Load Setup Template
Section E Load Setup Template Overview HDPQ Xplorer lets you load saved setup template files (.set) either from internal Introduction memory or from an external USB flash drive. NOTE: Loading a setup template from memory will overwrite your existing setup. -
Page 150: Section F -Load Data File From Memory
Action... Result... STEP 1: From the Start Menu, press Load data file from memory. HDPQ Xplorer lists the recorded monitoring sessions, when data has been captured and stored in memory. Each recorded session is identified by a Session... - Page 151 If the data file is open for active monitoring, you ® the Dranetz Dran-View have to first press stop monitoring, then view the program to retrieve and view setup session file. Once the setup file has been the files in your computer.
-
Page 152: Section G -Change Instrument Configuration
Section G Change Instrument Configuration Overview HDPQ Xplorer allows you to manage the instrument to make sure that it runs Introduction efficiently, and the instrument is set up according to your preferences and application. From the Start Menu, select Change Instrument Configuration to display the Instrument Settings menu. -
Page 153: Section H -View/Save Monitoring Setup
CH 4/ Setup Monitoring Section H View/Save Monitoring Setup Overview The setup summary displays the list of parameter settings for the present setup Introduction application. Setup summary is available for review before, during and after monitoring. You have the ability to save the monitoring settings to internal memory or to an external USB flash drive. - Page 154 View/Save Monitoring Setup, continued View/Save Action... Result... setups (continued) STEP 3: Use the onscreen keyboard to enter a new filename for the monitoring setups to be stored in the external USB device. When done click on OK. NOTE: If there is no USB device plugged in, a message appears to indicate that no USB device is detected.
-
Page 155: Chapter 5 - Instrument Settings
C H A P T E R Instrument Settings Overview This chapter describes the miscellaneous tasks that you can perform to keep the HDPQ Introduction Xplorer running efficiently. These are tasks that you might perform only occasionally. All functions in this chapter are found under the Instrument Settings menu. Follow Instrument Settings menu these steps to display the Instrument Settings menu. - Page 156 Topic See Page Time and Date Settings Select Language Communications Options Set Up the HDPQ Xplorer for Wireless (WiFi) Connectivity 5-15 Set Up the HDPQ Xplorer for Bluetooth Connectivity 5-19 Download Data Remotely via Network, WiFi & Bluetooth PAN 5-21...
-
Page 157: Time And Date Settings
CH 5/ Instrument Settings Time and Date Settings You have the option to set the exact time and date, as well as select the format of how Time and Date display time and date will appear on screen. You can also set the instrument to automatically adjust for daylight saving time (DST) changes. - Page 158 Time and Date Settings, continued Time and Date display Action... Result... (continued) STEP 2: Press the Up/Down arrow keys to specify new time settings. Use the leftmost arrow key to set the hour, the middle to set minutes, and the rightmost to set seconds.
- Page 159 Time and Date display Action... Result... (continued) STEP 4: HDPQ Xplorer lets you synchronize time so that all your devices are using the same time for data recording. Time sync options include GPS, NTP or RTC. Each Time Sync Source button toggles the respective source enabled or disabled.
-
Page 160: Select Language
Select Language Select Language HDPQ Xplorer menu screens appear in the English language by default. You have the Language options option to set the screen display to any of the European or Asian language available. Action... Result... STEP 1: From the Instrument Settings menu, press Select Language. -
Page 161: Communications Options
(WLAN) access point or hotspot based on any of the 802.11x standards, a wireless network card installed in the HDPQ Xplorer (factory-installed at the time of purchase), and a wireless-enabled host laptop/computer. - Page 162 Communications Options, continued • VNC connection Data communications The HDPQ Xplorer can be VNC-enabled so that any VNC Client can access the options instrument remotely, provided the correct password is entered. Virtual network (continued) computing (VNC) software allows you to view and interact with the HDPQ Xplorer from any other computer or mobile device anywhere using the Internet.
- Page 163 Ethernet cable port. You have the ability to connect to the HDPQ Xplorer mainframe via the Ethernet cable. Subnet Mask - masks an IP address, and divides the IP...
- Page 164 Communications Options, continued Ethernet setup Action... Result... (continued) DNS Server - server that stores the DNS records for a domain name. Use the numeric keypad to enter the DNS Server in the appropriate field. Name - refers to the address of the DNS server.
- Page 165 CH 5/ Instrument Settings This section defines the screen interface for Wireless (WiFi) setup. See page 5-15 for Wireless (WiFi) setup detailed steps on how to set up the HDPQ Xplorer for wireless connectivity. Action... Result... WIFI SETUP Networks Found - use the drop...
- Page 166 This section defines the screen interface for Bluetooth setup. Bluetooth setup NOTE: The Xplorer requires the installation of a Dranetz supplied Bluetooth external adapter in order to connect to a wireless-enabled device using the Bluetooth networking mode. The Bluetooth interface uses a PAN network that is only available on PC based devices.
- Page 167 SETUP VNC Enabled/Disabled = Yes/ No - you have the option to enable/disable VNC setting in your HDPQ Xplorer. When VNC- enabled, any VNC Client who enters the valid password can view and interact remotely with the HDPQ Xplorer from another...
- Page 168 When enabled, your instrument is able to communicate with other devices that can request data via the Modbus/TCP protocol. The HDPQ Xplorer is a Modbus HDPQ-512 server and sensor/meter. Its intended application is to communicate with Modbus clients such as HMI, BMS, SCADA and other software platforms.
-
Page 169: Set Up The Hdpq Xplorer For Wireless (Wifi) Connectivity
CH 5/ Instrument Settings Set Up the HDPQ Xplorer for Wireless (WiFi) Connectivity The following procedure shows how to set up the HDPQ Xplorer for WiFi connectivity. Procedure NOTE: Some of the settings in the wireless setup shown below are examples of what might be detected. - Page 170 Set Up the HDPQ Xplorer for Wireless (WiFi) Connectivity, continued Procedure Step Action (continued) The WiFi Network Setup screen is displayed. Provide the required credentials for the wireless network you are connecting to. As shown below, NETGEAR58 is an example of a WiFi network. Security Type, Encryption and Security Key or password must be obtained depending on the network you want to connect to.
- Page 171 NOTE: A pop-up box appears requiring you to enter the Username and Password for the instrument. • The username is always admin, written in lowercase. • The default password is Dranetz. The username and password are case sensitive, and must be entered as shown.
- Page 172 Set Up the HDPQ Xplorer for Wireless (WiFi) Connectivity, continued Procedure Step Action (continued) Confirm that the page shown below is displayed on your web browser. Turn off power on the instrument and close your Internet Explorer web browser. 5-18 PowerMeterStore 1.877.766.5412...
-
Page 173: Set Up The Hdpq Xplorer For Bluetooth Connectivity
PAN networks. Set up the instrument for Bluetooth connection As first step, you need to ensure that the instrument is equipped with a Dranetz supplied Bluetooth external adapter in order to connect to a wireless-enabled device using the Bluetooth networking mode. - Page 174 The connection process should start. If successful, the HDPQ and My Device icons will change color. NOTE: At this point the HDPQ Xplorer should respond to a ping at IP address 169.254.10.10 (HDPQ fixed Bluetooth address). The VNC should also be able to connect at this address as well.
-
Page 175: Download Data Remotely Via Network, Wifi & Bluetooth Pan
Enter the Username and Password for the instrument. The username is always admin, written in lowercase. The default password is Dranetz. Passwords can be changed on the VNC setup page, under Communications settings. The web page will show four folders, each of which contains the following information to upload: •... -
Page 176: Download Data Via Usb Connection
Download Data via USB Connection Download Data via USB Connection The following procedure shows how to download data via a USB connection. Procedure Step Action Plug the small end of the USB active sync cable into the small USB connector on the right side of the HDPQ instrument. Plug the other end into the USB connector on your computer. -
Page 177: Manage Memory
CH 5/ Instrument Settings Manage Memory HDPQ Xplorer gives you the ability to manage data files in memory. Use the Manage files in memory corresponding soft key to open a session file and view event records contained therein, delete session files, or copy and save files from internal memory to a USB flash drive. - Page 178 • Press Archive to USB to copy and save data files from internal memory to an external memory device (USB). Once the files have been saved, you will need the Dranetz Dran- View ® program to retrieve and view the files in your computer.
-
Page 179: Update Firmware
CH 5/ Instrument Settings Update Firmware You can update the HDPQ Xplorer internal program by downloading the latest HDPQ Xplorer firmware firmware release from the web to install into internal memory. Refer to the instructions upgrade below on how to upgrade the unit’s firmware. - Page 180 Update Firmware, continued The procedure below details how to install the latest firmware upgrade to the HDPQ Install firmware upgrade to Xplorer. HDPQ Xplorer Action... Result... STEP 1: From the Instrument Settings menu, press Update Firmware. The update firmware configuration screen prompts whether or not you want to proceed with firmware upgrade.
- Page 181 CH 5/ Instrument Settings Install firmware upgrade to Action... Result... HDPQ Xplorer STEP 3: Do not turn the power (continued) off nor remove the USB device while firmware upgrade is in progress. NOTE: If no errors were detected, a message indicating firmware update complete will pop up.
-
Page 182: Setup Sound
Setup Sound Setup Sound When set to ON, the unit will beep when threshold limits are crossed and error Audible alarm conditions occur. Audible alarms of short (approximately 0.1 second) duration call attention to an error condition. Alarms of long (approximately 1 second) duration signal an event trigger. -
Page 183: Setup Display
• Press Brightness and keep pressing to brighten/dim screen display to preferred percentage. • Press Password Protection to enable/disable password log-in code to HDPQ Xplorer. When password protection is enabled and you reactivate HDPQ Xplorer from auto-shutoff (see Backlight Timer setting), the keypad screen used to enter password will appear. -
Page 184: Reset To Factory Defaults
Definition Xplorer as it left the factory. Reset to factory default will erase all user data, including recorded logs and events, reports and instrument setup files. Follow these steps to reset the HDPQ Xplorer to its factory configuration. Procedure Action... - Page 185 CH 5/ Instrument Settings Dranetz has set the default values for the various parameters of the HDPQ Xplorer. Factory default settings Scale Factors: 1:1 for V and I, channels A, B, C, D Circuit Type: Three Phase Wye Mode of Operation: Monitor Off...
- Page 186 This page intentionally left blank. 5-32 PowerMeterStore 1.877.766.5412 www. .com Shop for Power Metering products online at:...
-
Page 187: Chapter 6 - View Event Data & Reports
C H A P T E R View Event Data & Reports Overview HDPQ Xplorer offers a graphical, information-packed, and easy to navigate display of Types of data display event data. The instrument operates in various stages of acquisition, characterization, communication, and visualization of event data and journalled data. - Page 188 Overview, continued View data icons Action... Result... (continued) 2nd: If monitoring is on, the Home Monitoring page becomes the start-up page. The View Data icon is available on the lower right corner of the screen. View Data brings up the Event Data & Reports menu.
- Page 189 CH 6/ View Event Data & Reports Once you bring up an event screen, the taskbar changes to show specialized icons that Taskbar icons to view events provide easy access to view event display. These icons are not common to all screens, only to event data screens.
- Page 190 Voltage Compliance Report - calculates statistical data based on the parameters required by EN50160 for determining QOS compliance. HDPQ Xplorer allows you to view voltage compliance in textual summary form or in form of a statistical bar graph.
- Page 191 Event files and reports stored in memory can also be viewed on the computer. No Downloading and viewing communication software protocol between HDPQ Xplorer and computer is necessary, data on a though the data can be exported via USB or ethernet.
-
Page 192: Section A -Trend
Section A Trend Overview Trend categories HDPQ Xplorer is able to display statistical trends or plots for the following parameter categories: Standard: Parameters include the Basic (basic volts and amps), Computed Basic (displacement power factor, residual and net current), Power, Standard Demand, Standard Energy, Harmonics and Standard Flicker. -
Page 193: Trend Plot
CH 6/ View Event Data & Reports Trend Plot A trend consists of timed and threshold waveforms for the parameter on display. The What is displayed on a trend plot can show up to four (4) stacked graphs, each graph can show up to four (4) trend? channels on the same axis. - Page 194 Trend Plot, continued Trend plot The following function keys are available to set up trend plot function keys Time Range - allows you to specify the time/date range used to display trend data. If you press Time Range, a pop-up window appears that lets you select the time/date range to display trend plot: HDPQ-603 •...
- Page 195 CH 6/ View Event Data & Reports Zoom to Data - toggles between narrowing the size of the display area that lets you Trend plot function keys view trend coordinates in greater detail (Zoom to Data) and then unzoom the last step (continued) and return to the previous screen (Zoom Out).
- Page 196 Trend Plot, continued You can also use the touchscreen to manually zoom in/out of the plot display. The Trend plot function keys touchscreen allows you to magnify details, expand or narrow in a zoom area via a one (continued) finger touch and drag action. To manually create a zoom box and zoom in on parameter(s) on the left axis, touch the screen with one finger starting from the top left and then drag to the lower right.
- Page 197 CH 6/ View Event Data & Reports Stacked/Overlay - toggles between plotting data in a single axis plot or in separate, Trend plot function keys dual or multiple axis plots. (continued) Trend Plot in Overlay allows you to view all voltage and current channels in the same, single axis plot.
- Page 198 Trend Plot, continued Select Parameter - allows you to change and select parameters to plot. Press Select Trend plot function keys Param to show the present parameters and channels displayed on screen. (continued) NOTE: The trend plot retains the present configuration every time it is accessed. The channel/parameter configuration will reset to default anytime a new monitoring session starts.
- Page 199 CH 6/ View Event Data & Reports When done selecting parameters/channels to trend for display, press Exit to close the Trend plot function keys Journal Categories screen and return to the Select Parameter screen. The journal (continued) categories that you selected will be displayed on the parameter selection screen, which renders the parameters available to plot.
- Page 200 Trend Plot, continued Show Values - splits the screen on the right pane to show values (min/avg/max) where Trend plot function keys the vertical cursor line is displayed. The dotted vertical black line appears to indicate (continued) the point where the numerical data values appear on the plot. You can touch and drag the dotted cursor line onscreen and note how values on the right pane change to show corresponding plot values.
-
Page 201: Trend Plot With Event Markers
CH 6/ View Event Data & Reports Trend Plot with Event Markers Event markers appear on the time axis where there are events. View trend with event markers Action... Result... STEP 1: From the Event Data & Reports menu, press Trend with Event Markers. - Page 202 Trend Plot with Event Markers, continued The same function keys described for trend plot are used to set up trend with event Trend with event markers markers. function keys Time Range - allows you to specify the time/date range used to display trend data. Detailed description same as in Trend Plot.
-
Page 203: Section B -Events
CH 6/ View Event Data & Reports Section B Events Overview The event screen displays actual voltage or current rms and/or waveforms that occurred What is displayed on when a certain threshold parameter was crossed. Time plots, event list, rms and event screen? waveform displays are visually interfaced showing event patterns and behaviors over threshold limits and time. -
Page 204: Event List
Event List Event List Event List presents a summary of all captured events in the order that they occurred. If View event list you bring up Event List from the Trend Plot with Event Markers screen, the list will start from the the aligned marker event. Action... - Page 205 CH 6/ View Event Data & Reports You can filter how events are displayed on the Event List, such as by event type or by Event list function keys time range, using the corresponding function key at the bottom of the screen. You can also show the threshold values or event details on the right pane for selected event entries.
- Page 206 Event List, continued Time Filter - allows you to specify the time/date range used to capture events. If you Event list function keys press Time Filter, a pop-up window appears as below providing you two ways to select (continued) the time/date range by which to display event entries: HDPQ-623 •...
- Page 207 CH 6/ View Event Data & Reports Unlike Standard event types where you can select more than one category to filter Event list function keys events, the Advanced categories are mutually exclusive of each other such that you can (continued) only filter and display events using one Advanced category state.
-
Page 208: Event Plot - Rms
RMS trigger parameters type of event by IEEE and IEC. Event characterization implemented in HDPQ Xplorer adheres to the IEEE 1159 and IEC 61000-4-30 Class A standards. RMS values are updated at half-cycle rates, calculated over one cycle and compared against limits on a cycle-by-cycle basis. - Page 209 CH 6/ View Event Data & Reports Event plot consists of the rms values during the event for the parameter on display. The View event plot - instrument gives you options to change and/or add parameters/channels to plot and view event details, among others. Action...
- Page 210 Event Plot - RMS, continued The following function keys are available to set up event plot - rms. Event plot -rms function keys Zoom to Cycle - toggles between narrowing the size of the display area that lets you view event rms in greater detail (Zoom to Cycle) and then unzoom the last step and return to the previous screen (Zoom Out).
- Page 211 CH 6/ View Event Data & Reports Stacked/Overlay - toggles between plotting rms data in a single axis plot or in Event plot -rms function keys separate, up to four axis plots. RMS Event Plot in Overlay allows you to view all voltage and current channels in the same, single axis plot.
- Page 212 Event Plot - RMS, continued Select Param - allows you to change and select parameters to plot. If you press Select Event plot -rms function keys Param, the Change Parameter/Channel window pops up showing groupings and (continued) arrangements of parameter/channel combinations. You have the option to enable/ disable channels for any of the single or multiple axis plot display.
- Page 213 CH 6/ View Event Data & Reports Event Details - an event detail screen is generated for each event. Event details show Event plot -rms function keys the triggered parameters and event data saved by the instrument, along with (continued) characterization information about the event.
-
Page 214: Event Waveform
Event Waveform Event Waveform HDPQ Xplorer allows you to view events in graphic waveform display. Use the Event Event waveform display Waveform icon available on the taskbar of select event screens (Event List or Event Plot - rms) to plot events in waveform display. - Page 215 CH 6/ View Event Data & Reports The following function keys are available to set up event waveform display. Event waveform function keys Zoom to Cycle - toggles between narrowing the size of the display area that lets you view event cycles in greater detail (Zoom to Cycle) and then unzoom the last step and return to the previous screen (Zoom Out).
- Page 216 Event Waveform, continued Stacked/Overlay - toggles between plotting event waveforms in a single axis plot or in Event waveform function keys separate, up to four axis plots. (continued) Event waveforms in Overlay allows you to view all voltage and current channels in the same, single axis plot.
- Page 217 CH 6/ View Event Data & Reports Show Values - splits the screen on the right pane to show values where the vertical Event waveform function keys cursor line is displayed. The horizontal black dotted lines indicate the upper and lower (continued) limits that trigger events.
- Page 218 Event Waveform, continued HDPQ Xplorer firmware is equipped with the algorithm that determines the origin of a Event waveform detail: Sag 3-phase voltage sag event. The sag origin or directivity can be Upstream or Directivity Downstream from the monitoring point. Direction is displayed in the Event Detail screen.
- Page 219 CH 6/ View Event Data & Reports In addition to determining directivity, the algorithm in HDPQ Xplorer firmware is also Event waveform detail: able to detect if 3-phase voltage and current waveforms experience a power factor Capacitor capacitor switching transient.
-
Page 220: Section C -Reports
Overview Section C Reports Overview You have the option to view and set up data via the Voltage Compliance Report, Report options Energy/Demand Audit Report, Harmonics Statistics Report or Mini-Report Viewer. Each report has their own method of presenting compliance data. Each also differs on the length of evaluation period to monitor compliance. -
Page 221: Voltage Compliance Report
Wizard Setup - Monitor Mode for the procedure on how to turn EN50160 Power Quality monitoring on. Statistical data is calculated based on the parameters required by EN50160 for View voltage compliance determining Voltage (QOS) compliance. HDPQ Xplorer displays the parameters in the report form of a compliance statistical bar chart. Action... Result... - Page 222 Voltage Compliance Report, continued View voltage compliance Action... Result... report (continued) STEP 2: (continued) Use the function keys at the bottom of screen to view voltage compliance summary, event statistical reports, and the min/ max values for power frequency and rms voltage. Refer to the particular section for information on each function.
-
Page 223: Compliance History
CH 6/ View Event Data & Reports Compliance History EN50160 provides a historical summary of the QOS compliance evaluations made. The QOS Status Summary standard monitoring period is one week, usually beginning Sunday at 00:00 (midnight). Any compliance evaluation performed in less than one week will receive an Evaluation Status marked as Incomplete, and Compliance marked as Undetermined. - Page 224 Compliance History, continued Compliance: Displays a PASS (green) or FAIL (red) mark if evaluation is done for a Compliance History table complete 7-day week period. Compliance displays an Undetermined (black) mark for (continued) incomplete periods. A PASS or FAIL compliance status is hyperlinked to the Compliance Statistical Bar Chart that shows the seven parameters required for determining compliance.
-
Page 225: Compliance Summary
CH 6/ View Event Data & Reports Compliance Summary Voltage Compliance Summary appears in the form of a statistical bar chart featuring the Summary bar chart seven parameters required for determining QOS compliance. The color of the bar indicates compliance status. A green bar indicates that the parameter is within compliance. - Page 226 Compliance Summary, continued Voltage Power Frequency: In case of a fault operation, parts of an interconnected system may compliance measurement become isolated. Compliance will be assessed over an observation period of one week, parameters by a statistical analysis carried out over the sequence of 10 seconds measurement. (continued) Frequency is represented by a single value and a single bar.
- Page 227 CH 6/ View Event Data & Reports Voltage Supply Voltage Unbalance: The unbalance of a three phase supply voltage consists of a compliance measurement loss of symmetry of the phase voltage vectors (magnitude and/or angle), created mainly parameters by unbalanced load. Compliance is verified when 95% of the sequence of valid 10 (continued) minute values are within the specified tolerance of normally 2% (in single phase/two phase supplies 3%).
- Page 228 Compliance Summary, continued Voltage Interharmonic Voltage: Interharmonic displays a cluster of bars, one for each phase. compliance measurement The color of each bar indicates the compliance status that is calculated by adding the parameters status of Total Interharmonic Distortion (TID) and Interharmonics 2 thru 25. The dotted (continued) red line indicates the trigger timestamp or start of event.
-
Page 229: En50160 Compliance Limits (Default)
CH 6/ View Event Data & Reports EN50160 Compliance Limits (Default) The table below indicates the limit numbers or range of values required for each Compliance limits parameter to pass QOS compliance and satisfy EN50160 standard, as the default limits. Parameter Limits for QOS Compliance to Pass Un = Low Voltage (LV) Supply nominal voltage, upper limit 1kV... - Page 230 EN50160 Compliance Limits, continued The table below indicates the limit numbers or range of values required for each Compliance limits parameter to pass Voltage (QOS) compliance and satisfy EN50160 standard. (continued) Parameter Limits for QOS Compliance to Pass Un = Low Voltage (LV) Supply nominal voltage, upper limit 1kV Uc = Medium Voltage (MV) Supply Characteristics - declared voltage, range 1kV to 35kV Harmonic voltage 10 minute mean rms values...
- Page 231 CH 6/ View Event Data & Reports The general approach of EN50160 is to express all voltage characteristics by reference Interharmonic compliance limit to the nominal voltage or declared voltage, as appropriate. The table below indicates values the Interharmonic Compliance Limit values in relation to the nominal voltage. Interharmonic Group Number Limit DC-1...
-
Page 232: Event Satistics
Event Statistics Event Statistics The EN50160 DISDIP (distribution of dips) table is based upon the event statistics EN50160 DISDIP calculated by EN50160. It includes the UNIPEDE DISDIP Statistics and the table for Transient Overvoltages. UNIPEDE DISDIP data is collected and saved on a weekly basis with the counts reset as the final save occurs. - Page 233 CH 6/ View Event Data & Reports The DISDIP table also includes those events of Transient type. From the UNIPEDE UNIPEDE DISDIP DISDIP statistics table, press Transient to display data for Transient Overvoltage as statistics table shown below. (continued) HDPQ-654 Transient Event Count: Transient phenomena are typically found in bin groupings such •...
-
Page 234: Min/Max Table For Power Frequency And Rms Voltage
Min/Max Table for Power Frequency and RMS Voltage Min/Max Table for Power Frequency and RMS Voltage The Min/Max table displays the minimum and maximum values for Power Frequency Min/Max table and RMS Voltage along with the time and date of occurrence. Maximum phase values of Rapid Voltage Change, Flicker, Supply Voltage Unbalance, and Harmonic are also displayed along with time and date of occurrence. -
Page 235: Energy & Demand Report
CH 6/ View Event Data & Reports Energy & Demand Report HDPQ Xplorer gives you the option to view the demand and energy report. The report Energy & Demand report list, as shown below, helps you monitor and manage energy consumption including interface utility costs. - Page 236 Energy & Demand Report, continued You have the ability to select from the following interval schedules on how often you Energy & Demand report want the instrument to monitor energy consumption and generate report files: interface (continued) Daily - when enabled, monitors data in 24-hour cycle and then starts a new report file. The instrument will append the filename for data collected every 24 hours.
-
Page 237: Harmonics Statistics Report
CH 6/ View Event Data & Reports Harmonics Statistics Report Allows you to set up a harmonic statistics report, based on the 3-second data Harmonics statistics report calculating the 95 and 99% values per IEC 61000-4-7 and IEEE 519. interface From the Event Data &... - Page 238 Harmonics Statistics Report, continued Start Today - refreshes the current screen with 31 days of reports starting with today's Function keys (continued) date and working backwards. Start Date - refreshes the current screen with 31 days of reports starting with the specified date and working backwards.
-
Page 239: Mini-Report Viewer
CH 6/ View Event Data & Reports Mini-Report Viewer The Mini-Report Viewer allows you to save the monitoring setups and/or status into an Create and view mini-report xml report file. You can also save the active image on screen and append it to the report as visual aid. - Page 240 Mini-Report Viewer, continued The Mini-Report Capture icon located at the middle of the HDPQ Xplorer front panel Mini-report setup and (below the LCD panel) allows you to save the active screen image to a Report File that capture is open. It appends the saved image to the open or active mini-report. If there is no report open, the instrument automatically creates a new mini-report file named after the site name augmented by a running counter.
-
Page 241: Appendix A - Optional Accessories
A P P E N D I X Optional Accessories Overview This appendix lists the optional accessories for HDPQ Xplorer. It covers the hardware Introduction accessories available and the Dranetz software application required to view event data in a computer. -
Page 242: Hardware Accessories List & Descriptions
Hardware Accessories List & Descriptions Hardware Accessories List & Descriptions Hardware Accessory Part Number accessories list TR Series Current Probes TR-2501B, 100mA to 1.2A 118283-G1 TR-2500B, 10A to 500A 118284-G1 TR-2510B, 1A to 10A8-G1 118285-G1 TR-2520B, 100A to 3000A 118286-G1 TR-2530B, 20A to 300A 118287-G1 TR-2540B, 10A to 1000A... - Page 243 APPENDIX A/ Optional Accessories Hardware Accessory Part Number accessories list (continued) Current Probe Accessories For Probes PR150/SP1B and PR1500/SP7B AC Adapter, 9VDC (Universal Adapter) PR9VUA RR/PS/4A Adapter Cable (allows the connection of 4 PR RR/PS/4A series probes to a single 9VDC source) Cable Assembly, TR Type CT Extension, 5FT TREXT5B Cable Assembly, TR Type CT Extension, 10FT...
- Page 244 Hardware Accessories List & Descriptions, continued Hardware Accessory Part Number accessories list (continued) Dranetz Reference Publications Field Handbook for Electrical Energy Management HB114415 Field Handbook for Power Quality Analysis HB114414-S Power Quality Analysis Textbook HB114416 PowerMeterStore 1.877.766.5412 www. .com Shop for Power Metering products online at:...
- Page 245 APPENDIX A/ Optional Accessories Several Dranetz current probes, the TR (B Series) probes and PR (B Series) probes, can Current probes be used with the HDPQ Xplorer. HDPQ Xplorer also supports the DRANFLEX (XLB and MHB Series) probes. Refer to Chapter 2 for actual photos of these probes.
- Page 246 Single Phase Measurement Cord: Allows measurement of a single phase circuit using a standard AC outlet 115V for US and 250V for European, UK, and Australian countries. USB Flash Drive: HDPQ Xplorer supports the use of a USB flash drive in its native External memory device format, without the need for any adapter.
- Page 247 Miscellaneous hardware weatherproof enclosure is designed to keep the HDPQ Xplorer and its cable connections in place. It is made of fiber glass and is intended for indoor and outdoor use. This enclosure is sturdy, lightweight, corrosion-resistant. It is able to withstand windblown dust, rain, splashing water, and ice formation.
-
Page 248: Software Accessories List & Descriptions
Data sessions collected Software accessories list by the HDPQ Xplorer must first be transferred to a computer so that they can be archived and/or viewed using Dran-View. The software version for use with the Dranetz HDPQ products is Dran-View V7.x. You are strongly advised to always keep the Dran-View and HDPQ Xplorer programs current with the latest version released by Dranetz. - Page 249 • Enhanced DFT features for selecting and analyzing harmonics For more information on the Dran-View software package, or for installation or Customer service and operating assistance with the Dran-View software, please contact the Dranetz Customer support Support at (732) 287-3680 or 1-800-372-6832. PowerMeterStore 1.877.766.5412...
- Page 250 This page intentionally left blank. A-10 PowerMeterStore 1.877.766.5412 www. .com Shop for Power Metering products online at:...
-
Page 251: Overview
A P P E N D I X Technical Specifications Overview In this appendix The following specifications are covered in this appendix. Topic See Page General Interfaces Measured Parameters Computed Parameters Parameter Settings in Each Monitoring Mode B-10 Current Probe Specifications B-12 PowerMeterStore 1.877.766.5412... -
Page 252: General
Event time clock displays to 1 msec resolution Time displayed in digital (12 or 24 hour) format Accurate to 60 seconds per month. Dranetz 8GB USB flash drive available as optional accessory USB Memory Device Use external UL/CE approved battery charger with international plugs. Mechanical On/... -
Page 253: Interfaces
Audible alarm of short (approximately 0.1 second) or long (approximately 1 second) Alarm duration to call attention to an error condition or event trigger, respectively. Communication Connect to the HDPQ Xplorer mainframe using either of the following: • Ethernet IP Connection • Wireless (WiFi) Network Connection •... -
Page 254: Measured Parameters
Type: 4 full differential, DC coupled, galvanically isolated to 1kV Current Channels A,B, C, D Input Range: 10 - 200% of Rated Probe Input (Dranetz probes) Input impedance: 340k ohm minimum, Input to Input Channels A,B,C, D crest factor: Maximum of 3 at full scale RMS Accuracy: ±0.1% of Reading ±0.05% Full Scale plus Probe Accuracy, 9KHz bandwidth (1 second... - Page 255 User selectable based on nominal frequency selection. Frequency For Dranetz models HDPQ Xplorer, HDPQ Guide, HDPQ Visa: • 30 - 70 Hz default, with up to 30% Vthd, 60-1000Vrms • 15 - 30 Hz Accuracy: ±10 mHz of reading For Dranetz model HDPQ Xplorer-400: •...
-
Page 256: Computed Parameters
Computed Parameters Computed Parameters The computations below apply to single channel parameters. Single Channel Parameters Note that 0 = Phase Angle of Voltage, while 0 = Phase Angle of Current. Average of the instantaneous power samples taken as the product of voltage and current True Average Power samples. - Page 257 APPENDIX B/ Technical Specifications Calculated using the True Average Power divided by the Apparent Power. See Note True Power Factor below for sign information. WATT Calculated using cosine of the phase angle between the fundamental frequency Displacement Power Factor components of voltage with respect to current (0 = 0 ).
- Page 258 Computed Parameters, continued The computations below apply to three phase wye configuration. Totals Totals for split phase can be determined by eliminating phase C (i.e. split phase WATT = WATT + WATT Power Total WATT WATT WATT WATT Fundamental Power Total...
- Page 259 APPENDIX B/ Technical Specifications See Note on page B-7 for sign information. True Power Factor, Arithmetic Total WATT Arithmetic Tot Arithmetic Tot See Note on page B-7 for sign information. True Power Factor, Vector Total WATT Vector-Tot Vector Tot See Note on page B-7 for sign information. Displacement Power Factor, Arithmetic Total...
-
Page 260: Parameter Settings In Each Monitoring Mode
Parameter Settings in Each Monitoring Mode Parameter Settings in Each Monitoring Mode The following table lists the default settings for the threshold parameters in each Setup parameters monitoring mode. Standard Motor Fault Long-term Continuous EN50160 Motor Energy Power Recorder Data Quality Audit Parameters... - Page 261 APPENDIX B/ Technical Specifications The following table lists the default settings for the threshold parameters in each Setup parameters monitoring mode. (continued) Standard Motor Fault Long-term Continuous EN50160 Motor Energy Power Current Recorder Data Quality Audit Timed Parameters Quality Inrush Logging Recording IEC / IEEE...
-
Page 262: Current Probe Specifications
Current Probe Specifications Current Probe Specifications Probe guidelines To achieve the rated accuracies, follow these guidelines: • The conductor must be at a right angle to the probe • The conductor must be centered in the probe core • The jaw contact surfaces must be clean and properly aligned. TR SERIES PROBE SPECIFICATIONS TR Series probes... -
Page 263: Dranflex300Mhb Series Probes
APPENDIX B/ Technical Specifications DRANFLEX 300MHB SERIES PROBE SPECIFICATIONS DRANFLEX 300MHB Series Type: Flexible probes Installation Category: 1000 VRMS, CAT III, Pollution Degree 2 Model Range Amplitude Phase Frequency Maximum Accuracy Accuracy Range Conductor ± Size DRANFLEX 0.3A to 0.3A to 3A 1% rdg, 1°... - Page 264 This page intentionally left blank. B-14 PowerMeterStore 1.877.766.5412 www. .com Shop for Power Metering products online at:...
-
Page 265: Appendix C - Battery Specifications And Replacement Procedure
A P P E N D I X Battery Specifications and Replacement Procedure Overview The internal battery pack used in HDPQ Xplorer functions as the primary power source Introduction and UPS. Always charge the battery fully before using the unit. HDPQ Xplorer will fully charge its internal battery in four (4) hours. -
Page 266: Battery Specifications
Suggested replacement interval: Two years Part Number: BD-HDPQ (118348-G1) NOTE: The length of time that the HDPQ Xplorer can operate on the battery pack degrades over the life of the batteries and the number of charge/discharge cycles. PowerMeterStore 1.877.766.5412... -
Page 267: Battery Safety Precautions
HDPQ Xplorer is equipped with an internal battery charger circuit. Do not attempt to charge the batteries with an external charger other than the Dranetz battery charger, since improper charging could cause battery explosion. -
Page 268: Battery Pack Replacement
Disconnect voltage and current probes from the circuit and the HDPQ Xplorer’s rear panel. On the bottom of the HDPQ Xplorer, push the tab to release the battery cover. Refer to the diagram shown on page C-5. Remove the cover. - Page 269 APPENDIX C/ Battery Specifications and Replacement Procedure Battery removal diagram PowerMeterStore 1.877.766.5412 www. .com Shop for Power Metering products online at:...
- Page 270 This page intentionally left blank. PowerMeterStore 1.877.766.5412 www. .com Shop for Power Metering products online at:...
- Page 271 The following parts are easily replaced by the operator and do not require special tools Introduction or access to the interior of the unit. Call Dranetz Customer Service at (732) 287-3680 or 1-800-372-6832 to order any of To order parts the following parts.
- Page 272 This page intentionally left blank. PowerMeterStore 1.877.766.5412 www. .com Shop for Power Metering products online at:...
-
Page 273: Appendix E - Common Circuit Connections
A P P E N D I X Common Circuit Connections Overview If you are making power measurements, follow these diagrams so that your ABC Who should read this section values are calculated correctly. WARNING Death, serious injury, or fire hazard could result from improper connection of this instrument. - Page 274 Overview, continued El personal cualificado que trabaja encendido o acerca a los conductores eléctricos energizados expuestos debe seguir prácticas y procedimientos relacionados seguridad aplicable del trabajo incluyendo el equipo protector personal apropiado en conformidad con el estándar para los requisitos de seguridad eléctricos para los lugares de trabajo del empleado (ANSI/NFPA 70E- 2012) de los E.E.U.U.
- Page 275 DO NOT install any connection of the HDPQ Xplorer to live power lines. • Connections must be made to the HDPQ Xplorer first, then connect to the circuit to be monitored. • If the equipment is used in a manner not specified in this User Guide, the protection provided by the equipment may be impaired.
- Page 276 Overview, continued This section contains diagrams of both voltage and current probe connections that are Voltage and current required when power measurements are to be made. connections Voltage: Voltage probes are connected to the individual source or load line and are referenced to the return (common) line voltage probe connection for greatest accuracy.
-
Page 277: Verifying Voltage And Current Connections
APPENDIX E/ Common Circuit Connections Verifying Voltage and Current Connections Correct voltage and current connection of single phase, split phase, or polyphase Introduction connections can be verified using phasor diagrams. Phasor diagrams are graphic representations that show the magnitude and angular relationship of voltage and current for each phase of a monitored connection. - Page 278 HDPQ Xplorer is able to display diagrams of wiring configurations to assist you in the selection of circuit type appropriate for your application (see Chapter 4 Setup Monitoring - Circuit Type Selection).
-
Page 279: Interconnect Jumpers
Refer to Appendix A Optional Accessories for more information on the list of available wire markers. WARNINGS DO NOT EXCEED 600 VRMS when using Dranetz P/N 114013-G1 interconnect jumpers. For circuit configurations above 600VRMS each voltage channel input is to be individually connected to the HDPQ instrument with the supplied 1000V CAT III cables and safety clips ONLY. -
Page 280: Single Phase
Single Phase Single Phase When making voltage connections to a single phase circuit use channel A differential Introduction inputs as shown below. The figure also shows voltage connection using channel D as a differential input for measuring neutral to ground voltage. Neutral to ground measurements are important but optional. -
Page 281: Split Phase
APPENDIX E/ Common Circuit Connections Split Phase When making split phase measurements, use both channels A and B for voltage and Introduction current connections. The neutral is chosen as the reference for measurement purposes. The figure also shows voltage connection using channel D as a differential input for measuring neutral to ground voltage. -
Page 282: Phase, Four Wire Wye
3 Phase, Four Wire Wye 3 Phase, Four Wire Wye Channels A, B, and C are connected to voltage and current probes. The neutral is Introduction connected to common and is the reference for the three channels. The figure also shows voltage connection using channel D as a differential input for measuring neutral to ground voltage. -
Page 283: Phase (Floating Or Grounded) Delta
APPENDIX E/ Common Circuit Connections 3 Phase (Floating or Grounded) Delta In this power connection, the HDPQ Xplorer uses voltage channels A, B, and C as Introduction differential inputs with channel A using source voltage A-B, channel B using B-C, and channel C using C-A as the reference. -
Page 284: Phase 2-Watt Delta
3 Phase 2-Watt Delta 3 Phase 2-Watt Delta The figure below shows the 3 Phase 2-Watt delta connection using phase channels A- Introduction B-C. Current probes are connected to channels A and B. Neutral to ground measurements are important but optional. Connection diagram HDPQ-905... -
Page 285: Generic Circuit
APPENDIX E/ Common Circuit Connections Generic Circuit In the Generic circuit connection, the HDPQ Xplorer uses voltage channels A, B, C, Introduction and D as differential inputs. Current probes are connected to channels A, B, C, and D. Connection diagram... -
Page 286: 1/2 Element Without Voltage Channel B
2 1/2 Element Without Voltage Channel B 2 1/2 Element Without Voltage Channel B Channels A and C are connected to voltage. Current probes are connected to channels Introduction A, B and C. The neutral is connected to common and is the reference for the three channels. -
Page 287: 1/2 Element Without Voltage Channel C
APPENDIX E/ Common Circuit Connections 2 1/2 Element Without Voltage Channel C Channels A and B are connected to voltage. Current probes are connected to channels Introduction A, B and C. The neutral is connected to common and is the reference for the three channels. -
Page 288: Connecting To A Potential Transformer (Pt
Follow the safety precautions listed on page E-3 when making all potential transformer Safety Precautions connections. Potential Transformers are not manufactured by Dranetz and are discussed here for NOTE informational purposes only. A potential transformer (PT), also referred to as a voltage instrument transformer,... - Page 289 HDPQ Xplorer when voltage computations are performed. The PT scale factor is usually mounted on the PT assembly and is entered into the HDPQ Xplorer on the scale factors screen. Refer to the PT manufacturer’s literature for the scale factor of the device you are using.
-
Page 290: Connecting To A Current Transformer (Ct
The reduction, or step-down ratio, is stated as a scale factor that is used by the HDPQ Xplorer to step-up the measured value to its original value. There are single-phase CTs and polyphase CTs dependent on the source transformer Types of CTs used. -
Page 291: Appendix F - Pq Parameter Calculations
A P P E N D I X PQ Parameter Calculations Measuring and monitoring power quality (PQ) parameters require several calculations, Calculations i.e. RMS values of voltage and current, etc. Depending on the type of parameter measured, calculations are performed using samples of monitored waveforms or using every sample cycle for quick disturbance detection. -
Page 292: Calculations
PQ Parameter Calculations, continued Calculations (continued) Description Abbreviation Wiring Configuration Formula Units Precision RMS Deviation Vcycw-a Single phase Volts +/- 0.2% of Vrms(cycle 1) - Vcycw-b Split phase Reading * Vrms(cycle 2) Subtraction of 1 Vcycw-c 15 KHz BW cycle RMS from Vcycw-d adjacent cycles. - Page 293 APPENDIX F/ PQ Parameter Calculations Calculations (continued) Description Abbreviation Wiring Configuration Formula Units Precision Volts RMS of Vfnd-a Single phase Volts +/- 0.2% of fundamental Vfnd-b Split phase Reading * Vfnd-c 15 KHz BW Derived from DFT Vfnd-d is calculated from Vfnd-ab Measured for Delta Vfnd-bc...
- Page 294 PQ Parameter Calculations, continued Calculations (continued) Description Abbreviation Wiring Configuration Formula Units Precision Amps RMS Irms-a Amps +/- 0.1% of Derived from Irms-b Reading 200mS (10/12 Irms-c +/- 0.05% cycles 50/60 Hz) Irms-d of FS where n=512 samples Aggregated to 9 KHz BW selected interval Amp ½...
- Page 295 APPENDIX F/ PQ Parameter Calculations Calculations (continued) Description Abbreviation Wiring Configuration Formula Units Precision Phase of Ideg-a Degree +/- 1° fundamental Ideg-b averaged over Ideg-c where n=1 for 1 har- 200ms. Ideg-d monic. Derived from DFT Averaged over 10/12 sine expansion cycles output.
- Page 296 PQ Parameter Calculations, continued Calculations (continued) Description Abbreviation Wiring Configuration Formula Units Precision Residual Current Ires Delta or Wye only Amps 0.3 % of RMS of Reading +/- 0.15% of FS where n=512 samples Net Current Inet Wye only Amps 0.4 % of RMS of Reading...
- Page 297 APPENDIX F/ PQ Parameter Calculations Calculations (continued) Description Abbreviation Wiring Configuration Formula Units Precision VA Arithmetic VAfa-tot Wye and Neutral based 0.2 % of Fundamental Total measurements Reading +/- 0.05% of FS True Power Factor TPF-a Wye, uses measured None 1% of values Reading...
- Page 298 PQ Parameter Calculations, continued Calculations (continued) Description Abbreviation Wiring Configuration Formula Units Precision Total Arithmetic DPFa-tot None +/- 1% Displacement Power Factor VA derived from DFT fundamenta Total Vector DPFv-tot None +/- 1% Displacement Power Factor VA derived from DFT fundamental Total Voltage HVthdfund-a...
- Page 299 APPENDIX F/ PQ Parameter Calculations Calculations (continued) Description Abbreviation Wiring Configuration Formula Units Precision Total Voltage HVthdrss-a +/- 5% Harmonic HVthdrss-b Distortion Root HVthdrss-c Sum of Squares Per 61000-4-7 (RSS) HVthdrss-d HVthdrss-ab HVthdrss-bc HVthdrss-ca Total Voltage Inter HVtidrss-a +/- 5% Harmonic HVtidrss-b Distortion Root...
- Page 300 PQ Parameter Calculations, continued Calculations (continued) Description Abbreviation Wiring Configuration Formula Units Precision Total Current HIehd-a +/- 5% Even Harmonic HIehd-b Distortion *100 HIehd-c Normalized to the fundamental HIehd-d Per 61000-4-7 Telephone HVtiffund-a None +/- 1% Influence Factor, HVtiffund-b normalized to TIF = HVtiffund-c Fundamental...
- Page 301 APPENDIX F/ PQ Parameter Calculations Calculations (continued) Description Abbreviation Wiring Configuration Formula Units Precision Total Harmonic Huspower-a Watts +/- 5% unsigned power Huspower-b Huspower-c Huspower-d Total Harmonic Hspower-a Watts +/- 5% signed power Hspower-b Hspower-c Hspower-d Transformer K HIxfmrk-a None +/- 5% Factor HIxfmrk-b...
- Page 302 PQ Parameter Calculations, continued Calculations (continued) Description Abbreviation Formula Wiring Configuration Units Precision Volts Over- HVodev-a +/- 1% Deviation HVodev-b HVodev-c HVodev-d If result is < V then HVodev-ab value is 0 HVodev-bc HVodev-ca Where: is Declared Nominal Voltage is 200ms RMS Per 61000-4-30 User Specified Volts...
- Page 303 APPENDIX F/ PQ Parameter Calculations Calculations (continued) Description Abbreviation Wiring Configuration Formula Units Precision Individual Inter Volts Volts +/- 5% Computed according Harmonic to 61000-4-7 using Voltages h:h+1 DFT over 200mS 0-127 window aggregated to h0=DC selected journal inter- val as RMS Individual Inter Current Amps...
- Page 304 PQ Parameter Calculations, continued Calculations (continued) Description Abbreviation Wiring Configuration Formula Units Precision Short Term Pst-a None +/- 5% Compliant to 61000- Flicker Pst-b 4-15 Pst-c Pst-ab Pst-bc Pst-ca Long Term Flicker Plt-a None +/- 5% Compliant to 61000- Plt-b 4-15 Plt-c Plt-ab...
- Page 305 APPENDIX F/ PQ Parameter Calculations Calculations (continued) Description Abbreviation Wiring Configuration Formula Units Precision VAR coincident VARcoW VAR Demand at time +/- 0.5% with Peak Watts of Peak Watts, during Demand a Demand interval Average True PFavgcoW None +/- 0.5% Average True PF at Power Factor time of Peak Watts,...
- Page 306 PQ Parameter Calculations, continued Calculations (continued) Description Abbreviation Wiring Configuration Formula Units Precision Energy Watt- WHr-a Sum of Watt readings Watt-h +/- 0.22% Hours each second scaled to WHr-b Watt-Hours and WHr-c accumulated into user WHr-d selected interval. WHr-tot Energy VAR- VARHr-a Sum of VAR readings VAR-h +/- 0.22%...
Need help?
Do you have a question about the hdpq xplorer and is the answer not in the manual?
Questions and answers