Table of Contents
Advertisement
Quick Links
Advertisement
Table of Contents

Related Manuals for GSSI SIR 3000


Summary of Contents for GSSI SIR 3000
- Page 2 Copyright© 2003-2015 Geophysical Survey Systems, Inc. All rights reserved including the right of reproduction in whole or in part in any form Published by Geophysical Survey Systems, Inc. 40 Simon Street Nashua, New Hampshire 03060-3075 USA Printed in the United States SIR, RADAN and UtilityScan are registered trademarks of Geophysical Survey Systems, Inc.
- Page 3 Geophysical Survey Systems, Inc. hereinafter referred to as GSSI, warrants that for a period of 24 months from the delivery date to the original purchaser this product will be free from defects in materials and workmanship. EXCEPT FOR THE FOREGOING LIMITED WARRANTY, GSSI DISCLAIMS ALL WARRANTIES, EXPRESS OR IMPLIED, INCLUDING ANY WARRANTY OF MERCHANTABILITY OR FITNESS FOR A PARTICULAR PURPOSE.
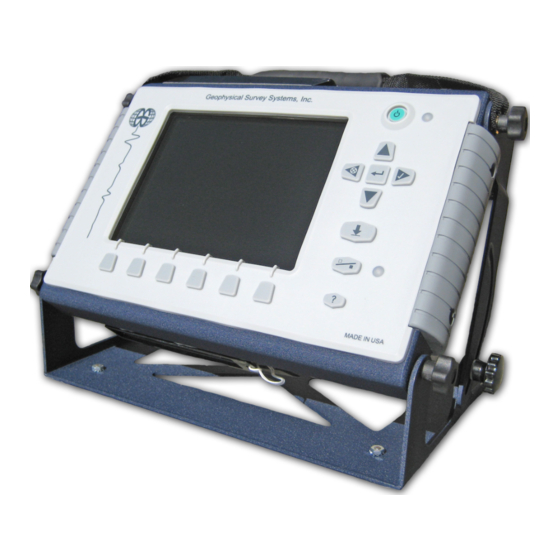
- Page 7 Your choice of antenna, cables, and post-processing software is available for an additional purchase. The SIR 3000 is a lightweight, portable, single-channel ground penetrating radar system that is ideal for a wide variety of applications. The various components of the SIR 3000 are described below.
- Page 8 On the back edge of the unit, the SIR 3000 has six connectors and one slot for the memory card. The five top-row connectors are, from left to right: AC Power, Serial I/O (RS232), Ethernet, USB-B, and USB-A.
- Page 9 This is a standard serial connection that can be used to establish communication between the SIR 3000 and a GPS. Please see Chapter 7: Using a GPS with your SIR 3000 for additional information. This port is also used to connect the serial lead from the StructureScan Optical barcode reader cart to the SIR 3000.
- Page 10 The keypad on the front of the unit has fifteen (15) buttons and two indicator lights. This button turns the SIR 3000 on and off. To start up the system, insert a battery or connect AC power and push the power button.
- Page 11 Use of a Model 3207 pair (100 MHz) or a Model 3200 Multiple Low Frequency antenna without a TR fiber optic link will cause damage to the SIR 3000’s transmit circuitry. Always be sure to use a Model 570 Fiber Optic Transmit Link with the Model...
- Page 13 GPR applications. If desired, these 2-D profiles can later be transferred to a PC for processing in GSSI’s RADAN™ post-processing software. Hardware setup for the SIR 3000 is very simple. We will assume the 400 MHz (Model 5103) antenna for this example, but the hardware connections are the same for other GSSI antennas, and the cable connections are clearly marked.
- Page 14 SURVEY port on the top of the antenna. Be sure that the triangular plate protecting the survey wheel encoder faces down. Connect power source (battery or AC) to the SIR 3000 and push the power button to turn on the system.
- Page 15 After the SIR 3000 boots up, you will see the introductory screen. There will be 6 icons positioned over the Function Keys. The first one is TerraSIRch. Pushing the Mark button switches your desired units between English and Metric. TerraSIRch mode gives you complete control over all data collection parameters. Quick Start guides are available for StructureScan and UtilityScan.
- Page 16 SIR 3000, COLLECT, PLAYBACK, and OUTPUT, as well as the SYSTEM menu used to change system parameters. The SIR 3000 has four main system menus, Collect, Playback, Output, and System. We will first look briefly at the System menu. If you are using your SIR 3000 for the first time or if you need to change some system parameters, you should enter this menu first.
- Page 17 These are named SETUP01 to SETUP16. SETUP00 is a default setup that contains the parameters the system was collecting the last time that it was used. Think of this as the location in which your files are stored on the SIR 3000. There are two basic types of paths: Common and User-defined.
- Page 18 Use this selection to set the system’s internal clock to the current date and local time. The SIR 3000 will attach this information to each radar profile you collect. This information is saved and will not be lost each time you turn the system off or remove the battery.
- Page 19 The COLLECT menu is similar to the Collect Setup mode on the older GSSI SIR 2 and SIR 2000. If you are familiar with those systems, you will notice a lot of similarities here. Under COLLECT, there are five main sub-menus that can each be accessed by pushing the Down arrow to highlight the sub-menu, then the Right arrow to see additional menus inside the sub-menu.
- Page 20 If you are using the Acumen SDR Data Bridge/Logger purchased from GSSI, attach the serial lead from the GPS to the Data port and attach the lead from the SIR 3000 to the Config port, and then select SDR from the list under RADAR > GPS.
- Page 21 8-bit data. 16-bit data profiles are twice as large in terms of computer storage. RANGE is the time window in nanoseconds (ns) that the SIR 3000 will record reflections. The time range is proportional to depth viewed because a longer range will allow more time for energy to penetrate deeper and give reflections from deeper down.
- Page 22 This is done to avoid a negative gain slope. The SIR 3000 is only displaying about 25% of the amplitude range. This means that even if your data appears slightly clipped, the SIR 3000 is likely still recording the full amplitude range of the reflection.
- Page 23 100% of our data and most importantly, the ground surface to perform a depth calculation. The number here is nanoseconds from trigger pulse inside the SIR 3000. If you need to adjust this parameter, use caution not to lose that direct coupling wave.
- Page 24 LP_IIR HP_IIR LP_FIR HP_FIR STACKING BGR_REMOVAL The first four are frequency filters and the values are all expressed in MHz. The two types of filters that we are using are the Finite Impulse Response (FIR), and Infinite Impulse Response (IIR).
- Page 25 If you want to review the data you just collected or access any of the Playback functions, push the Down arrow to highlight the particular menu choice. If you would like to review a previously collected file, pushing the Playback function key will bring up a window that lists stored data files.
- Page 26 The input number here is scans, so in order to use this filter, find the length in scans of the feature that you want to remove and put that number into the system. Features of this size or larger will be removed from the data.
- Page 27 Transfer to a PC will be controlled by the external computer through Microsoft ActiveSync, while transfer to the removable Flash card can be done using the SIR 3000’s buttons. For detailed instructions on data transfer, please see Chapter 5: Data Transfer and File Maintenance.
- Page 28 The third function is during the Collect Run mode (1 data window). Pushing this button while collecting data stops data collection, brings up the Save File dialog, then immediately opens another data file collection. : Pushing this button from the Collect Setup mode (3 display windows, COLLECT in the top- left corner), brings up the File Open window.
- Page 29 Pushing this in Playback mode will toggle the system from Stop to Run and the selected file will scroll across the screen to the end and bring up crosshairs. Clicking the button after the file has stopped will cause it to scroll through again. Clicking this button in Collect Run will stop the current data and bring up the File Save dialog.
- Page 30 This function will take a screen shot of the data file and save it as a bitmap (.bmp) in your working directory. Although bitmaps cannot be viewed on the SIR 3000, you can transfer them to a PC and view, email, or print them later. Bitmaps do not require any special software to view on the PC and anyone with a PC or Mac will be able to view them.
- Page 31 You can collect up to 70 files before you need to power down the system and restart it. If you collect more than 70 without restarting the system, the SIR 3000 will hang up and you will lose that data profile that you are collecting and will need to restart the system.
- Page 32 If you are using the 1500 MHz or the 1600 MHz antenna with the blue metal minicart, use setup 1500BlueCart or 1600BlueCart. Make sure that MODE is set to DISTANCE. Once you select DISTANCE, the survey wheel calibration dialogue will come up. You can either enter the factory setting (for smooth terrain) or calibrate it to local conditions.
- Page 33 4030 ticks/meter 1229 ticks/foot If you set the horizontal units on the SIR 3000 (under SYSTEM > UNITS > DISTANCE) to inches or cm, you will need to input the calibration default in ticks/inch(cm). For inches, divide the ticks/ft by 12 and for cm, divide by 100.
- Page 34 For utility and tank location, we usually recommend 6-24/ft. While this is more than the minimum rule of thumb, GSSI has found these densities to work well in the widest variety of situations. The image below shows hyperbolas from objects of similar size. The hyperbolas vary in size because, due to the spreading of the radar signal, a deeper target shows reflections in more scans than a shallow one, The thin, red line superimposed over the scan in the O-Scope window is the gain curve.
- Page 35 The system is in a paused state, so with that dialog open, move the system to the beginning of the next profile line and then click Right arrow to save. The SIR 3000 will save the data and then begin collecting another profile.
- Page 36 The scan spacing (horizontal resolution) of Time-based data profiles is a function of the speed that the system is collecting data and the rate that the antenna is moving over the survey surface. The higher you set the RATE (in scans/second) and the slower you move the antenna, the denser the data will be. Time-based data has no real distance tag, so the software has no idea how far you actually traveled.
- Page 37 The profile will be saved and can be viewed in Playback mode. The third data collection mode on the SIR 3000 is for Point data collection. This mode is most useful for deep geophysical investigations or data collection over difficult, broken terrain.
- Page 38 Point data is typically collected with some static stacking. The default value here is 64. The system will take 64 scans at that location and average them together to output a single scan. This is done to minimize high-frequency, random noise. Position the antenna at the first data point station and press Run/Setup.
- Page 39 1 B3D file. The Grid was named GRID__006.3DS. This grid name was automatically generated by the SIR 3000. : The example window is not a SIR 3000 screen image. It is an image from a PC after the data were downloaded.
- Page 40 So, to sum up: each grid you collect is a separate folder. Inside that folder are all of your radar data lines (DZT files). Also inside that folder is the B3D file which you will open in RADAN. Once RADAN reads that B3D file, it will know which of your data lines to put where.
- Page 41 The SIR 3000 uses this coordinate to figure out the size of your grid. In the menu tree, the numbers for both the X and Y are 20.
- Page 42 Under SYSTEM > SETUP > RECALL, find the appropriate Setup. Highlight the one that you want and click the Right arrow to load it. Note that the SIR 3000 will reinitialize. Wait for the data to start scrolling across the screen before continuing. Please see Appendix E for a list of saved Setups. If you do not wish to use one of the saved Setups, you should still recall the Setup that closely matches your antenna’s...
- Page 43 The ‘MARK TO START’ message will turn into a ‘COLLECT DATA’ message. Move the antenna along your survey line. You will see data scrolling across the screen. Once the SIR 3000 has collected enough data (based on your setup parameters), it will stop recoding automatically. Reposition your antenna at the...
- Page 44 RUN/STOP button. Collect the profile line. Once you have gone the distance that you specified in the Setup, the SIR 3000 will stop collecting data automatically. It will save the file and automatically increment to the next line.
- Page 45 Depending on the size of your collected area, this could take anywhere from seconds to minutes. Be patient. The SIR 3000 will also process the data by applying a background removal filter to take out constant horizontal banding (including the direct wave). If you have the Migration process turned on under the PLAYBACK >...
- Page 46 The C-Scan display has three main functions: Select Depth, Select Profile, and Select X/Y Position. You toggle between each one by clicking Enter. When you click Enter, the window chooser arrow changes. This arrow shows you which window (Linescan or C-Scan) to browse with the arrow keys. ...
- Page 47 This mode allows you to find out how deep something is and to change the display depth of the C-Scan window. You will notice that the Window Chooser arrow is pointed to the Linescan Window on the right. If your scan is 12” (or up to 50 cm) deep, then it will be divided into 12 equal slices.
- Page 48 The accuracy of the depth reading is 100% dependent on your accurate guess of the dielectric. Remember that dielectrics in soils often change with depth, and since the SIR 3000 is performing a constant velocity migration, then it will not take those changes into account.
- Page 50 This process will not delete the data from the internal memory. Remove Compact Flash card from the SIR 3000 and insert it into a USB CF card reader or similar and attach the card reader to your computer. You can now access the data as if you had another disk...
- Page 51 If you get an Error #3, this indicates that the SIR 3000 has not recognized the card. Pop the card out, wait 5 seconds and reinsert. This choice is available to allow you to use a USB ‘memory stick’ to transfer your data.
- Page 52 The section briefly describes four out of the six operation modes for the SIR 3000. These modes are more limited in their customization because they are meant for specific applications or to collect data for on- screen target location as opposed to post-processing. As noted earlier, TerraSIRch mode allows you full reign over all collection parameters.
- Page 53 This mode is for collecting very high-resolution 3D data over a concrete slab or wall with the 2.6 GHz, 1.6 GHz, 1.5 GHz or 1.0 GHz antenna and GSSI’s patented scan pad. This will produce a 3D cube of data that can be viewed in planview at differing depths so as to note clear locations for coring and cutting.
- Page 54 Select the appropriate soil type from the list of 4 presents (Soil Type 1-4). This will set your dielectric and affect your maximum depth of penetration. Then select your scans per unit from the list of presets. GSSI recommends a scan density of either 12 or 18 per foot, or 25 per meter.
- Page 55 This mode is optimized for 2D profiling of shallow geological features such as high bedrock, sediment bedding, water tables, etc. It is also useful for archaeological profiling. GeologyScan works with the 400 MHz, 270 MHz, 200 MHz, and 100 MHz antennas, though only the 400 and 270 MHz are small enough to be mobilized on the survey cart.
- Page 56 4 is the minimum number of satellites you can use. When you start a data profile, the SIR 3000 will capture a GPS coordinate and place it in the file header. It will do the same when you stop the data file and save it. These coordinates will be visible when you view the file header in RADAN 5.0 or higher.
- Page 57 This is a brief description of GPS and how to use it with our SIR 3000. GPS information gets attached to our data two different ways. First, the start and end positions are stored in the header of each *.DZT file.
- Page 58 We have chosen to go with a GPS Datalogger, mostly because it is so simple. No buttons, nothing to control and everything is handled automatically inside the SIR 3000. Yet it produces results as good as the other consumer-grade, WAAS enabled units.
- Page 59 The G30L was an optional accessory to our SIR 3000. It is no longer available new and this section is presented for those who had previously purchased the G30L. It is a GPS datalogger with no external controls. It will store up to 15 hours of GPS data that can be downloaded at any time. The only caveat is that once it fills its memory, it stops.
- Page 60 Our Binary file extension is *.TMF. The tracklog output of your GPS software will have a unique extension. (that’s why we prefer the Oziexplorer *.plt file so that all the various GPS’s can output data in one format). based data acquisition. Match GPS Start/Stop position/time with records in the GPS log.
- Page 61 This information is being provided for informational use only. It is not supported by GSSI technical support and is only provided for those users who are already comfortable working in a C programming environment. struct tagRFDate // File header date/time structure unsigned sec2 : 5;...
- Page 62 struct tagRFHeader // Offset in bytes short rh_tag; // 0x00ff if header, 0xfnff for old file short rh_data; // constant 1024 (obsolete) short rh_nsamp; // samples per scan short rh_bits; // bits per data word (8 or 16) short rh_zero; // Offset (0x80 or 0x8000 depends on rh_bits) FLOATBYTE(rhf_sps);...
- Page 63 struct RGPS // GPS record/system time SYNC char RecordType[4]; // “GGA” DWORD TickCount; // CPU tick count double PositionGPS[4]; // Latitude (positive if 'N'), //Longitude (positive if ‘E’), // Altitude, FIXUTC struct RDMT // Distance mark/system time SYNC DWORD ScanNumber; // 24 bit scan number DWORD TickCount;...
- Page 64 Transmit Rate: Up to 100 KHz The SIR 3000 will not work with the short, orange attenuated control cable that was sold with the SIR 2000. The SIR 3000 will only work with non-attenuated cables (blue or black in color).
- Page 65 5-8000 nanoseconds full scale, user selectable Manual or automatic gain, 1-5 points, (-20 to +80 dB) Vertical: Low-Pass and High-Pass IIR and FIR Horizontal: Stacking, Background Removal SIR 3000 control unit Transit case AC adaptor User manual ...
- Page 66 As the old saying goes: “Garbage in, Garbage out”. The biggest single factor affecting the quality of your data and your ability to make decisions based on it, is the accuracy of your data collection. This appendix has instructions and helpful hints to get you into the habit of collecting quality data from the beginning. While many of these points are only relevant to data collection over the ground, as opposed to concrete structures, you may find this section helpful no matter what your application.
- Page 67 If you are working with concrete, try to make sure that the concrete has had some curing time. Three months is usually adequate for a standard slab on grade, while a suspended slab may cure faster. The best solution is to practice on slabs of different ages so that you have a first-hand feel of the way they will look.
- Page 68 For utility and tank location, we usually recommend 6-24/ft. While this is more than the minimum rule of thumb, GSSI has found these densities to work well in the widest variety of situations. The image above shows hyperbolas from objects of similar size. The hyperbolas vary in size because, due...
- Page 69 Lower frequency antennas, like the 200 MHz and 400 MHz, will sometimes not image targets close to the surface very well. While not strictly a ‘dead zone’ you should be aware that it may be difficult (but not impossible!) to see targets in this area. As a general rule of thumb, 2.6 GHz 0.5 (1) this zone is equal to the spacing between the transmitter and receiver...
- Page 70 Collecting data for 3D imaging obviously takes more time than 2D collection. While the SIR 3000 makes it faster and easier than it has ever been before, it can still add significant time (and cost) to a job. It also requires some software processing to produce an interpretable image.
- Page 72 Mobilizing your system on the GSSI Model 623 survey cart allows you to cover ground much more easily and conveniently than with the conventional system configuration described in Chapter 2.1. The cart can accommodate the 400 MHz, 900 MHz, 1.5/1.6 GHz and 2.6 GHz antennas. It also incorporates a survey wheel for high-precision distance measurements.
- Page 73 Unfold the cart frame and insert the black tips of the top assembly into the receivers on the front wheel fork. Secure with the attached pin. Squeeze the silver wheel-lock clamps, and insert the wheel shaft into the axle. It will slide all the way in and lock securely. To remove wheels, squeeze the wheel-lock clamp again and pull the wheel straight out.
- Page 74 Ensure that the survey wheel encoder is correctly positioned on the inside of rear left wheel and that the survey wheel is making contact with the tire’s rim. Place the antenna into the white plastic tub and secure with the attached straps. If you are using the cart system with the 1.5 GHz (Model 5100) antennas, place the antenna in the tub, and then sandwich it between the bottom of the tub and the...
- Page 75 Beginning with the top 2 holes, attach the SIR 3000 with the thumb screws. Pivot the SIR 3000 back and forth to get the most comfortable viewing position, and screw in the bottom 2 thumb screws. Be sure to only hand- tighten the screws.
- Page 76 Attach the male end of the control cable to the antenna port on the back of the SIR 3000. Be sure to only hand-tighten this connection as over tightening may cause system damage. Collect the front mount kit parts. Attach the kit to the 400 MHz antenna as shown.
- Page 77 Remove the front wheel from the cart by loosening the front axel release. Attach the front fork of the cart to the antenna as shown. Tighten down the clamp at the rear of the antenna. All screws should be lightly snugged down.
- Page 78 Clay soil (dry) Marsh Agricultural land Water (fresh) Pastoral land Water (sea) “Average soil” 16 Polar snow 1.4 – 3 194 - 252 Granite 5 – 8 106 – 120 Polar ice 3 - 3.15 Limestone 7 – 9 100 – 113 Temperate ice Dolomite 6.8 –...
- Page 80 The SIR 3000 comes with preloaded setups to fit the system’s data collection parameters and filters to the most commonly used, currently available GSSI antennas. Settings for additional antennae are also provided below to assist you in creating a setup for an older or specialized antenna. Please note that these are only generalized setups, and it may be necessary to alter these to your particular situation.
- Page 81 900 MHz ground coupled antenna. Depth of viewing window is approximately 1 m assuming a dielectric constant of 5. Range: 15 ns Samples per Scan: 512 Resolution: 16 bits Number of gain points: 2 Vertical High Pass Filter: 225 MHz Vertical Low Pass Filter: 2500 MHz Scans per second: 120 Transmit Rate: 100 KHz...
- Page 82 270 MHz ground coupled antenna. Depth of viewing window is approximately 4m assuming a dielectric constant of 5. Range: 75 ns Samples per Scan: 512 Resolution: 16 bits Number of gain points: 3 Vertical High Pass Filter: 75 MHz Vertical Low Pass Filter: 700 MHz Scans per second: 120 Transmit Rate: 100 KHz 200 MHz ground coupled antenna.
- Page 83 Deep or Shallow prospecting. Please note that many of these antennae have a different listed transmit rate than the default one on the SIR 3000. The transmit rate listed here is the rate that the antenna was tested and rated at. It may function correctly at a higher transmit rate and allow you to collect data faster, but you must pay careful attention to your data to decide if the antenna is functioning correctly at the different rate.
- Page 84 120 MHz standard antenna. 100 MHz antenna with very high power transmitter. Data Collection Mode: Continuous Range: 400ns Data Collection Mode: Continuous Samples per Scan: 512 Range: 500ns Resolution: 16 bits Samples per Scan: 512 Number of gain points: 5 Resolution: 16 bits Vertical High Pass Filter: 30 MHz Number of gain points: 5...
- Page 85 80 MHz folded bow-tie antenna. Note: The 80 Low Frequency antenna length 3.6m MHz antenna is unshielded. Data Collection Mode: Point Data Collection Mode: Continuous Range: 750ns Range: 500ns Samples per Scan: 512 Samples per Scan: 512 Resolution: 16 bits Resolution: 16 bits Number of gain points: 5 Number of gain points: 5...
- Page 86 Borehole antenna frequency 120 MHz. Note: The borehole antennas are unshielded. Data Collection Mode: Point Range: 500ns Samples per Scan: 512 Resolution: 16 bits Number of gain points: 5 Vertical High Pass Filter: 30 MHz Vertical Low Pass Filter: 240 MHz Scans per second: 32 Stacking: 32 scans Transmit Rate: 64 KHz...
- Page 87 SetupName 200_SW 200_SW 400_Cart 400_Cart 900_Cart 900_Cart 1500_B_5x 1500_B_10x 1600_B_5x 1600_B_10x 2600_B_2x 2600_B_5x UNITS Metric English Metric English Metric English Metric English Metric English Metric English ANTENNA 200MHz 200MHz 400MHz 400MHz 900MHz 900MHz 1.5/1.6GHz 1.5/1.6GHz 1.5/1.6GHz 1.5/1.6GHz 2.6 GHz 2.6 GHz SW Cal 417/m 127/ft...
- Page 88 The default time range in nanoseconds. You can change this under COLLECT > SCAN > RANGE. The default dielectric value. This is needed if you want the SIR 3000 to do a time to depth calculation during data collect. This is also used for the auto migrate display during data collection and playback.
- Page 90 a paired transmitter and receiver that sends electromagnetic energy into a material and receives any reflections of that energy from materials in the ground. Also called a transducer. Antennae are commonly referred to by their center frequency value (i.e. 400MHz, 1.5Ghz). This frequency determines the depth of penetration and the size of the objects or layers visible.
- Page 91 mathematical calculation used to remove outlying tails of a hyperbola and to accurately fix the position of a target. unit of measurement for recording the time delay between transmission of a radar pulse and reception of that pulse’s reflections. Equal to one one-billionth of a second. unwanted background interference that can obscure true data.
- Page 92 Davis, J.L., Annan, A.P. Ground-penetrating radar for high-resolution mapping of soil and rock stratigraphy. Geophysical Prospecting 37, 531–551. Conyers, Lawrence B., and Dean Goodman Ground Penetrating Radar: An Introduction for Archaeologists. Altamira Press. Hatton, L., Worthington, M.H., and Makin, J. 1986 Seismic Data Processing Theory and Practice, Blackwell Scientific Publications, Boston, MA., 177p.
- Page 93 Geophysical Survey Systems, Inc.: United States Department of Agriculture Soils Website: USDA-Natural Resources Conservation Service, Ground Penetrating Radar Program: USDA – Natural Resources Conservation Service, GPR Soil Suitability USDA-Natural Resources Conservation Service, Web Soil Survey North American Database of Archaeological Geophysics:...
- Page 94 Warning: RADAN 4.0.2.0 and 5.0.0.0 CDs have an older version of the SIR 3000 USB Transfer software that will significantly limit your transfer speed. If you had already installed the transfer software from one of these disks or from the previous version on the web site, please contact GSSI software technical support.
- Page 95 At the Found New Hardware Wizard, click Next >. At the Install Hardware Device Drivers dialog, select Search for a suitable driver for my device and click Next >.
- Page 96 At the Locate Driver Files dialog, deselect floppy and CD-ROM drives and select Specify a location. Click Next >. When directed to Insert the manufacturer’s installation disk…, click Browse. Find the directory you extracted the ASUSBwoMSAS drivers to earlier (either C:\ASUSB or C:\ASUSBwoMSAS directory by default) and select wceusbsh.inf.
- Page 97 At the Found New Hardware Wizard, select Install from a list or specific location and click Next >. At the search and installation options dialog, select Search for the best driver in these locations and Include this location in the search. Click Browse. Find the directory you extracted the ASUSBwoMSAS drivers to earlier (either C:\ASUSB or C:\ASUSBwoMSAS...
- Page 98 After completion you may see the New Partnership dialog. In order to successfully transfer SIR 3000 data via USB you will need to set up a guest connection with the SIR 3000. Select No at this dialog each time you connect your SIR 3000, as you do not synchronize any information with the PC.
- Page 99 If you have trouble with your MS ActiveSync connection to the SIR 3000 check your configuration. If you do not want to respond to the New Partnership dialog each time you connect the SIR 3000 to your PC, find and double click on ActiveSyncKeys.exe in the ASUSB or ASUSBwoMSAS directory.
Need help?
Do you have a question about the SIR 3000 and is the answer not in the manual?
Questions and answers