Sign In
Upload
Manuals
Brands
Hologic Manuals
Laboratory Equipment
Panther System
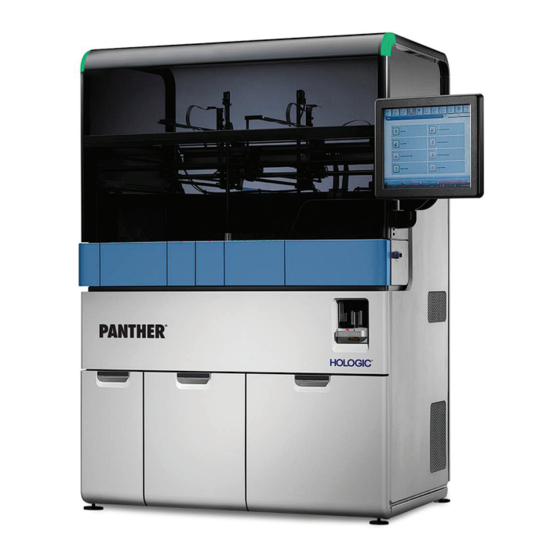
Hologic Panther System Diagnostic Manuals
Manuals and User Guides for Hologic Panther System Diagnostic. We have
1
Hologic Panther System Diagnostic manual available for free PDF download: Operator's Manual
Hologic Panther System Operator's Manual (425 pages)
Brand:
Hologic
| Category:
Laboratory Equipment
| Size: 6.97 MB
Table of Contents
Revision History
4
Table of Contents
5
Table of Contents
6
List of Figures
18
Welcome to the Panther® System
28
Description and Intended Use
28
Using this Manual
29
Intended Reader
29
What this Manual Covers
29
Typographical Conventions
29
Safety Symbols
30
Terminology
30
Special Terminology
30
Acronyms/Abbreviations
31
Compliance and Safety
33
Compliance
33
Electromagnetic Compatibility
33
Safety
33
Panther System Warnings
33
System Handling Warnings
33
System Environment Warnings
35
System Configuration Warnings
35
Sample Handling Warnings
35
Consumable, Reagent, and Fluid Warnings
36
Consumable Warnings
36
Reagent Warnings
37
Fluid Warnings
37
Biological and Chemical Hazards
38
Electrical and Mechanical Hazards
39
Glove Usage Recommendations
40
Limitations
41
Table 1. Changing Gloves
41
Specifications and Requirements
42
Physical Specifications
42
Environmental Requirements
42
Table 2. Size and Weight Specifications
42
Table 3. Clearance Specifications
42
Table 4. Environmental Requirements
42
Power Requirements
43
Table 5. Environmental Output
43
Table 6. Power Requirements
43
Internal Specifications
44
Table 7. Internal Specifications
44
Sample Tube Specifications
45
Sample Tube Barcode Requirements
45
Table 8. Sample Tube Requirements
45
Table 9. Barcode Requirements
45
Figure 1. Sample Tube Barcode Label Requirements
47
Sample Requirements
48
Volume Requirements
48
Table 10. Allowable Barcode Characters
48
Table 11. Panther System Volume Requirements
48
Dead Space Volume Requirements
49
System Capacities and Throughput
50
Table 12. Panther System Dead Space Volume Requirements
50
Table 13. System Capacities and Throughput
50
Operator Prerequisites
51
Overview
52
Technology Overview
52
Target Capture
52
Figure 2. Target Capture
53
Transcription-Mediated Amplification (TMA)
54
Hybridization Protection Assay (HPA)
54
Figure 3. Hybridization Protection Assay
55
Dual Kinetic Assay (DKA)
56
Real-Time Assays
56
Internal Controls for Aptima Assays
56
Panther System Overview
56
Introduction
56
Instrument Overview
56
Figure 4. Panther System
57
Table 14. Panther System Components
57
Canopy
58
Figure 5. Canopy
58
Table 15. Canopy Location Descriptions
58
Panther Upper Bay Components
59
Figure 6. Panther Upper Bay
59
Table 16. Panther Upper Bay Descriptions
59
Reagent Bay
60
Figure 7. Reagent Bay
60
Panther Tip Drawer Module
61
Sample Bay Module
61
Target Capture Reagent (TCR) Carousel
61
Figure 8. Sample Bay Module
61
Panther Pipettor System
62
Fluid Pumps
62
Panther MID Bay Components
62
Figure 9. Panther Pipettor System
62
Figure 10. Panther MID Bay
63
Table 17. Panther MID Bay Descriptions
63
Incubators
64
MTU Input Queue
65
Distributor
65
AMP Load Station
65
HPA Load Station
65
Magnetic Wash Module
65
Sample MIX Station
65
Luminometer
65
Output Queue
66
Panther Lower Bay Components
66
Figure 11. Panther Lower Bay
66
Table 18. Panther Lower Bay Descriptions
66
Computer
67
Panther Waste Drawer
68
Liquid Waste Container
68
Solid Waste Container
68
Panther Universal Fluids Drawer
68
Naocl Bottle
68
Vacuum Pump
68
Printer
69
Panther System Software Overview
69
Introduction
69
Accessing the Panther System Software
69
Desktop Shield
69
Figure 12. Desktop Shield Screen (Example)
69
Login Screen
70
Navigating the Software
70
Figure 13. Login Screen (Example)
70
Table 19. Login Screen Interactive Item Descriptions
70
Figure 14. Screen Locations (Example)
71
Table 20. Universal Screen Interactive Item Descriptions
71
Menu Bar
72
Interactive Items
73
Figure 15. Menu Bar (Example)
73
Table 21. Menu Button Descriptions
73
Table 22. Interactive Item Descriptions
73
Selection Button
74
Status Panel
74
Figure 16. Row Selection Menu (Example)
74
Table 23. Row Selection Menu Buttons
74
Status Panel Bars
75
Figure 17. Status Panel (Example)
75
Table 24. Status Bar Updates
75
Additional Status Panel Icons
76
Table 25. Additional Status Icon Descriptions
76
Additional Status Panel Items
77
Table 26. Additional Status Panel Items
77
Panther System Software Screens
78
Desktop Shield Screen
78
Figure 18. Desktop Shield Screen (Example)
79
Table 27. Desktop Shield Screen Button Descriptions
79
Messages Screen
80
Figure 19. Messages Screen (Example)
80
Table 28. Message Screen Descriptions
80
Comments Screen
81
Pending Screen
82
Figure 20. Comments Screen (Example)
82
Table 29. Comments Screen Descriptions
82
Tasks Screen
83
Figure 21. Pending Screen (Example)
83
Figure 22. Tasks Screen (Example)
84
Table 30. Tasks Screen Buttons
84
Universal Fluid Bay Screen
85
Waste Management Screen
86
Figure 23. Universal Fluid Bay Screen (Example)
86
Table 31. Universal Fluid Bay Screen Descriptions
86
Maintenance Activities Screen
87
Figure 24. Waste Management Screen (Example)
87
Table 32. Waste Management Screen Descriptions
87
Figure 25. Maintenance Activities Screen (Example)
88
Table 33. Maintenance Activities Screen Descriptions
88
Assay Reagent Bay Screen
89
Figure 26. Assay Reagent Bay Screen (Example)
89
Assay Reagent Loading Screen
90
Table 34. Assay Reagent Bay Screen Descriptions
90
Sample Rack Bay Screen
91
Figure 27. Assay Reagent Loading Screen (Example)
91
Table 35. Assay Reagent Loading Screen Descriptions
91
Figure 28. Sample Rack Bay Screen (Example)
92
Table 36. Sample Rack Bay Screen Descriptions
92
Sample Rack Loading Screen
93
Figure 29. Sample Rack Loading Screen (Example)
94
Table 37. Sample Rack Loading Screen Descriptions
94
Sample Details Screen
95
Figure 30. Sample Details Screen (Example)
96
Table 38. Sample Details Screen Descriptions
96
Run Status Screen
97
Figure 31. Run Status Screen (Example)
97
Table 39. Run Status Screen Descriptions
98
Test Orders Screen
99
Figure 32. Test Orders Screen (Example)
99
Results Screen
100
Figure 33. Results Screen (Example)
100
Table 40. Test Orders Screen Descriptions
100
Table 41. Results Screen Descriptions
101
Report Menu Screen
102
Figure 34. Report Menu Screen (Example)
102
Table 42. Report Menu Screen Descriptions
102
Administration Screen
103
Figure 35. Administration Screen (Example)
103
Table 43. Administration Screen Button Descriptions
103
Data Management Screen
104
Figure 36. Data Management Screen (Example)
105
Table 44. Data Management Screen Button Descriptions
105
System Configuration Screen
106
Figure 37. System Configuration Screen (Expanded Example)
106
LIS Configuration Screen
107
Table 45. System Configuration Screen Descriptions
107
Figure 38. LIS Configuration Screen-General Settings (Example)
108
Figure 39. LIS Configuration Screen-Serial Settings (Example)
109
Figure 40. LIS Configuration Screen-TCP/IP Settings (Example)
109
Figure 41. LIS Configuration Screen-File Settings (Example)
110
Table 46. LIS Configuration Screen Location Descriptions
110
Operator Management Screen
111
Change Password
111
Figure 42. Operator Management Screen (Example)
111
Table 47. Operator Management Screen Location Descriptions
111
Quality Control Configuration Screen
112
Figure 43. Quality Control Configuration Screen-External Quality Controls Tab (Example)
112
Table 48. Quality Control Configuration Screen Button Descriptions (External Quality Controls Tab)
112
Reflex Testing Configuration Screen
114
Figure 44. Quality Control Configuration Screen-Manufacturer's Controls/Calibrators Tab (Example)
114
Table 49. Quality Control Configuration Screen Button Descriptions (Manufacturer's Controls/Calibrators Tab)
114
Figure 45. Reflex Testing Configuration Screen (Example)
115
Table 50. Reflex Testing Configuration Screen Button Descriptions
115
Assay Custom Cutoff Value Configuration Screen
116
Help Window
116
Figure 46. Help Window (Example)
116
Table 51. Help Window Buttons
116
Logoff/Shutdown Screen
117
Figure 47. Logoff/Shutdown Screen (Example)
118
Table 52. Logoff/Shutdown Screen Buttons
118
System Operation
119
System Startup
119
Login/Logoff
119
Login
119
Logoff
120
System Operation
120
Load Tips
121
Figure 48. Tasks Screen (Example)
121
Figure 49. Tip Loading Management Window (Example)
122
Table 53. Tip Replacement Options
123
Load Mtus
124
Load Universal Fluids
125
Load Panther Universal Fluids
125
Replace Panther Universal Fluids
126
Figure 50. Bottle Status Panel (Example)
127
Empty Waste
128
Empty Waste-Warnings
128
Emptying Panther Waste
128
Figure 51. Disposing of Liquid Waste Container Contents (Example)
130
Perform Maintenance
131
Prime Instrument
131
Figure 52. Maintenance Activities Screen (Example)
131
Prime Criteria
132
Table 54. System Prime Resource Consumption
132
Prime Procedure
133
Force Full Prime
133
Load Panther Assay Reagents
133
Master Lot Setup
133
Add a New Master Lot
134
Figure 53. New/Activate Master Log Screen (Example)
134
Inactivate a Master Lot
135
Reactivate a Master Lot
135
Figure 54. Inactivate Master Lot Window (Example)
135
Reagent Kit Date Extension
136
Loading Panther Assay Reagents into Racks
136
Figure 55. Panther Reagent Rack (Example)
136
Loading Panther Assay Reagents
137
Figure 56. Supplemental Reagent Information Window (Example)
138
Unloading Panther Assay Reagents
139
Figure 57. Supplemental Reagent Information Window-Redundant Lots (Example)
139
Load Samples
140
Adding a New Control/Calibrator Lot
140
Controls/Calibrators Setup
141
Figure 58. Control/Calibrator Lot Entry Screen (Example)
141
Figure 59. Sample Rack Bay Screen (Example)
141
Control/Calibrator Processing
142
Run New Controls/Calibrators
142
Loading Samples into Sample Racks
143
Sample Defaults
144
Adding an Assay to the Sample Defaults
144
Figure 60. Panther Sample Rack-With Retainer
144
Altering Replicate Count for Sample Defaults
145
Figure 61. Sample Defaults Window (Example)
145
Deleting an Assay Test from the Sample Defaults
146
Configuring Additional Sample Defaults
146
Figure 62. Expanded Sample Defaults Window (Example)
147
Table 55. Additional Sample Default Options
147
Manually Download Test Orders
148
Loading Sample Racks
148
Load Sample Racks into the Sample Bay
148
Assigning a Reagent Lane for Aptima Assays
149
Figure 63. Select Reagent Lanes Window (Example)
149
Editing Specimen Test Orders
150
Adding a Test Order
150
Figure 64. Add Test Orders Window (Example)
151
Deleting a Test Order
152
Scheduling STAT Test Orders
153
Running Controls/Calibrators as Specimens
154
Dilution Factors
154
Figure 65. Process as Specimen Checkbox (Example)
154
Apply Dilution Factors
155
Delete Dilution Factors
155
Unloading Sample Racks
156
Initiating Assay Processing
157
Pausing Sample Pipetting
157
Resume Pipetting Following Pause
157
Monitoring the System through Hardware
157
System Leds
158
Reagent Bay Lane Leds
158
Table 56. System LED Status Color Legend
158
Table 57. Reagent Bay Lane LED Status Color Legend
158
Sample Bay Lane Leds
159
Tip Drawer, TCR Door, and MTU Input Queue Leds
159
Table 58. Sample Bay Lane LED Status Color Legend
159
Table 59. Tip Drawer, TCR Door, and MTU Input Queue LED Status Color Legend
159
System Alarm
160
Monitoring the System through Software
160
Monitoring the Menu Bar
160
Table 60. Menu Bar Status Descriptions
160
Monitoring the State Indicator
161
Table 61. System State Indicators
161
Monitoring the Status Panel
163
Status Panel
164
Status Panel Bars
164
Figure 66. Status Panel (Example)
164
Table 62. Status Bar Updates
164
System Activity Updates
165
Additional Status Panel Icons
165
Table 63. Status Icon Descriptions
166
Monitoring Pending Tasks
167
Monitoring Reagent Status
167
Panther Assay Reagent Bay Screen
167
Figure 67. Temperatures and Sensors Screen (Example)
167
Assay Reagent Loading Screen
168
Table 64. Reagent Rack Status Color Legend
168
Table 65. Assay Reagent Status Color Legend
168
Run Status Screen
169
Monitoring Test Orders
169
Figure 68. Assay Reagent Loading Screen (Example)
169
Figure 69. Assay Reagents Panel (Example)
169
Viewing Test Orders
170
Test Order Status
170
Figure 70. Test Orders Screen (Example)
170
Table 66. Test Order Screen Fields
170
Monitoring Loaded Specimen Status
171
Sample Rack Bay Screen
171
Table 67. Test Order Status Definitions
171
Table 68. Sample Rack Status Color Legend
171
Run Status Screen
172
Specimen Status
173
Figure 71. Run Status Screen (Example)
173
Figure 72. Sample Status Locations (Example)
174
Table 69. Specimen Status Definitions
174
Specimens Panel
175
Figure 73. Specimens Loaded Panel-Without LIS (Example)
175
Monitoring Control/Calibrator Status
176
Assay Reagents Panel
176
Figure 74. Specimens Loaded Panel-With LIS (Example)
176
Table 70. Control/Calibrator Status Definitions
176
Monitoring Results Timing
177
Results Management
177
Viewing Results
177
Figure 75. Assay Reagents Panel (Example)
177
Figure 76. Results Panel (Example)
177
Results Information
178
Figure 77. Results Screen-Expanded (Example)
178
Sample Curve Report
179
Figure 78. Sample Curve Report (Example)
179
Result Details
180
User Comment
181
Filter Results
181
Verifying Results
182
Editing Auto-Generated or Manually Entered Sample Ids
182
Figure 79. Results Screen with Filters Panel (Example)
182
Data Export
183
Exporting to a USB Flash Drive
183
Removal of a USB Flash Drive
183
Figure 80. USB Storage Removal Window (Example)
183
Exporting Raw Data
184
Exporting LIS Data
184
Sending Results to LIS
185
Export Viral Data
186
Reports Management
186
Table 71. Reports
187
Selecting Reports
189
Figure 81. Report Parameters for Results Report (Example)
189
Navigating Reports
190
Printing Reports
190
Figure 82. Panther System Report Navigation Bar
190
Table 72. Report Navigation Buttons
190
Exporting Reports
191
Reports
192
Activity Log Report
192
Assay Reagent Report
193
Figure 83. Activity Log Report (Example)
193
Table 73. Activity Log Report-Report Parameters
193
Configuration Report
194
Figure 84. Assay Reagent Report (Example)
194
Table 74. Assay Reagent Report-Report Parameters
194
Diagnostics Log Report
195
Figure 85. Configuration Report (Example)
195
Table 75. Diagnostics Log Report-Report Parameters
196
Exceptions by Worklist Report
197
Figure 86. Diagnostics Log Report (Example)
197
Table 76. Exceptions by Worklist Report-Report Parameters
197
Exceptions Report
198
Figure 87. Exceptions by Worklist Report (Example)
198
Table 77. Exceptions Report-Report Parameters
199
Levey-Jennings Report
200
Figure 88. Exceptions Report (Example)
200
Table 78. Levey-Jennings Report-Report Parameters
201
Lot Search Report
202
Figure 89. Levey-Jennings Report (Example)
202
Maintenance Checklist
203
Figure 90. Lot Search Report (Example)
203
Table 79. Lot Search Report-Report Parameters
203
Maintenance Log Report
204
Figure 91. Maintenance Checklist (Example)
204
Table 80. Maintenance Checklist -Report Parameters
204
Messages Log Report
205
Figure 92. Maintenance Log (Example)
205
Table 81. Maintenance Log Report-Report Parameters
205
Table 82. Messages Log Report-Report Parameters
206
Prevalence Report
207
Figure 93. Messages Log Report (Example)
207
Table 83. Prevalence Report-Report Parameters
207
Results by Worklist Report
208
Figure 94. Prevalence Report (Example)
208
Table 84. Results by Worklist Report-Report Parameters
208
Results Report
209
Figure 95. Results by Worklist Report (Example)
209
Table 85. Results Report-Report Parameters
210
Sample Audit Report
211
Figure 96. Results Report (Example)
211
Table 86. Sample Audit Report-Report Parameters
211
Test Count Report
212
Figure 97. Sample Audit Report (Example)
212
Table 87. Test Count Report-Report Parameters
212
Worklist Lot Report
213
Figure 98. Test Count Report (Example)
213
Table 88. Worklist Lot Report-Report Parameters
213
System Shutdown
214
Figure 99. Worklist Lot Report (Example)
214
Figure 100. Shutdown Confirmation Window
215
Maintenance
216
General Maintenance Information
216
Maintenance Task Summary
216
Table 89. Maintenance Task Summary
216
Maintenance Activities Screen
217
Maintenance Task Details Screen
218
Figure 101. Maintenance Activities Screen (Example)
218
Set Maintenance Tasks to Required
219
Figure 102. Maintenance Task Details Screen-Clean Sample Shield (Example)
219
Schedule an Automated Maintenance Task
220
Figure 103. Edit Maintenance Task Screen Mag Wash Cleaning (Example)
220
Tracking the Maintenance Schedule
221
Figure 104. Scheduled for Automated Start Panel (Example)
221
Figure 105. Maintenance Table (Example)
221
Maintenance Reports
222
Record Maintenance Comments
222
Recommended Cleaning Agents
222
Figure 106. Maintenance Task Completed Screen (Example)
222
Table 90. Recommended Cleaning Agents
223
Preparing Sodium Hypochlorite Solution
225
Preparing Bleach Enhancer Solution
225
Laboratory Check and Cleaning
225
Table 91. Environmental Specifications
225
Preparing a Clean Workspace
226
Clean with Sodium Hypochlorite Solution
226
Clean with Prepared Bleach Enhancer Solution (if Applicable)
226
Checking for Leaks and Spills
226
Mag Wash Clean
227
Table 92. Example Mag Wash Maintenance Tasks Cleaning Schedules
227
Clean the Sample Shield
228
Table 93. Mag Wash Cleaning Inventory
228
PC Reboot Maintenance
229
Monthly Maintenance
230
Step 1. Clean the Monitor and Scanner
230
Step 2. Clean the Tip Drawers
230
Step 3. Clean the Reagent Bay
231
Step 4. Clean the Sample Bay
231
Step 5. Clean the Panther Universal Fluid Drawer
233
Step 6. Clean the Panther Waste Drawer
234
Figure 107. Disposing of Liquid Waste Container Contents (Example)
235
Step 7. Clean the External Surfaces
236
Replace Mag Wash Cleaning Solution
236
Idle Maintenance
237
Table 94. Idle Maintenance Procedures
237
Clean Sample Racks and Reagent Racks
238
Database Maintenance
238
Database Backup
238
Database Restore
239
Delete Database
239
System Administration
241
Specimen Processing Modes
241
Random Access Loading-Bidirectional LIS Host Query
241
Manual Download
241
Automatic Host Query
241
Batch Loading
242
Samples with Barcodes
242
Samples Without Barcodes
242
Database Administration
242
Auto Purge Log Configuration
243
Purge Logs
243
Purge Results
244
Configuration
245
Figure 108. Purge Results Window (Example)
245
User Interface
246
Table 95. User Interface Options
246
Enable Automatic Log off
247
Threshold Management
247
Waste Threshold
247
Table 96. Threshold Management Options
247
Universal Fluid Management
248
Table 97. Universal Fluid Management Options
248
Priming Management
249
Enable Automatic Priming
249
Table 98. Priming Management Options
249
Assay Reagent Loading
250
Default Reconstitution Date Selection
250
Figure 109. Assay Reagent Loading Window (Example)
250
Table 99. Assay Reagent Loading Options
250
Specimen Loading
251
Table 100. Specimen Loading Options
251
Enable Non-Barcode Sample Loading
252
Enable Auto Sample ID Assignment
252
Enable Detection and Flagging of Repeat Barcodes/Reject All Repeat Test Orders
252
Manual Barcode Entry Mode
253
Enable Worklist ID Suffix
253
Table 101. Manual Barcode Entry Modes
253
ISBT128 Barcodes Enabled
254
Results Management
254
Enable RLU Value Suppression for Aptima Combo
254
Table 102. ISBT128 Barcodes Stripping Options
254
Table 103. Results Management Options
254
Panther Calibrator And/Or Control Frequency
255
Report Management
256
Enable Temperature Check Reporting
256
Report Export Directory
256
Table 104. Report Management Options
256
Data Export Management
257
Delimiter Character for Export Files
257
Table 105. Data Export Management Options
257
Raw Data Export Directory
258
Security Management
258
Figure 110. Delimiter Character for Export Files Window
258
Table 106. Security Management Options
258
Cybersecurity and Data Protection
259
Power Save Management
259
Table 107. Power Save Management Options
260
Enable Power Save Mode
261
Time to End Power Save Mode
261
UPS Management
261
Printer Management
262
Default Printer Name
262
Table 108. UPS Management Setting Options
262
Table 109. Printer Settings Options
262
LIS Configuration
263
Table 110. LIS Configuration Options
263
Enable LIS Connection
264
Disable the LIS Connection
265
Enable Automatic Results Holding
265
LIS Messages
266
Operator Management
267
Enable/Disable Operator Accounts
267
Adding Operator Accounts
267
Table 111. Operator Management Options
267
Figure 112. Add Operator Window (Example)
268
Editing Operator Accounts
269
Table 112. Operator Roles
269
Deleting Operator Accounts
270
Change Password
270
Figure 113. Edit Operator Window (Example)
270
Quality Control Configuration
271
Figure 114. Change Password Window (Example)
271
Adding/Editing Quality Controls
272
Adding External Quality Controls
272
Table 113. External Quality Control Configuration Options
272
Table 114. Manufacturer's Controls/Calibrators Configuration Options
272
Figure 115. Add Quality Control Window (Example)
273
Editing Quality Controls
274
Copying External Quality Controls
274
Deleting Quality Controls
275
Loading Unlabeled Quality Controls
275
Figure 116. Copy Quality Control Window (Example)
275
Selecting Assays During EQC Loading
276
Adding Manufacturer Control/Calibrator Overrides
276
Figure 117. Add Manufacturer Control/Calibrator Override Window (Example)
277
Reflex Testing Configuration
278
Table 115. Reflex Testing Configuration Options
278
Configuring Automatic Reflex Test Order Assignment
279
Configuring Reflex Test Order Assignment During Rack Load
279
Designating Reflex Tests During Sample Rack Loading
280
Assay Custom Cutoff Value Configuration
280
Troubleshooting
281
Hologic Technical Support
281
Troubleshooting over the Phone
281
Troubleshooting with PRO360° Software
281
Initiating a Remote Diagnostics Session
281
Figure 118. Remote Diagnostics Management Window
282
Figure 119. PRO360° Software Window (Example)
282
Terminating a Remote Diagnostics Session
283
Panther System Operator's Manual
283
Instrument Information
283
Figure 120. PRO360° Software Connection in Progress (Example)
283
Instrument Info Panel
284
Module Information
284
Assay Versions
284
Figure 121. Instrument Info Window-Module Information View (Example)
284
Silence Alarm
285
Force MTU Unload
285
Figure 122. Instrument Info Window-Assay Versions View (Example)
285
Send Logs
286
Figure 123. Send Logs Window (Example)
286
Send Logs Directly to Service Support
287
Disposing of Contaminated Waste
287
Figure 124. Disposing of Liquid Waste Container Contents (Example)
288
Dropped Tip Inside Sample Tube
289
Resolving Barcode Issues
290
Using the Handheld Scanner for Unreadable Barcodes
290
Figure 125. Sample Rack Loading Screen During Barcode Error (Example)
290
Using the Virtual Keyboard for Unreadable Barcodes
291
Unresponsive System Shutdown
291
Replaceable Parts
292
Vacuum Trap Filter Replacement
292
Universal Fluid Caps Replacement
295
Waste Bottle O-Rings Replacement
296
Appendix A. Panther System Operation Checklist
298
Appendix B. Processing Flags
299
Assay Processing Flags
299
Table 116. Assay Processing Flags
301
Results Processing Flags
310
Table 117. Results Processing Flags
310
Appendix C. System Messages
317
Table 118. System Messages
397
Appendix D. Support Contact Information
425
Advertisement
Advertisement
Related Products
Hologic PERILYNX
Hologic Compass ASY-05576
Hologic Genius Digital Diagnostics System
Hologic Rapid fFN 10Q
Hologic thinprep 2000
Hologic ThinPrep 5000
Hologic Categories
Medical Equipment
Laboratory Equipment
Server
Control Systems
Rfid Systems
More Hologic Manuals
Login
Sign In
OR
Sign in with Facebook
Sign in with Google
Upload manual
Upload from disk
Upload from URL