Blue Line Innovations PowerCost Monitor User Manual
Hide thumbs
Also See for PowerCost Monitor:
- Installation manual (8 pages) ,
- Installation manual (2 pages)
Table of Contents
Advertisement
Advertisement
Table of Contents

Related Manuals for Blue Line Innovations PowerCost Monitor


Summary of Contents for Blue Line Innovations PowerCost Monitor
-
Page 1: User Manual
User Manual Please read before using this equipment. -
Page 2: Table Of Contents
Table of Contents 1 Welcome............................1 2 Your Powercost Monitor™......................2 2.1 Safety instructions......................3 2.2 Care and maintenance ......................3 3 Determining your utility meter type..................4 4 Unpacking and verifying basic operation ................7 4.1 Powering the display unit ....................7 4.2 Powering the sensor unit....................7 4.3 Verifying the basic operation ..................8... -
Page 3: Welcome
Blueline Innovations Inc., we develop all our products and services with that goal in mind. By using this manual and making the PowerCost Monitor™ a regular part of your daily household management, you can considerably reduce the amount of electricity you consume without significantly altering the way you live from day to day. -
Page 4: Your Powercost Monitor
• See the effect of turning on or off various electrical devices in your home. It is important to remember that the PowerCost Monitor™ is just a tool. The amount of savings is up to you. By striving to keep the values shown on the Display Unit as low as possible, you will use less electricity - up to 20% less - every month. -
Page 5: Safety Instructions
Manual thoroughly before using this product. These instructions must be followed at all times. • Do not attempt to repair the PowerCost Monitor™ yourself. If you experience any difficulties, please refer to the troubleshooting section of this manual or visit www.bluelineinnovations.com for assistance. -
Page 6: Determining Your Utility Meter Type
Your utility meter is most probably located outside your house and it looks like one of the pictures on the following two pages. Your PowerCost Monitor™ Sensor Unit has been designed to fit on virtually any residential meter type, using its built-in clamping strap that goes over the meter dome. - Page 7 Find the picture on the left side that looks like your meter. The picture next to it shows how your sensor should look when properly mounted. IF YOU DETERMINE THAT YOUR METER IS ONE OF THE TWO FOLLOWING TYPES YOU CAN FOLLOW THE PROCEDURES IN THE QUICKSTART GUIDE TO INSTALL YOUR SENSOR UNIT Your meter looks like this…...
- Page 8 Your meter looks like this… … with the Sensor Unit mounted Electronic Meter Optical Port with optical port, FRONT 1.5 inches from LESS THAN outer rim of meter dome. You will need the rubber shims. See section 5.4 <1.5 inches <1.5 inches Electronic Meter with...
-
Page 9: Unpacking And Verifying Basic Operation
• Installation Guide, Setup Guide and User Manual • Alkaline “AA” Batteries (4) • Installation DVD After you unpack your PowerCost Monitor™, keep all the packing materials in a safe place. 4.1. Powering the Display Unit Proceed as follows to power the Display Unit: 1. -
Page 10: Verifying The Basic Operation
4.3.Verifying the Basic Operation Your Sensor Unit comes pre-programmed with a unique ID code so it will only work with your Display Unit. This synchronization step ensures that both the Display Unit and Sensor Unit operate properly using the same ID code. 1. -
Page 11: Sensor Unit Installation
Sensor Unit Installation 5.1.You Will Need… It is very important to follow the installation instructions for the PowerCost Monitor™ exactly as outlined in this User Guide for the type of meter installed in your home. Failure to do so will result in incorrect consumption data being displayed and may void the product warranty. -
Page 12: Electromechanical Meter
5.2. Electromechanical Meter Electromechanical meters have dials on the face and a spinning disk with a black mark. The faster the disk spins, the higher your electricity consumption. 5.2.1. Preparing Your Sensor Unit Proceed as follows to prepare your Sensor Unit for mounting on your electromechanical meter. - Page 13 4. Make sure that the Sensor Arm is properly positioned with the disk on the utility meter. It should be positioned so that the alignment line on the Sensor Arm is inline with the disk and the sensor head is centered from side-to-side. NOTE: If the Sensor Arm is not properly positioned, the Sensor Unit may not detect the motion of the disk and will generate incorrect readings.
-
Page 14: Electronic Meter (Optical Port On Face)
5.3. Electronic Meter (Optical Port on Face) Electronic meters have digital readouts, as well as an optical port which emits light pulses similar to the infrared light produced by a television remote control. This section deals with meters where the optical port is located on the face, more specifically, where the distance between the port and the outer rim of the meter dome is AT LEAST 1½... -
Page 15: Installing Your Sensor Unit
5.3.2. Installing Your Sensor Unit 1. Adjust the sensor mounting strap by turning the adjustment screw several turns with a flat head screwdriver until it is a little wider than the diameter of your meter dome. 2. Fit the Sensor Unit over your utility meter by sliding the clamp around the meter dome. -
Page 16: Electronic Meter (Optical Port On Face-Shims Required)
5.4. Electronic Meter (Optical Port on Face – Shims Required) Electronic meters have digital readouts, as well as an optical port which emits light pulses similar to the infrared light produced by a television remote control. This section deals with electronic meters that have their optical port on the face, at a distance LESS THAN 1.5 inches (37 mm) from the outer rim of the meter dome. -
Page 17: Installing Your Sensor Unit
The supplied rubber shims are required to achieve proper installation. 4. Loosen the hose clamp and determine by eye if one or two shims will be required. 5. Remove the adhesive backing from one of the shims and press the shim in place onto the underside of the Sensor body. -
Page 18: Electronic Meter (Optical Port On Top)
5.5. Electronic Meter (Optical Port on Top) Electronic meters have digital readouts, as well as an optical port which emits light pulses similar to the infrared light produced by a television remote control. This section deals with electronic meters that have their optical port on the top. Optical Port These meters require that you reconfigure the Arm in the Sensor Unit. -
Page 19: Installing Your Sensor Unit
4. Push the smaller end of the Sensor Arm upwards through the latch opening. 5. Push the Sensor Head behind the strap, and as far down as it will go into the bottom cavity of the body. 6. Tuck the wire neatly into the side cavity. 7. - Page 20 12. Slide the Sensor Unit over the glass dome and align the edges of the Sensor Unit body with the white sidelines on the template. 13. Tighten the hose clamp so that the Sensor Unit is snug but can still move easily. 14.
-
Page 21: Re-Synchronizing Your Display And Sensor Units
5.6. Re-synchronizing your Display and Sensor Units NOTE: You normally only need to synchronize your Display and Sensor Units once. If you replace the batteries in your Display or Sensor Units, the system will start working normally again as soon as you insert fresh ones. -
Page 22: Setting Up Your Display Unit
Setting Up Your Display Unit Once the Sensor Unit begins to detect power usage from your utility meter, the Display Unit automatically starts showing information after a short time. The actual numbers displayed are immaterial at this point. 6.1. Determine your Type of Billing Before you start setting up your Display Unit, you must first determine the type of billing your electricity provider is applying to your account. -
Page 23: Display Unit Buttons And Icons
6.2. Display Unit Buttons and Icons The pictures below illustrate all the various icons and values that can be displayed at any given time on your Display Unit, as well as the locations of all the available buttons. - Page 24 ICON/BUTTON PURPOSE Disk Emulator When spinning, indicates that the Display Unit is receiving a signal from the Sensor Unit. The higher the energy consumption, the faster the disk emulator spins. Consumption History Graphical representation of the power consumption over the last 7 days. See the User Manual for more detailed explanations Battery Levels Status of the Display Unit and Sensor Unit batteries.A black...
- Page 25 ICON/BUTTON PURPOSE Increase: During setup, each press of the button INCREASES the target value on the display by various increments. In some cases, if you Press-and Hold, the value is increased by a much larger increment; for example, the Kh increases by increments of 1.0 instead of 0.1. Decrease: During setup, DECREASES the target value on the display by various increments.
-
Page 26: Setting Up For Single (Flat) Rate Billing
6.3. Setting Up for SINGLE (FLAT) RATE Billing IMPORTANT: The instructions that follow assume that your Sensor Unit is transmitting signals normally to your Display Unit. Your Display Unit should show: 1. The Disk Emulator spinning. 2. The Signal Quality indicator showing a strong signal. - Page 27 7. Press Set the correct day of the week. Select the correct Day-of-Week segment. 8. Press SET Your Day-of-Week segment is stored and the currently stored Kh value flashes. 9. Press OR Press- Set your meter’s Kh Factor. and-Hold Each button press increases or decreases the Kh value by 0.1.
-
Page 28: Setting Up For Tiered Billing
6.4. Setting Up for TIERED RATE Billing IMPORTANT: The instructions that follow assume that your Sensor Unit is transmitting signals normally to your Display Unit. Your Display Unit should show: 1. The Disk Emulator spinning. 2. The Signal Quality indicator showing a strong signal. - Page 29 7. Press Set the correct day of the week. Select the correct Day-of-Week segment. 8. Press SET Your Day-of-Week segment is stored and the currently stored Kh value flashes. 9. Press OR Press- Set your meter’s Kh Factor. and-Hold Each button press increases or decreases the Kh value by 0.1.
- Page 30 14. Press SET Your Threshold value is set.“2” is displayed under RATE, and the currently stored value for the Rate 2 flashes next to the ¢/kWh segment. 15. Press Set your second electricity rate. This is generally the highest rate on your bill. Each press one of these buttons increases or decreases the displayed Rate value by 0.1.
-
Page 31: Setting Up For Time-Of-Use Billing
6.5. Setting Up for TIME-OF-USE Billing IMPORTANT: The instructions that follow assume that your Sensor Unit is transmitting signals normally to your Display Unit. Your Display Unit should show: 1. The Disk Emulator spinning. 2. The Signal Quality indicator showing a strong signal. Proceed as follows: 1. - Page 32 7. Press Set the correct day of the week. Select the correct Day-of-Week segment. 8. Press SET Your Day-of-Week segment is stored and the currently stored Kh value flashes. 9. Press OR Press- Set your meter’s Kh Factor. and-Hold Each button press increases or decreases the Kh value by 0.1.
- Page 33 14. Press SET Your ON-PEAK RATE is stored. The currently stored ON-PEAK start time value appears and the HOURS digits of the clock flash. 15. Press or Set your ON-PEAK RATE Start Time- HOURS. Each button press increases or decreases the value by 1.
- Page 34 20. Press SET Your OFF-PEAK Start Time HOURS is stored. The MINUTES digits are flashing. 21. Press Set your OFF-PEAK RATE Start Time- MINUTES. Each button press increases or decreases the value by 10. 22. Press SET Your RATE, HOURS and MINUTES values, as well as the current day-of-week segments are stored.
-
Page 35: Display Unit Functions
Display Unit Functions 7.1.Your Display Unit When the Sensor Unit begins to detect power usage from your utility meter and the Display Unit receives the Sensor Unit signals correctly, the Signal Strength indicator indicates a good quality signal, the Disk Emulator starts spinning and real information appears on the screen after a short time. -
Page 36: Total Consumption Row
7.1.3. Status Row The second row shows the current status of your PowerCost Monitor™ system. The Disk Emulator spins counter-clockwise at a speed proportional to the rate at which you consume electricity: the more you consume, the faster it spins. -
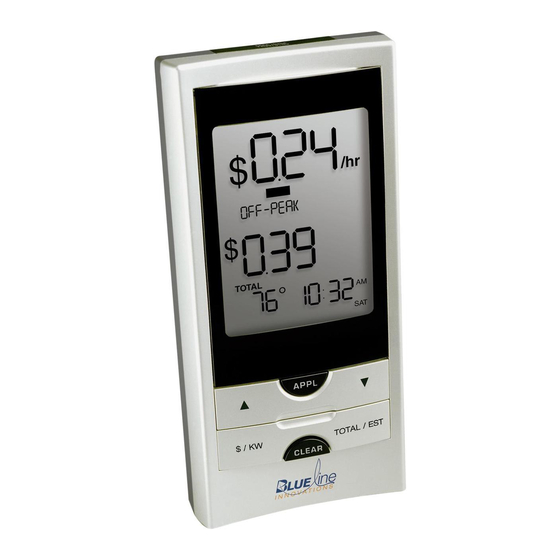
Page 37: Dollar And Cents Display Mode
7.2. Dollar & Cents Display Mode The first screen you will see once the PowerCost Monitor™ starts functioning is similar to the one below. Pressing the MODE button on the back of the Display Unit toggles the display between Kilowatt mode and Dollars & Cents mode. -
Page 38: Kilowatt And Kilowatt-Hours Mode
7.3. Kilowatt and Kilowatt-Hours Mode To enter the Kilowatt and Kilowatt-Hours screen, press and release the MODE button located on the back of the Display Unit.You will then see a screen similar to the one below (your actual values will vary). The top row now shows how much electricity you are currently consuming in kilowatts. -
Page 39: Temperature Display
7.4. Temperature Display The PowerCost Monitor™ displays the temperature reading at the location of the Sensor Unit. The temperature can be displayed in either °C or °F, as shown in figure 6.5 below. To change the temperature reading between Celsius and Fahrenheit, press and release the - °C/°F button on the back of the Display Unit. -
Page 40: Loss Of Signal Display
7.5. Loss of Signal Display In the event that your Display Unit loses the signal from the Sensor Unit you will see a screen similar to one of the two illustrations below, depending on the mode your Display Unit is currently operating in. -
Page 41: Resetting The Total Values
7.7. Display Backlight Your PowerCost Monitor™ has a backlight that can be used to see the screen in dimly lit conditions. To turn the backlight on, press the LIGHT button located on the top of the display unit. The screen will light up in blue and remain lit for approximately 5 seconds. -
Page 42: Troubleshooting
Troubleshooting In the event that you are experiencing difficulty installing or using your PowerCost Monitor™ system, please refer to the information below to assist you in resolving the issue. If you do not see your problem listed here, or you are still unable to get your system working properly, more information is available at http://www.bluelineinnovations.com/pcm or you may send... - Page 43 When I try to synchronize my Display and Sensor Units, the Display Unit keeps showing “id” on the screen. This indicates that the Display Unit is in ID mode, meaning that is is searching for your Sensor Unit. Press the RESET button on the Sensor Unit. If the Display Unit remains in ID mode, locate it within 10 feet (3m) of the Sensor Unit, and then press the RESET button again.
- Page 44 PowerCost Monitor™. If you have a wireless weather station try turning it off briefly and check to see if the PowerCost Monitor™ Display Unit returns to normal operation. If it does, then check to see if you can change the channel that your weather station operates on.
- Page 45 Warranty LIMITED ONE YEAR WARRANTY Blue Line Innovations warrants this product to be free from defects in materials and workmanship for a period of one year from the date of sale to the original user or consumer purchaser. Blue Line Innovation’s exclusive obligation under this warranty...
-
Page 46: Specifications
Specifications Power Display Unit 2 AA Alkaline Batteries (LR6 or equivalent) Sensor Unit 2 AA Alkaline Batteries (LR6 or equivalent) Wireless Communications Frequency 433.92MHz Update Rate Approximately every 30 seconds Up to 30m (100ft.) line-of-sight (Subtract 5m or 15 Range feet for each wall between Display and Sensor Units) Operating Temperature Range Display Unit... -
Page 47: Fcc Information
FCC Information FCC Class B Part 15 This device complies with part 15 of the FCC Rules. Operation is subject to the following two conditions: 1. This device may not cause harmful interference, and 2. This device must accept any interference received, including interference that may cause undesired operation. - Page 48 187 Kenmount Road St. John’s NL Canada A1B 3P9 www.bluelineinnovations.com Toll Free: (866) 607-2583 P/N: BLI-00193 Rev 2 © BlueLine Innovations Inc. PowerCost Monitor™ is a trademark of BlueLine Innovations Inc.
Need help?
Do you have a question about the PowerCost Monitor and is the answer not in the manual?
Questions and answers