Table of Contents
Advertisement
Quick Links
Advertisement
Table of Contents

Related Manuals for Ellisys Vanguard


Summary of Contents for Ellisys Vanguard
- Page 1 Version 3.2 | March 23, 2021...
- Page 2 Copyright, Confidentiality and Disclaimer Statements. While the information in this publication is believed to be accurate, Ellisys makes no warranty of any kind to this material including, but not limited to, the implied warranties of merchantability and fitness for a particular purpose.
- Page 3 Ellisys Contact Details Complete Direct and Reseller Contact Info www.ellisys.com/company/contact.php Technical Support (Web) www.ellisys.com/support/contact.php Technical Support (E-Mail) support@ellisys.com Sales www.ellisys.com/sales/contact.php Other Inquiries info@ellisys.com Phone – Europe HQ (Switzerland) +41 22 777 77 89 Phone – USA HQ (Phoenix, AZ) +1 866-724-9185 Phone –...
- Page 4 Repaired parts or replacement products will be provided by Ellisys on an exchange basis and will be either new or refurbished to be functionally equivalent to new. If Ellisys is unable to repair or replace the product, it will refund the current value of the product at the time the warranty claim is made.
-
Page 5: Table Of Contents
Software Installation ....................... 20 Analyzer Hardware Overviews ............... 21 Front Panel Overview - Explorer..................21 Front Panel Overview – Vanguard ..................25 Back Panel Overview – Explorer ..................28 Back Panel Overview – Vanguard ..................29 Connections and LEDs Overview – Tracker ................ 31 USB Driver Installation .................... - Page 6 Basic Power and Control Setups ..................79 Bluetooth Capture Diversity ....................82 Recording Options ......................83 Radio Sensitivity ......................87 Selecting an Analyzer ...................... 88 Ellisys Injection API ......................89 Initiating a Recording ...................... 91 Stopping a Recording ...................... 91 7.10 Restarting a Recording ....................91 7.11...
- Page 7 Wi-Fi Device Traffic Filter ....................149 Instant Timing Display Filter ................... 155 Instant Spectrum Display Filter ..................156 9.10 Overview Keep-Only Filter ....................156 10. Instant Timing Pane ................158 10.1 Device and Packet Color-Coding ..................159 10.2 User Controls and Toolbar ....................159 11.
- Page 8 Updating the Software ....................247 23. Getting Technical Support ..............249 24. Flying Leads Probe – Explorer .............. 250 25. Flying Leads Probe – Tracker and Vanguard ......... 251 26. Remote API and CLI ................252 26.1 Remote API ........................252 26.2...
- Page 9 27. Frequently Asked Questions ..............253 28. Explorer Technical Characteristics ............256 29. Tracker Technical Characteristics............258 30. Vanguard Technical Characteristics ............. 260 31. GATT Customizations ................263 Page 9 of 264...
- Page 10 Application notes and white papers - Go to www.ellisys.com/technology/ to find up-to-date information about the technology. Distributors - Go to www.ellisys.com/sales/ to find a list of Ellisys distributors. Technical support - Go to www.ellisys.com/support/ to send a question directly to the Ellisys support team. Page 10 of 264...
-
Page 11: Introduction
The Ellisys line of Bluetooth analyzers include the Bluetooth Explorer™, Bluetooth Tracker™, and Bluetooth Vanguard™. Each of these analyzers provide an array of features designed to enable various analyses and characterizations of protocol, performance, and RF behaviors for Bluetooth technology, with model- and edition- dependent support for capture and analysis of Wi-Fi, WPAN (IEEE 802.15.4), Host Controller Interface (HCI) -
Page 12: Models, Editions, And Configurations
All analyzer models are purchased and configured in feature-specific editions - Basic (BAS), Standard (STD), Professional (PRO), and Enterprise (ENT). Only the Bluetooth Tracker uses the BAS edition. The Explorer and Vanguard models may be configured to support a single Bluetooth radio (BR/EDR or BLE) or both Bluetooth radios (DUAL). The Tracker is BLE-only. -
Page 13: Model Comparison
1.2 Model Comparison The chart below summarizes the differences between the models. Note that this information is subject to change. Consult the Ellisys website (www.ellisys.com) or contact Ellisys as needed for latest details. Introduction | Page 13 of 264... -
Page 14: Bluetooth Tracker
1.3 Bluetooth Tracker The Bluetooth Tracker is an ultra-portable, bus-powered analyzer supporting concurrent capture of Bluetooth Low Energy (BLE), Wi-Fi, and other features as shown below. Page 14 of 264 | Introduction... -
Page 15: Bluetooth Explorer
1.4 Bluetooth Explorer The Bluetooth Explorer is an all-in-one analyzer supporting concurrent capture of Bluetooth Basic Rate/Enhanced Data Rate (BR/EDR), Bluetooth Low Energy (BLE), Wi-Fi, and other features as shown below. Introduction | Page 15 of 264... -
Page 16: Bluetooth Vanguard
Lithium Ion Battery The Bluetooth Vanguard unit has an interior, multi-cell, lithium ion battery installed. It is not user accessible. The battery is charged by the supplied DC power supply when it is attached to the analyzer. A combination indicator/push-button is located on the back panel of the unit, which provide battery status and on/off control. - Page 17 If ambient temperature is below 40 degrees F (4 C), DO NOT charge the battery. If the Bluetooth Vanguard unit has been damaged from being dropped or from shipping damage, contact Ellisys to arrange for return of the unit to Ellisys for...
-
Page 18: How To Check The Analyzer's Model, Edition, Features
1.6 How to Check the Analyzer’s Model, Edition, Features To check your analyzer to learn the model (Tracker, Explorer, or Vanguard) and the edition (Basic, Standard, Professional, or Enterprise), whether it is configured to support single-radio (BLE or BR/EDR) or dual-radio (BLE and BR/EDR), and the complement of features licensed, follow the steps below. -
Page 19: Software Application Download
1.8 Software Application Download The Analyzer is operated using a software application supplied by Ellisys. In addition, this same application can be used to view files created and saved during recording operations. Download information for this software application can be requested at www.ellisys.com/support/download.php. -
Page 20: Minimum Application Prerequisites
The analyzer requires several software components. Please be sure you have updated your Microsoft Windows installation using the appropriate menus available on your Windows computer (typically Windows Update, located in Settings). Ellisys recommends that you visit the following web page as needed, to update your versions of Microsoft .NET Framework: www.microsoft.com/net to download the Microsoft .NET Framework version. -
Page 21: Analyzer Hardware Overviews
Analyzer Hardware Overviews 3.1 Front Panel Overview - Explorer The front panel of the Bluetooth Explorer is shown below: Earlier versions of the Explorer labelled the left antenna port as Generate and the right antenna port as Capture. The left port was later repurposed as a secondary RF capture port, used for Wi-Fi (on units enabled for Wi-Fi capture). - Page 22 The Power LED indicates if the unit is correctly powered from the supplied DC power adapter (or from the battery for Vanguard units equipped with an internal battery). It also indicates whether the unit is successfully connected to the control computer over the control connection.
- Page 23 Operating LED The Operating LED indicates if the unit is presently performing a task directed by the user, for example when the user has initiated a recording action. Off: Unit is not in use and available. Constant green: Unit is in use. Orange: In use, waiting for event.
- Page 24 Capture LE LED The Capture LE LED indicates that the analyzer detects the presence of Bluetooth Low Energy traffic, irrespective of whether a recording is underway. Off: No Bluetooth Low Energy traffic detected. Flashing green: Bluetooth Low Energy traffic detected. Generate BR/EDR LED (Some Models) Reserved for future implementation.
-
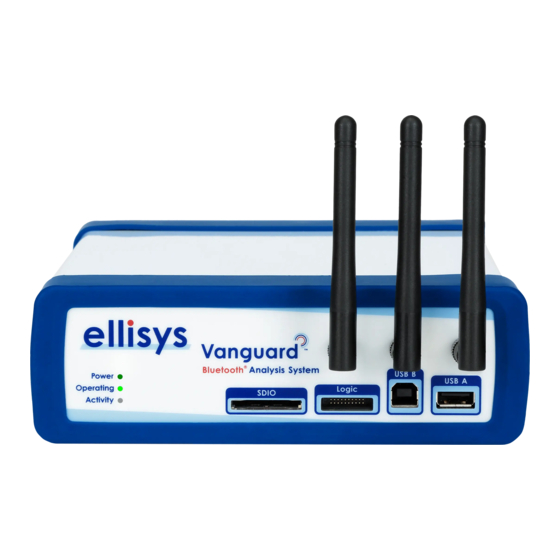
Page 25: Front Panel Overview - Vanguard
3.2 Front Panel Overview – Vanguard The front panel of the Vanguard is shown below: Figure 4 Vanguard Front Panel RF1 Connector The (Standard SMA) RF1 connector is used to connect the antenna (supplied) for capture of BR/EDR, BLE, and Wi-Fi. - Page 26 Power LED The Power LED indicates if the unit is correctly powered from the from any of the power sources (PoE, USB Power Delivery, or DC Power). It also indicates whether an IP address has been acquired or is being acquired. Flashing white fast: First-stage bootloader loading.
- Page 27 Operating LED The Operating LED indicates if the unit is ready to be operated or presently performing a task directed by the user, for example when the user has initiated a recording action. Off: Unit is not in use. Constant blue: Control-Port connected, IP address acquired, or USB driver loaded on Control Computer, and ready to operate.
-
Page 28: Back Panel Overview - Explorer
Accepted Voltage Range: 12VDC to 24VDC. Minimum Power: 18W To prevent damage to your Bluetooth Explorer, use only the DC power supply provided by Ellisys. Contact Ellisys for replacement details. Computer Type B USB 2.0 receptacle. Attaches to the Control Computer. -
Page 29: Back Panel Overview - Vanguard
Push-button controls on/off of the internal battery, on Vanguard units equipped with a battery (early versions may not have a battery installed). Note that the (supplied) external DC Power input may not be required if the... - Page 30 SMA connector used for accepting TTL voltage level shift or pulse from external equipment. Reserved future use. Ethernet Control port receptacle. 100Mbps minimum (1 Gigabit Ethernet supported). Used for power (PoE, if available) and control of the Vanguard. Ground Jack Connected to Vanguard chassis. Page 30 of 264 | Analyzer Hardware Overviews...
-
Page 31: Connections And Leds Overview - Tracker
3.5 Connections and LEDs Overview – Tracker The LED indicators and various connections on the Bluetooth Tracker are described below. There are four multi-color LEDs on top of the unit, and on the sides, an antenna SMA receptacle, two Sync micro-USB receptacles (not used), a Logic/GPIO connector, and for power and control, a micro-USB with an adjacent DC jack (needed only when power supplied over the micro-USB connection is insufficient). - Page 32 The unit will generally require just this connection from the Control Computer, but in cases where the power provided over this connection is insufficient, the Ellisys application software will advise the user to attach an additional (supplied) cable from any Standard-A USB port on the Control Computer to the DC Jack in order to deliver the additional power required for the unit to operate.
- Page 33 The logic connector is used to attach to a flying-leads probe (supplied) for capture of logic signals, HCI (UART Section 25 Flying Leads and SPI), I2S Audio, and generic communications (I2C, SWD, UART, and SPI). See Probe – Tracker and Vanguard for details. Analyzer Hardware Overviews | Page 33 of 264...
-
Page 34: Usb Driver Installation
Bluetooth Tracker and Bluetooth Explorer, the USB connection is USB 2.0 (480Mbps signaling) and for Bluetooth Vanguard, it is USB 3.2 Gen 1 (5Gbps signaling), although the system will default as necessary to support USB 2.0 as well. To use the USB control connection, the USB driver must be installed. -
Page 35: User Interface Reference
User Interface Reference The user interface of the Analyzer application provides various windows, panes, menus, toolbars, and other visual and control elements. All panes are dockable and can be hidden, resized, and re-positioned to suit the needs and preferences of the user. Most panes are inter-linked to provide synchronization with other panes and include various display options. - Page 36 Message Log – Provides a way for users to enter text data to be displayed in time with traffic captured. Can also Section 7.7, Ellisys be used by the Injection API to programmatically inject information from other sources (see Injection API...
-
Page 37: Organizing Panes
4.1 Organizing Panes The various panes provided can be shown or hidden, moved, docked, and resized to suit the user’s preferences. Section 6.2, Using Layouts for more information on saving display preferences. To open or display a pane or an Overview: Select View in the menu and select the desired pane or Overview. - Page 38 A window placer appears: Keep the mouse button depressed and point to one of the following: Center to open a pane as a floating window in the screen. Top to move the pane to the top of the screen or pane group. Right to move the pane to the right of the screen or pane group.
-
Page 39: Main Toolbar
4.2 Main Toolbar The table below shows the Analyzer toolbar buttons and their actions: Creates a new empty capture file. Open Opens a previously saved capture file. Save Saves a capture file. Save Filtered Copy Saves a filtered capture file (devices that are filtered-in). Search Opens the Search dialog. -
Page 40: Main Menu
Share to Cloud Ellisys secure cloud storage. Opens a dialog allowing the user to retrieve a shared capture Retrieve from Cloud from the Ellisys secure cloud storage. Import (Ctrl+P) Imports a file to view in the analyzer application. Export (Ctrl+E) Exports a capture to various formats. - Page 41 Print Preview Opens the Print Preview window. Print Print the selected Overview window. Exit Closes the application. View Details Opens the Details pane. Raw Data Opens the Raw Data pane. Instant Timing Opens the Instant Timing pane. Instant Spectrum Opens the Instant Spectrum window Instant Piconet Opens the Instant Piconet pane.
- Page 42 HCI Overview (Serial) Opens the Serial HCI Overview. HCI Overview (Secondary Serial) Opens the Secondary Serial Overview. HCI Overview (Injection) Opens the Injection HCI Overview. HCI Overview (USB) Opens the USB HCI Overview. HCI Overview (WCI-2) Opens the WCI-2 Overview. Opens the Generic I2C Overview.
- Page 43 Rename Layout Renames the existing layout. Reset Layout Resets the existing layout to default. Delete Layout Deletes the user-defined layout. Search Search (Ctrl+F) Opens the Find menu. Search In Designates the Overview in which to search Instant Search (Ctrl+I) Places the cursor in the Instant Search window. Go To (Ctrl+G) Opens the Go To Item window.
- Page 44 Opens a BLE hopping sequence calculator. See Hopping Sequence Calculator. Options Open the Options dialog. Help User Guide Opens the User Guide. Ellisys website Opens the Ellisys website in the default browser. Page 44 of 264 | User Interface Reference...
- Page 45 Opens a form in the default browser to contact Ellisys technical Contact support support. Download Offline Installer Downloads the analyzer application installation file. Check for updates Checks online for the latest software version. Opens the About window. When unit is attached to the controlling About computer, also provides information on enabled features.
-
Page 46: Managing Capture Files
Managing Capture Files 5.1 Opening a Capture File To open a capture file: Select File |Open in the menu or click on Open. Open menu appears: 5.2 Saving a Capture File To save a capture file: Select File | Save in the menu or click on Save. To save a capture file with a new name: Select File | Save As in the menu. -
Page 47: Saving A Filtered Copy Of A Capture File
5.3 Saving a Filtered Copy of a Capture File The analyzer captures traffic from all neighboring Bluetooth devices (for Wi-Fi, the capture is more specific, based on Wi-Fi channel selections in Recording Options | Wireless). The application provides a device filter to allow the user to display only the device(s) of interest (see Section 9.6 Bluetooth Device Traffic Filter ). -
Page 48: Opening A Sample Capture File
The application provides a convenient feature allowing users to share a capture file, markers, and optionally other files, to the Ellisys secure storage cloud for retrieval by other persons who also have an installation of the Ellisys software application. Note that Ellisys does not have access to files stored via this method, and the Sharing ID, created on upload, is the only way to access files uploaded. - Page 49 Capture Upload dialog appears: Select the Attach additional files checkbox if files in addition to the capture files are to be uploaded to the Cloud, then click Next. Capture Upload dialog shows Upload in progress: Managing Capture Files | Page 49 of 264...
- Page 50 Capture Upload When the upload is complete, the dialog shows Upload Completed: Click Next Capture Upload Notification appears: If desired, check the Send notification email checkbox to have an email sent to notify one or more recipients of your shared file(s). Page 50 of 264 | Managing Capture Files...
- Page 51 Separate individual email addresses with a comma or semi-colon. To send your capture file to Ellisys Technical Support, please include support@ellisys.com in the To: field. If Send notification email was checked, the specified recipient(s) will receive an email with retrieval instructions, as shown below: Click Next.
-
Page 52: Retrieving A Shared Capture File From The Cloud
Once a capture file is uploaded to the cloud, it is accessible only to persons having the sharing identifier (produced during the upload) and the Ellisys software application. Ellisys does not have access to this identifier or to any files uploaded via this method. - Page 53 Capture Download, Files Selection dialog appears, listing the available shared files. Uncheck any files not desired for download. Specify a destination in the Download directory box. Click Next to begin the download. Capture Download Progress dialog appears Managing Capture Files | Page 53 of 264...
-
Page 54: Printing A Capture File
Capture Download Completed When the download completes, the dialog appears: If desired, check Open the Capture File checkbox to open the shared capture file. Click Finish. 5.7 Printing a Capture File Page Setup option, File | Page Setup, to setup how the capture should be printed. This option will Use the depend on the printer;... - Page 55 Print Preview window appears: Print preview Print directly from the window using the print icon or select Close to return to the capture file. To print a file: Select File | Print in the menu then select the desired Overview. Overview Select the desired.
- Page 56 Print window appears: Select the printer and printer setup if required. Select Print. The file is printed. Page 56 of 264 | Managing Capture Files...
-
Page 57: Importing Data To View In A Capture File
5.8 Importing Data to View in a Capture File The application permits the user to import data from certain files types for display in the Ellisys viewer format. The analyzer hardware is not required for these operations. HCI commands and events may be imported from the Wireshark BT Snoop format (www.wireshark.org), from the Ellisys VisualUSB USB 2.0 software application... - Page 58 Import File and Format Menu appears. Browse to the desired files and follow the prompts to import the data. HCI Overview (Injection) , accessible from View | Overviews. The data will be displayed in the Page 58 of 264 | Managing Capture Files...
-
Page 59: Export Options
Export rows and columns as displayed or Export All Overview Rows XLXS in the currently active overview. Hierarchy selections None Filtered trace Ellisys trace Export a filtered trace based on the based on Active (*.btt) active overview filters. Overview Filtered trace Ellisys trace... - Page 60 Export Export Type Export Options Com m ents/ Usages Form at Bluetooth PCM Synchronization Export LC3, SCO, eSCO, A2DP, and Audio buffer length other codecs (from active overview) and I2S audio. Bluetooth Single File Mobile Phone Export Mobile Phone related Mobile Phone Data, *.vcf information such as VCards or Short...
- Page 61 To use the export feature: Open the desired capture file. Select File | Export from the menu. Export menu appears: Select the desired export method. Click on Next. Select desired export options as applicable and click on Next. Follow the prompts as applicable to complete the selected export. Managing Capture Files | Page 61 of 264...
- Page 62 Export of Active Overview Rows With this selection, the user can export from the Overview that is selected (active). The user may specify the columns to be exported or may specify that all displayed columns be exported. See Section 8.1, Configuring the Overview Columns, for information on adding columns to an Overview.
- Page 63 Export of a Message Sequence Chart This selection exports a graphical depiction of message procedures from the active Overview. The display of procedures is controlled by selections available in the export menu, including Compact, Expand, and Flatten, as shown below. Various export options are available, including display of timestamps, protocol layers, item parameters, scale, and page orientation, as shown below: Compact (Shows Procedures without Children).
- Page 64 Expand (Shows Procedures and Children). LMP only is displayed for simplicity. Flatten (Shows Procedures’ Children Only). LMP only is displayed for simplicity. Page 64 of 264 | Managing Capture Files...
- Page 65 Below is an example of an MSC export, using the Compact selection, showing timestamps, item parameters, and procedures involving Baseband, L2CAP, SDP, RFCOMM, and OBEX. The option Show Protocol Layers Individually is selected. Managing Capture Files | Page 65 of 264...
- Page 66 Below is an example of an MSC export, using the Compact selection with no layers. The option Show Protocol Layers Individually is unselected. Item parameters are displayed. Page 66 of 264 | Managing Capture Files...
- Page 67 Below is an example of an MSC export, using the Expand selection, showing timestamps, item parameters, and procedures involving Baseband, L2CAP, SDP, RFCOMM, and OBEX. Managing Capture Files | Page 67 of 264...
- Page 68 Below is an example of an MSC export, using the Flatten selection, showing timestamps, item parameters, and procedures involving Baseband, L2CAP, SDP, RFCOMM, and OBEX. Export of Bluetooth Internet Protocol This selection allows for export of IP carrier protocols, such as BNEP and DUN. The export is carried out from the currently selected Overview (i.e., the active Overview).
- Page 69 Export of Logic Signals This selection allows for export of captured logic signal transitions into CSV format. The logic signals capture option must be enabled on the analyzer unit and Logic Signals must be selected in the Wired tab located in the Record menu, under Recording Options | Wired.
-
Page 70: Workspaces And Layouts
Workspaces and Layouts 6.1 Using Workspaces The application allows the user to define a Workspace, which is a way of saving different sets of user settings preferences, such as display settings and other settings, like recording options, window/pane layouts and protocol verifications options (such as those available in the Tools menu, under Protocol Verifications). - Page 71 Accept the name provided by the application, or type in a new name in the Workspace name box. Select Create using default settings to establish a new Workspace based on the default settings. Alternatively, select Create using current workspace’s settings to establish the new workspace based on the current settings.
- Page 72 Select the Workspace name drop-down arrow. Select the desired Workspace name. Click on Remove. Click on OK. To export Workspace settings to a file: Select File | Import, then Export Settings from the menu. Import and Export Settings Wizard menu appears: Select Export settings.
- Page 73 Click on Next. Export menu appears: Select Export all workspace’s setting or alternatively, select Export only the selected categories of settings below and check the desired categories. Select Browse to specify a location to name and save the file. Click on Finish. Workspaces and Layouts | Page 73 of 264...
- Page 74 To import a Workspace settings file: Select File | Import and Export Settings from the menu. Import and Export Settings Wizard menu appears: Select Import settings. Click on Next. Import menu appears: Page 74 of 264 | Workspaces and Layouts...
- Page 75 Select Import all settings or alternatively, select Import only the selected categories of settings below and check the desired categories. Select Browse to specify a location to name and save the file. Click on Finish. To restore default Workspace settings: Select File | Import and Export Settings from the menu.
-
Page 76: Using Layouts
Reset default menu appears: Select Reset all settings to defaults or alternatively, select Reset only the selected categories of settings below and check the desired categories. Click on Finish. 6.2 Using Layouts Layouts can be used to customize the size and position of the application’s various panes and windows. Layouts can also be used to customize which panes and windows are displayed. - Page 77 New Layout dialog appears: Enter a name for the layout and click on OK. The new layout is created and is now accessible in the View | Layout menu and in the Layout Quick-Menu: To reset a layout to factory default: Select Layout | Reset Layout from the menu.
-
Page 78: Capturing Traffic
Connection is used to program the analyzer for any capture characteristics selected by the user, and to upload traffic to the analyzer application. Depending on the model, this connection may also be used to power the unit (Tracker and Vanguard). When successfully connected, the analyzer’s serial number will be visible in Record | Select an Analyzer. -
Page 79: Basic Power And Control Setups
7.2 Basic Power and Control Setups The general setup used for connecting and powering the analyzer varies by the model used (Tracker, Explorer, or Vanguard). General connectivity and power requirements for each model are discussed below. Explorer Setup The Explorer requires the supplied DC Power Supply. Explorer connects to the Control Computer using a supplied USB 2.0 Standard-A to Standard-B cable. - Page 80 Tracker Setup The Tracker does not use an external DC “brick” power supply and can be both powered and controlled over the supplied USB STD-A to Micro-B cable in most cases. If the USB port on the Control Computer is not enough to power the unit, the analyzer application will post a message to alert the user to add the auxiliary power cable (not shown in illustration below).
- Page 81 Ellisys does not provide any recommendations on which application is used. The DC Power Supply is required for Vanguard if the analyzer is not being powered over the data connection using Power-over-Ethernet (PoE) for the GbE connection or USB Power Delivery for the Type-C connection, or powered by the internal battery, if so equipped.
-
Page 82: Bluetooth Capture Diversity
7.3 Bluetooth Capture Diversity Vanguard employs a unique capture characteristic called Bluetooth Capture Diversification. This technique involves a co-operational replication of the Ellisys whole-band capture engine (used on all Ellisys Bluetooth analyzers). No menu selections are required to enable this feature; it is enabled whenever Bluetooth is selected for capture in the Recording Options menu, either Classic BR/EDR or Bluetooth Low Energy. -
Page 83: Recording Options
7.4 Recording Options Recording Options menu provides for control of the wireless and wired capture characteristics of the analyzer hardware during a recording, including the sensitivity of the analyzer’s capture, and segmentation of Recording Options captures. Multiple selections are available in the menu. - Page 84 To access the Recording Options menu: Select Record | Recording Options from the menu. Recording Options menu appears (Wireless tab shown below): The resolution setting for the wireless spectrum capture is selectable from 1us to 200us. At lower (higher-resolution) settings, the amount of data captured can be extremely high (exceeding 80MB/s), potentially resulting in an automated cessation of the spectrum capture process due to the high volume of data being captured and processed (especially if the Control Computer is USB...
- Page 85 Flying Leads Cable to adapt to the Logic/GPIO connector. See Section 25, Explorer Flying Leads Probe – Tracker and Vanguard for details. Default pin assignments are provided upon selection, but the user may specify custom pin assignments.
- Page 86 On the front panel (Vanguard and Explorer), connect the USB-B receptacle to the host side, and the USB-A receptable to the radio side of the USB HCI under test. On Vanguard, the USB-A receptacle is USB STD-A, and on Explorer, it is USB Micro-B. Use the supplied USB cables. USB HCI capture is not available on Tracker.
-
Page 87: Radio Sensitivity
The naming conventions for the receptacle used for capturing wired signals varies from model to model. On Vanguard, this is labelled Logic (located on the front-panel), for Explorer it is labelled IO Probe (located on the back- panel), and for Tracker, is referred to as Logic/GPIO in some illustrations. -
Page 88: Selecting An Analyzer
Select Record | Select an analyzer from the menu. Alternatively, select the drop-down arrow located on the Record button located on the toolbar. Available analyzers dialog appears (shown: Explorer connected over USB and Vanguard connected over Ethernet): Select the desired analyzer. Page 88 of 264 | Capturing Traffic... -
Page 89: Ellisys Injection Api
recording is initiated. The Ellisys Injection API is designed to transport client messages to the analyzer application, and events and message handling status back to clients. Messages are packet-oriented and use TCP or UDP as the transport layer. Each message packet links several possible information objects into one message. - Page 90 Select Record | Select an analyzer from the menu or alternatively select the drop-down arrow located on the Record button located on the toolbar. Available Analyzers dialog appears: Select Ellisys Injection API. Click on OK. Page 90 of 264 | Capturing Traffic...
-
Page 91: Initiating A Recording
7.8 Initiating a Recording A recording can be initiated using the GUI, API, CLI, or Web Control Interface. Section 7.14, Using the Web Control The Web Control Interface is a browser-based remote capture feature (see Interface). Section 26, Remote API and CLI For more information on the Remote API or CLI, see To initiate a recording (GUI): Click on Record... - Page 92 An indicator is provided on the main toolbar to indicate the progress of the current capture, based on a ratio of capture volume to a maximum capture time or maximum capture bytes, as specified by the user. Successive captures are automatically time/date stamped and placed in a user-defined directory. File names may be provided a user-defined prefix and suffix.
-
Page 93: Recovering A Capture
The software stores the temporary capture files to the Temporary Files Directory. By default, this directory Documents and Settings Application Data/Ellisys/Ellisys Bluetooth Analyzer is in the user’s directory, under Depending on the system configuration, it may not always be desirable to have temporary captures stored on the main hard disk. -
Page 94: Conducted Recordings
Select the Advanced tab. Click on Custom and browse to the desired directory. Click OK. Check the Ask for recovery… check box to program the application to prompt the user to recover temporary files after a crash. This box is enabled by default. 7.13 Conducted Recordings In some cases, users may require a cabled connection between the analyzer’s SMA connector and the system under test, in lieu of antenna reception. -
Page 95: Using The Web Control Interface
2 devices + the analyzer. The Y cable itself introduces some attenuation, and thus, additional attenuation is usually not necessary. Contact Ellisys (support@ellisys.com) for recommendations on third-party Y cables. 7.14 Using the Web Control Interface The Web Control Interface feature provides a convenient method to control the analyzer’s capture processes remotely, over a local area network (LAN), using a browser. - Page 96 Note this illustration is for Explorer; Vanguard and Tracker control/power connections to the Remote Computer will vary (see Section 7.1 Analyzer Hardware Setups for details). Figure 14 Figure 14 Web Control Interface (Explorer setup shown) To enable the Web Control Interface: From Tools | Options, select the Web Control tab.
- Page 97 Check the Enable web control box. Set the port number as desired (default is 8080). Click Apply. To protect access to the remote computer hosting the analyzer hardware, check the Protect Access box and supply a Username and Password. Ensure your firewall allows access to the port specified and to the analyzer application.
- Page 98 To initiate a capture using the Web Control Interface: Options Launch the web server from your browser using the link provided in the dialog above (e.g., http://192.168.1.20:8080). The default browser opens and displays the page below: Select Control capture. The page updates as shown below. Select a folder destination for the remote captures.
- Page 99 The capture is now started and the page updates as below: Select Stop and Save Capture, Abort, or Restart as needed. If Save Capture is selected, the capture file will be saved to the destination previously specified. If Abort is selected, the capture is stopped and not saved. ...
- Page 100 To add a link key to a device connection: Options Launch the web server from your browser using the link provided in the dialog above (e.g., http://192.168.1.20:8080). The page updates as below: Type or paste the link key into the Link Key box. Add the Bluetooth Addresses in the Related devices addresses boxes.
-
Page 101: Overviews
Overviews The Overviews are the primary viewer windows, providing a real-time, chronological, user-configurable display of events and traffic. Overviews also provide searching, filtering, timestamps, bookmarks, coloring, high-level protocol and profile abstractions, and other features. To display an Overview: Select View | Overviews from the menu. A selection of Overviews is provided: Select the desired Overview(s). - Page 102 The selected Overview(s) is/are displayed. Instant Timing Security Details Instant Spectrum Instant The Overviews are linked to other panes, such as the Audio Instant Channels Instant Throughput , and Instant Piconet panes. Additionally, the analyzer is designed such that the applicable Overview(s) will populate in real-time as traffic is captured.
-
Page 103: Configuring The Overview Columns
8.1 Configuring the Overview Columns A default set of columns are displayed in each Overview, but the user can add additional columns to customize an Overview to user preferences. This is an important and valuable feature, allowing precise customization of the Overview columns. - Page 104 To add a column to an Overview from the Details pane: Select an item of interest in the Overview. Details pane is populated as per the selected/highlighted line in the Overview. Details Select the field of interest from the pane: Details Click Show in overview on the toolbar or alternatively, drag and drop the desired field...
- Page 105 To pin a column: Right-click in the header of the desired column and select Pin in View: Select the desired column width percentage. A pin icon now appears in the selected column a thicker vertical separation line is applied to assist visually during scrolling.
- Page 106 To control information displayed in the Overview’s Communication column: Select the drop-down arrow located in the Communication column. Select Display. Options are presented for showing Name and Address, Name Only, and Address Only: Select the desired option to configure the information displayed in the Communication column. To hide a column: Right click on the desired column header.
-
Page 107: Color-Coding An Overview
8.2 Color-Coding an Overview Adding color to Overview items can help greatly with at-a-glance identification of specified protocols, profiles, events, statuses, etc. Coloring can be added with a convenient right-click or using the query-based feature for searching, filtering, and coloring. located at top-right of the Overview: To add coloring using the right-click option: Select the desired line in the Overview. - Page 108 Colorize To add color-coding using the menu: Right-click in the desired Overview and select Coloring | Add Color. Colorize dialog appears: To colorize events by payload content: Select the Payload tab. Enter Data to search for and/or a payload Length range. Select Data Type as needed.
- Page 109 To colorize events by text string: Select the Text tab. The Text tab appears: Use the one or more text string drop-down menus provided to characterize the color search. Text entered into the various boxes by selecting an item in the drop-down menus can be edited, or text may simply be entered directly into the boxes without selecting the drop- down menus.
- Page 110 To colorize events by field value: Select the Field tab. The Field tab appears: Values in the Name boxes are synchronized to the selected event in the Details view. The Value boxes reflect Overview, which is synchronized to the Details data elements displayed in the View.
- Page 111 To display a count of matching criteria: Define the search/colorize criteria from the Payload, Text, and/or Field tabs. Select the drop-down arrow at the bottom-right of the Colorize dialog. Select Count. The Colorize button changes to a Count button: Click on Count. A count of items matching the criteria is displayed: Overviews | Page 111 of 264...
-
Page 112: Grouping And Ungrouping
8.3 Grouping and Ungrouping The application provides an option to group or ungroup protocols and profiles as displayed in the Overview. This allows the user to view traffic in hierarchical abstractions (e.g., RFCOMM) or to drill down to mid-level abstractions (e.g., L2CAP) or lower layers such as baseband and packet levels. An option to group or not group procedures and transactions is also provided. - Page 113 To enable grouping of procedures and transactions: 1. Select Group Procedures and Transactions from the Protocol: drop-down menu on the Tool Bar: Transactions and procedures are grouped: Overviews | Page 113 of 264...
- Page 114 To disable grouping of procedures and transactions: De-select Group Procedures and Transactions from the Protocol drop-down menu on the Tool Bar: Transactions and procedures are not grouped: The Overview may show grayed out packets that are duplicated. A single packet can have two concurrent functions: it can start a data transaction, and it can acknowledge a data transaction started by another device.
-
Page 115: Overview Timing Measurements
8.4 Overview Timing Measurements The Overviews include precision timestamps associated with each event captured. These are displayed in the sec.milli.micro.nano. Time column. The default timestamp format is a relative (Delta) time format, shown as Additionally, two absolute time formats are available, including UTC time and local system time. Instant Timing, Instant The Overviews can be linked and unlinked to the Audio, Instant Channels, Instant Channels, and Instant Throughput... -
Page 116: Synchronization To Other Panes
Select Reset Time Reference. The events captured are reset with the timestamp values originally when the capture was taken. 8.5 Synchronization to Other Panes By default, the Overviews are automatically synchronized to other panes to give the user a comprehensive understanding of traffic captured, and to ease navigation. -
Page 117: Using Markers In Overviews
Markers can also be exported and imported to/from a capture, alleviating the need to send capture files between collaborators who may already have the original capture file. Further, markers can be sent and retrieved over Section 5.5, Sharing a Capture File to the Cloud) the Ellisys secure cloud (see . Markers placed in an Overview Instant Timing... - Page 118 Select a color for the marker as desired. Click on Close. A marker is placed adjacent to the event in the Overview and in other relevant panes as described above: Multiple markers may be placed on a single event. Use of the color-coding can facilitate technical “conversations”...
- Page 119 Select Delete. The marker is removed. To edit a marker: Position the mouse pointer over the marker to be edited. Left-click the marker (or right-click and select Edit Marker) or alternatively, select the Marker button on the toolbar. Select the desired marker. Select Edit.
-
Page 120: Search Features
8.7 Search Features a query-based Several search features are provided to enable searching the selected Overview. These include search feature (also used for filtering and colorizing) Go-To a configurable search menu, and several features. To enable the Instant Search: Instant Search Type the text string desired in the box located at the top-right of the selected Overview or select Search | Instant Search (Ctrl+I) from the menu to place the cursor in the... - Page 121 To search events by payload content: Select the Payload tab. Enter Data to search for and/or a payload Length range. Select Data Type as needed. Select Search in Packets or Search in Transactions to search packets or transactions. Select the desired match type in the Find items that drop-down menu. Click on Find Next.
- Page 122 Select the desired match type in the Find items that drop-down menu. Click on Find Next. The next event matching the search criteria is highlighted in the Overview. To search events by field value: Select the Field tab. The Field tab appears: Values in the Name boxes are synchronized to the selected event in the Details pane.
- Page 123 Select the desired match type in the Find items that drop-down menu. Search Select the drop-down arrow at the bottom-right of the dialog. Select Count. The Find Next button changes to a Count button. Click on the Count button. A count of items matching the criteria is displayed: To search using an Item Number or Item Time: Select Search | Go To (Ctrl+G) from the menu.
- Page 124 The Item Number correlates to the Packet Number column, which is available in the Overview. If it is not displayed, right-click on the column header to add this column. To use a content-sensitive search: Select Search | Go to next or Search | Go to previous from the menu, as desired. A content-sensitive menu of searchable items appears: Click on the item desired.
-
Page 125: Display Filters
Display Filters The analyzer employs a powerful all-channel digital radio for Bluetooth capture. Additionally, the analyzer captures a wide variety of wired traffic, WPAN 802.15.4, and Wi-Fi (if configured and licensed). Consequently, it is often important to be able to quickly and efficiently filter/drill-down in the analyzer application to isolate the communications of interest. - Page 126 Filter Type Filter Location Purpose of Filter Instant Piconet Right-click on Instant Filters all panes to show only piconet(s) or Keep Only and Keep Piconet pane connection(s) of interest. Involving Filters Instant Piconet Instant Piconet Toolbar Removes broadcast traffic from Instant Piconet view Broadcast Filter (inquiries, advertisements, etc.).
-
Page 127: Definition Of Keep Only And Keep Involving
Filter Type Filter Location Purpose of Filter Instant Instant Spectrum Display button on Shows/hides Establishment traffic and Idle traffic in Spectrum toolbar the Instant Spectrum pane. Display Filter Instant Instant Spectrum Buttons on Allows user to show or hide power indications and Spectrum Traffic Type and Toolbar... -
Page 128: Instant Filters
9.3 Instant Filters Instant Filter Filter Query s are enacted as query-based entries in the box located atop the columns in the Overviews. The query approach is also used to colorize and search. These filters are quite powerful and can be used to efficiently and precisely locate and display information of interest during capture or on saved captures, using a variety of operators and comparators. - Page 129 Filter Query If Hide Filter Bar is deselected in Edit Filter Query, the reduced version of the box remains visible after the filter is enabled, shown below. The entire filter can be cleared (removed) here, using the larger Filter Query red X, and the elements comprising the filter can be selected to open the box for editing.
- Page 130 Instant Filters Operators and Comparators Instant Filter s are comprised of one or more characters and can be modified by a variety of operators and Instant Filter comparators. They are not case-sensitive. s may be used on a static capture, saved capture, during recording, and can be saved, recalled, forced to stay active for all traces, and prioritized as favorites.
- Page 131 Instant Filter Values and Syntax Values can be numbers, text (in double quotes), or computations using other fields. Text can use a star (*) to represent any character. An exclamation mark can be used before values to create a Not condition. Two periods (..) can be used to create a time range in time-based columns.
- Page 132 Informational Pop-Up appears: Creating an Instant Filter Instant Filter There are three ways to create an Filter Query • Open the box (CTRL+H) and type the desired filter. • Recall a previously used query. • Right-click on a column/row intersection in the desired Overview and select the available option to Instant Filter (such as Show Only, Exclude).
- Page 133 Alternatively, select a stored filter (Past Filter) from the Edit Filter Query drop-down menu: The Past filters selections are also accessible from the main Search menu, located on the main tool bar. Use ALT+S to open the Search menu, then P to expose the Past filters selections: Alternatively, right-click over a column/row intersection and select the desired options, such as Keep Only or Exclude.
- Page 134 Alternatively, to clear the entire filter, click the larger red X associated with the reduced version of the Filter Query Examples Example 1 – Show-Only a Specific Payload The Show-Only example below will remove all items in the Overview that do not match the payload specified. Instant Filter Note that this filter can be typed manually into the box or applied with a right-click over the desired...
- Page 135 Example 3 – Using Multiple Filter Types Concurrently In the example below, several filters are working together to give precision to the information being displayed. A device-based filter is applied in the Filtering: menu (Headset, Notebook), a protocol filter (Audio / Video) is Instant Filters applied on the Protocol/Profile tool bar, and two are applied –...
- Page 136 Example 5 – Filtering in RSSI Values In the example below, the user is looking for devices that are sending packets with an RSSI value greater (stronger) than -35dBm (as measured at the analyzer’s antenna). Note the filter is using the decimal value (as Details shown in the view below) rather than the textual value that is default for this column (the user can also...
-
Page 137: Protocol / Profile Filters
9.4 Protocol / Profile Filters A selection of protocol and profile filter icons is available on the Filter bar (on most Overviews). These filters allow the user to show or hide specific protocols and profiles and includes baseband and packet-only options. The available filter options vary depending on the Overview selected. - Page 138 Filter Icons and Function The table below describes the various filter icons and their functions: Icon Function Overview Protocol: Selection Shows all protocols and profiles BR/EDR LE HCI Wi-Fi Single Shows packets-only view BR/EDR LE HCI Wi-Fi Single Show/Hide Baseband BR/EDR Single, Custom Show/Hide Link Layer...
- Page 139 Icon Function Overview Protocol: Selection Show/Hide Audio BR/EDR LE HCI Single, Multiple, Custom Show/Hide OBEX BR/EDR HCI Single, Multiple, Custom Show/Hide MAP BR/EDR HCI Single, Multiple, Custom Show/Hide PBAP BR/EDR HCI Single, Multiple, Custom Show/Hide CTN BR/EDR HCI Single, Multiple, Custom Show/Hide DUN BR/EDR HCI Single, Multiple, Custom...
- Page 140 To enable or disable a Protocol/Profile filter: Select the desired Overview. Select the desired feature from the Protocol: drop-down menu: Select or deselect the desired filter icon(s) as desired. The Overview updates with the selected setting. To remove all Protocol/Profile filters: Select the desired Overview.
-
Page 141: Instant Piconet Keep-Only And Keep Involving Filters
Select the Packets icon. The Overview updates to show only individual packets. 9.5 Instant Piconet Keep-Only and Keep Involving Filters Instant Piconet pane provides filtering that enables the user to show/hide selected piconets, scatternets, paging events, and inquiry events. This filter will update all displays and panes. For more information on the Instant Piconet Section 16, Instant Piconet Pane pane, see... -
Page 142: Bluetooth Device Traffic Filter
To clear an Instant Piconet Keep Only / Keep Involving Filter: Select the down-arrow associated with the Filtering button on the Tool Bar. The Filtering menu appears: Select Exclude Background (this is the default setting). All displays and panes are updated. 9.6 Bluetooth Device Traffic Filter Device Traffic Filters feature... - Page 143 Device Traffic Filter The user can use the to rename devices for easy recognition in other areas of the application, and to re-color the default color associated with any/each device used throughout the application. Device Database Users may also manually add new devices to the or add an IRK to a selected device (Edit button).
- Page 144 Device Traffic Filter window appears: To keep only specified devices: Click on the Filtering button located on the Tool Bar. Device Traffic Filters dialog, double-click the desired devices in the Device Database to In the add these devices to the Traffic Filtering Criteria, or select the desired device and click on the Add button in the Traffic Filtering Criteria.
- Page 145 To use the Search devices feature: Click on the Filtering button located on the Tool Bar. Device Traffic Filter window appears: Type the desired text string in the Search box relating to any of the columns shown in the Device Database (BD_ADDR, Name, Radio, LMP Name, and Company ID).
- Page 146 To view only devices in the current trace: Click on the Filtering button located on the Tool Bar. Device Traffic Filter window appears. In the Device Database, select the View down-arrow. The View drop-down menu appears: The View drop-down menu is grayed out if a capture is not open or a capture is not in process.
- Page 147 In the Device Database, select the device desired for deletion. To delete multiple devices, hold the keyboard CTRL button while selecting, or the SHFT button to select contiguous device entries. Click the Delete button or right-click the selection and select Delete Device. To edit device parameters in the Device Database (BD_ADDR, Name, Color, and Radio): Click on the Filtering button located on the Tool Bar.
- Page 148 New Device dialog appears: Edit the Parameters as desired. Click Create. The new device is added to the Device Database. To sort the Device Database: Click on the Filtering button located on the Tool Bar. Device Traffic Filter window appears. Click on the header above the column desired: The Device Database is sorted in alpha-numeric order.
-
Page 149: Wi-Fi Device Traffic Filter
The Exclude Background filter is enabled by default. This filter is aimed at removing "background noise." Various conditions are included in this filter. The application software does a complete topology reconstruction and analysis, and if captured packets do not belong to "good piconets", these packets are hidden by this filter. - Page 150 Selection Function Device Traffic Filter Keep All No Filtering is applied by the Exclude Background Default setting. Background traffic is removed. All other traffic displayed. Keep Involving Selected Devices Communication involving the devices selected and any other devices will be kept.
- Page 151 Device Traffic Filters dialog, double-click the desired devices in the Device Database to add In the these devices to the Traffic Filtering Criteria, or select the desired device and click on the Add button in the Traffic Filtering Criteria. Devices selected are populated into the Traffic Filtering Criteria tab. Click OK.
- Page 152 To clear Device Traffic Filters: Wi-Fi Overview Select the down-arrow associated with the WiFi Filtering button (located on the title bar): The WiFi Filtering menu appears: Select Exclude Background (this is the default setting). All displays and panes are updated. To view only devices in the current trace: Click on the WiFi Filtering button (located on the Wi-Fi Overview...
- Page 153 Click OK. Devices captured in the current trace are indicated with the icon. To remove a device from the Device Database: Click on the WiFi Filtering button (located on the Wi-Fi Overview title bar). WiFi Device Traffic Filter window appears. In the Device Database, select the device desired for deletion.
- Page 154 To manually add a new device to the Device Database: Click on the Filtering button located on the Tool Bar. Device Traffic Filter window appears. Click on New Device in the Device Database. New Device dialog appears: Edit the Parameters as desired. Click Create.
-
Page 155: Instant Timing Display Filter
Device Traffic Filter window appears. In Device Filtering Criteria, select Exclude Background from the drop-down menu. Click OK. Background traffic is removed from the capture. The Exclude Background filter is enabled by default. This filter is aimed at removing "background noise." Various conditions are included in this filter. The application software does a complete topology reconstruction and analysis, and if captured packets do not belong to "good piconets", these packets are hidden by this filter. -
Page 156: Instant Spectrum Display Filter
9.9 Instant Spectrum Display Filter Instant Spectrum View provides display filters for show/hide of Bluetooth inquiries, paging events, and advertisements, and show/hide of Bluetooth idle traffic (ID, Null, Poll and empty packets). A flyover on any of the filter selections describes its purpose. Other filters are available to hide specific traffic types, raw power spectrum indications, and statistics bars Instant Spectrum located on the right side of the... - Page 157 Right-click, and select Keep Only ‘xx and yy’, where xx and yy are the two communicating devices, as shown below: The Overview and all panes are updated with the Keep-Only selection. Display Filters | Page 157 of 264...
-
Page 158: Instant Timing Pane
10. Instant Timing Pane Instant Timing pane provides a unique and intuitive way to understand various timing characteristics of Bluetooth traffic as well as all other traffic types captured by the analyzer, including logic signals. Bluetooth packets are presented chronologically left to right and are uniquely color-coded per the packet’s sender. -
Page 159: Device And Packet Color-Coding
Instant Timing pane appears: 10.1 Device and Packet Color-Coding Instant Timing Bluetooth packets shown in the pane are color-coded based on which device is sending the packet. Each device (and its associated packets) is assigned a unique color. This color can be user-defined if desired (see 8.4 Device Traffic Filter). - Page 160 Pointer Mode Switches to Pointer Mode. Pan Mode (Hold Shift) Switches to Pan Mode. Zoom Mode (Hold Ctrl) Switches to Zoom Mode. Enable/Disable Smooth Scrolling Enables and disables the smooth scrolling. Highlighting Options Controls highlighting and synchronization with the Overviews Overview Instant Timing Highlight Active...
- Page 161 Message Log Highlight User Log Overview When enabled, the item selected in the Overview Instant Timing Selection is highlighted in the pane. Overview Instant Timing Follow Selection When enabled, the pane synchronized to the active Overview selection. Instant Timing Origin Box Displays the timestamp origin of the pane.
- Page 162 The pointer changes to a pan (hand) symbol. Press and hold the left mouse button and drag left or right as desired. The mouse cursor automatically rolls around the screen, such that the user can smoothly scroll substantial amounts of time without having to press and release the mouse button several times.
- Page 163 The following values are allowed: s – seconds ms – milliseconds ns – nanoseconds ps – picoseconds If a unit is not specified, then the previously displayed unit is used. Press ENTER Instant Timing pane is updated with the new origin. The analyzer application retains new timing origin entries.
- Page 164 To use the Navigator bar to zoom: Navigator w Position the mouse over the left or right edge of indow: Press and hold the left mouse button and drag left or right as desired to zoom in or out. To define a new time span: span Type the new timing span in the field.
- Page 165 A-B Independent Cursors To make a timing measurement: Instant Timing Select the pointer icon at the top left of the pane. Left click in the desired location or on the desired event. Instant Timing The vertical lines associated with the cursors are waved if not attached to an event, and straight when attached.
- Page 166 The vertical position of the displayed timing information, including the horizontal arrows, can be changed by selecting the information with the mouse pointer, then dragging to the desired position. To add additional cursors: Right click over an existing set of timing cursors. Select Duplicate to make available another set of cursors with the exact time spread as the original or select...
- Page 167 The A cursor is placed at the location selected. Instant Timing Select the second desired location in the pane. Right click and select Place Cursor B here. The B cursor is placed at the location selected, and timing information is provided, including number of slots: Time Scale Set and Reset Instant Timing The time scale at the bottom of the...
- Page 168 Throughput Graph Instant Timing throughput graph provides a characterization of L2CAP and SCO/eSCO data throughput in Instant Timing synchronization with all other information displayed in the pane. A mouse fly-over provides a throughput indication. The two throughput indications (L2CAP and SCO/eSCO) are color-coded and may be superimposed if they occur at the same point in time.
- Page 169 To search markers: Click on the Markers button (F9) on the toolbar. A list of all markers installed appears: Select the desired marker from the list. Instant Timing pane jumps to the selected marker. To delete a marker: Position the mouse pointer over the marker to be removed. Right-click and select Remove marker or alternatively, click on the Markers button (F9) on the toolbar Position the mouse pointer over the desired marker:...
- Page 170 Select the desired marker. Select Edit. The selected marker opens for editing. Packet Fly-Over and Identifiers Instant Timing pane provides various automated indications to the user, including detailed packet Instant Timing information, timing information, and identifiers that are used to indicate packet selections in the pane (selected packet and mouse position) and the Overview.
- Page 171 Logic/IO Probe connector. See Vanguard , for details. USB HCI is captured using the available front panel USB ports (Vanguard and Explorer). Recording Options HCI and logic inputs can be configured for recording in the Wired tab of the menu, see Section 6.2, Recording Options.
- Page 172 Any attached HCI traffic is displayed as below: Zooming IN shows more detail (such as the Token/Data/Handshake sequence of USB): Page 172 of 264 | Instant Timing Pane...
- Page 173 Improving the efficiency of the logic capture: The analyzer will capture up to 16 logic lines and will compress the logic transitions with a very efficient engine, but the throughput of the compressed data will be directly related to the frequency of the lines. The more lines that are toggling fast, the higher the throughput requirement, and at some point, the internal buffer allocated to the logic stream will get full and the capture will stop for that stream (the other streams are independent and will continue).
- Page 174 Instant Piconet Cursor Instant Timing Instant Piconet pane provides a unique cursor that allows the user to force the pane to Instant Piconet update as the cursor is moved. This is useful for various cases, such as to visualize a role switch Instant Piconet by dragging the cursor across this event.
- Page 175 Images to be exported are automatically assigned a file name that includes the origin and span values. Accept the default file name or assign a new file name. Select a directory location. Select the file type in Save as type drop-down (e.g., *.gif, *.png, *.jpg, *.bmp). Click on Save.
- Page 176 Security Instant Timing Selecting a timestamp in the pane will cause the pane to jump to the selected timestamp location. Instant Spectrum Instant Timing Selecting an event in an Overview or the view will cause the pane to jump to the selected event. To enable synchronization with the active Overview: Instant Timing Select the highlighting options drop-down in the...
- Page 177 When selecting a higher-level abstract event, such as a request, response, command, etc., all associated packets comprising these events are highlighted. To unsynchronized with the Overview: Instant Timing Select the highlighting options drop-down in the toolbar. De-select Follow Overview selection. Instant Timing pane will no longer follow selected lines in the Overview.
-
Page 178: Instant Spectrum View
11. Instant Spectrum View Instant Spectrum view provides a unique and intuitive way to understand the spectral and other behaviors of Bluetooth, Wi-Fi, and WPAN traffic, including all other RF events within the ISM spectrum that is used by Bluetooth. Bluetooth, Wi-Fi, and WPAN packets are presented chronologically left to right on the channel they are transmitted and are uniquely color-coded per the packet’s sender. - Page 179 Instant Spectrum Instant Timing view is linked to the Overviews as well as the pane. It is manually linked Instant Piconet Instant Piconet Instant Piconet to the pane by the cursor, which when scrolled, updates the Instant Timing view per its current location. Conversely, when events are selected in an Overview or the view, this cursor is re-positioned accordingly.
- Page 180 Panning Left and Right Instant Spectrum Various methods are available to pan (scroll) the view to the left or right. To use the mouse to pan: Instant Spectrum Position the mouse over the time scale at the bottom of the view (recommended) or alternatively, click on Pan.
- Page 181 ps – picoseconds If a unit is not specified, then the previously displayed unit is used. Press ENTER. Instant Spectrum view is updated with the new origin. The analyzer application retains new timing origin entries. Click the Down arrow in the origin field to view and select previously entered timing origin entries.
- Page 182 Press and hold the left mouse button and drag left or right as desired to zoom in or out. To define a new time span: span Type the new timing span in the field. The following values are allowed: s – seconds ms –...
- Page 183 Left click in the desired location or on the desired event. Instant Spectrum The vertical lines associated with the cursors are waved if not attached to an event, and straight when attached. To adjust cursor position, place the mouse pointer over either cursor and left click and drag to adjust position horizontally.
- Page 184 The vertical position of the displayed timing information, including the horizontal arrows, can be changed by selecting the information with the mouse pointer, then dragging to the desired position. To add additional cursors: Right click over an existing set of timing cursors. Select Duplicate to make available another set of cursors with the exact time spread as the original or select...
- Page 185 Right click and select Place Cursor B here. The B cursor is placed at the location selected, and timing information is provided, including number of slots: Time Scale Set and Reset Instant Spectrum The time scale at the bottom of the pane will (by default) be synchronized to the Overview Time columns.
- Page 186 Channel Statistics Instant Spectrum view employs a graphical per-channel statistics feature that characterizes payload errors, Channel Statistics header errors, and retransmissions. The uses a stacked-bar chart approach and operates Instant Channels Section 13, Instant Channels identically to the feature (see for more information).
- Page 187 A list of all markers installed appears: Select the desired marker from the list. Instant Spectrum view jumps to the selected marker. To delete a marker: Position the mouse pointer over the marker to be removed. Right-click and select Remove marker or alternatively, click on the Markers button (F9) on the toolbar.
- Page 188 Left-click the marker (or right-click and select Edit Marker) or alternatively, select the Marker button on the toolbar. Select the desired marker. Select Edit. The selected marker opens for editing. Packet Fly-Over and Identifiers Instant Spectrum view provides various automated indications to the user, including detailed packet Instant information, timing information, and identifiers that are used to indicate packet selections in the Spectrum...
- Page 189 Identifier Highlight color Instant Spectrum Mouse flyover location in Selected Overview event Instant Spectrum Selected event Instant Piconet Cursor Instant Spectrum Instant Piconet view provides a unique cursor that allows the user to force the pane to Instant Piconet Instant Spectrum update as the cursor is moved.
- Page 190 To export the Instant Spectrum display to a graphics format: Instant Timing Save Click on the Export Image icon located on the toolbar. menu appears: Images to be exported are automatically assigned a file name that includes the origin and span values. Accept the default file name or assign a new file name.
- Page 191 Instant Piconet Instant Spectrum Selecting timestamps in the pane will cause the view to jump to the selected timestamp location. Security Instant Spectrum Selecting a timestamp in the pane will cause the view to jump to the selected timestamp location. Instant Timing Instant Spectrum Selecting an event in an Overview or the...
- Page 192 Section 10.12, Wireless Spectrum Capture for details on viewing AFH Highlighting with Wireless Spectrum capture enabled. To view the AFH Highlighting: Open a capture with active AFH, i.e., one that includes AFH Commands as shown below: Select View | Instant Spectrum Instant Spectrum Select a packet at the desired location in the view.
- Page 193 The channels precluded by the active AFH command are now highlighted: Wireless Spectrum Capture Instant Spectrum In addition to spectral display of captured Bluetooth, Wi-Fi, and WPAN packets, the view can also display raw RF energy present within the Bluetooth spectrum. Spectrum energy is typically seen from Wi- Fi sources, but can also be generated by various other wireless technologies or commercial equipment.
- Page 194 Wireless Spectrum capture is an optional feature. As needed, contact Ellisys to upgrade your analyzer to include this feature. No hardware change is needed; updates are done with a software enable file. To enable Wireless Spectrum capture: Check the Wireless Spectrum box in the Recording Options menu (Record | Recording Options).
- Page 195 Captured wireless spectrum information is displayed along with any captured Bluetooth, Wi-Fi, and WPAN packets: Instant Spectrum View | Page 195 of 264...
-
Page 196: Instant Audio
LC3 traffic, even without capture of configuration parameters), and t Tracking Technology ZERO (Vanguard model only, delivers high-fidelity capture of isochronous traffic from the initial instance of isochronous traffic). To better ensure optimal reception by the analyzer of audio traffic, please... - Page 197 Zoom Mode (Hold Ctrl) Switches to Zoom Mode. Enable/Disable Smooth Scrolling Enables and disables the smooth scrolling. Highlighting Options Overview Instant Audio Highlight Active When enabled, the pane will be synchronized to the active Overview selection. Selection Overview Instant Audio Follow Selection When enabled, the...
- Page 198 Mute Mutes audio Volume Slide bar to adjust volume up or down Options Open Options dialog Playing Audio Instant Audio feature allows for playing of captured audio during recording as well as playback of audio from a saved capture. Individual audio streams from either over-the-air sources or HCI sources can be enabled or disabled as desired.
- Page 199 To select a range of audio to play: Left click at the desired starting position and drag to select the range desired. The select range is highlighted and characterized with a time indication: To enable or disable playback from a selected audio stream: Select the speaker icon associated with the desired audio stream Click once to toggle the present mode (enabled or disabled).
- Page 200 The Options dialog opens: Select the desired device and click OK. Audio Stream Flyover and Details Instant To see details on a captured audio stream, place the mouse over the desired location in the Audio pane. Details on the selected audio are displayed in a fly-over: Using Markers Instant Audio Markers may be added at any location within the...
- Page 201 Select Add New Marker Here. A marker is placed at the selected location. To search markers: Click on the Markers button (F9) on the toolbar. A list of all markers installed appears: Select the desired marker from the list. Instant Audio pane jumps to the selected marker.
- Page 202 To edit a marker: Position the mouse pointer over the marker to be edited. Left-click the marker (or right-click and select Edit Marker) or alternatively, select the Marker button on the toolbar. Select the desired marker. Select Edit. The selected marker opens for editing. Panning Left and Right Instant Audio Various methods are available to pan (scroll) the...
- Page 203 To define a new timing view origin: origin Enter a timestamp value in the box. The following values are allowed: s – seconds ms – milliseconds ns – nanoseconds ps – picoseconds If a unit is not specified, then the previously displayed unit is used. Press ENTER.
- Page 204 The mouse cursor automatically rolls around the screen, such that the user can smoothly scroll substantial amounts of time without having to press and release the mouse button several times. The mouse wheel can be used to zoom in and zoom out by moving the wheel forward to zoom in and backwards to zoom out.
- Page 205 Making Time Measurements Instant Audio pane provides quick and simple methods to manually characterize timing between or within audio streams. Timing cursors can be duplicated or frozen with a right-click, to enable the addition of more cursors. Timing cursors available include: Range Select Timing Cursors A-B Independent Cursors To make a timing measurement:...
- Page 206 A new set of cursors appears (with Duplicate selected) and can be placed as desired. With Freeze selected, the original cursor set is grayed out and new cursors can be installed as described above. To enable automated timing indicators: To enable the automated timing measurement, place the mouse over any packet. The time from one packet to the next and from the previous packet is indicated in grey text.
- Page 207 To make time measurements using the A-B cursors: The A-B cursors are especially useful when the two events being measured are far apart, such that one cursor can be set, then the user can scroll as needed to the other event to set the second cursor.
-
Page 208: Instant Channels
13. Instant Channels Instant Channels feature provides visual and statistical analyses on various per-channel transmission characteristics, including packet retransmissions, header errors, AFH indications, and payload errors. A summary of the selected span shows a count and percentage of categorized packets. Options are provided to show/hide any combination of LE ADV, BR/EDR, and/or LE DATA. -
Page 209: Color-Coding
13.1 Color-Coding Instant Channels Each Bluetooth channel is listed across the bottom of the pane, increasing from left to right. Scales are provided (in the Scales drop-down menu) for Frequency, BR/EDR channel, Bluetooth Low Energy channel, Wi-F channel, and 802.15.4 (WPAN) channel. Stacked vertical bars are associated with each Bluetooth channel and are color-coded to indicate: OK packets GREEN... -
Page 210: Navigation Bar
13.3 Navigation Bar Instant Channels Navigation pane includes a bar atop the window, which allows for global pan and zoom Navigation to traffic concentrations of interest. All traffic captured is represented in the bar. To use the Navigator bar to pan: Navigator Position the mouse over the middle of the window. - Page 211 Options Enables disables display options including show/hide categories for the Nav Bar (Overview Histobars) and the primary view (Main Histobars). Scales Scales available include MHz, BR/EDR Channel, Low Energy Channel, WPAN (802.15.4) Channel, and 802.11 Channel. To view per-channel statistics: Place the mouse over the histogram associated with the desired channel.
-
Page 212: Synchronizing To Other Views
13.6 Synchronizing to Other Views Instant Channels BR/EDR Overview Low Energy display is synchronized to the active Overview ( Overview Instant Channels ). As the user selects an event in these Overviews, the display will orient to the location selected. To disable synchronization with the active Overview: Instant Channels On the... -
Page 213: Instant Throughput
14. Instant Throughput Instant Throughput pane displays payload throughput by device and by protocol (L2CAP channel and SCO/eSCO). Wi-Fi throughput is also displayed. A color-coded scheme is used to differentiate these various device/protocol throughput indications. The user can select anywhere from a single throughput stream to all throughput streams for display (aggregate). -
Page 214: Panning Left And Right
Zoom Mode (Hold Ctrl) Switches to Zoom Mode. Enable/Disable Smooth Scrolling Enables and disables the smooth scrolling. Highlighting Options Overview Highlight Active Instant Throughput When enabled, the pane will be synchronized to the active Overview selection. Selection Instant Throughput When enabled, the pane is Overview Follow... - Page 215 The mouse cursor automatically rolls around the screen, such that the user can smoothly scroll substantial amounts of time without having to press and release the mouse button several times. To use the keyboard to pan: Press LEFT or RIGHT Arrow to move incrementally left or right. To use the Navigator bar to pan: Navigator Position the mouse over the middle of the...
-
Page 216: Zooming In And Out
The analyzer application retains new timing origin entries. Click the Down arrow in the origin field to view and select previously entered timing origin entries. 14.2 Zooming In and Out Instant Throughput view provides a zoom feature to expand or contract the display to view information from a high level or low level. -
Page 217: Making Time Measurements
To define a new time span: span Type the new timing span in the field. The following values are allowed: s – seconds ms – milliseconds ns – nanoseconds ps – picoseconds If a unit is not specified, then the previously displayed unit is used. Press ENTER. - Page 218 Instant Throughput The vertical lines associated with the cursors are waved if not attached to an event, and straight when attached. To adjust cursor position, place the mouse pointer over either cursor and left click and drag to adjust position horizontally Right Line Not Attached Both Lines Attached Drag the mouse to the desired location or desired event.
- Page 219 The vertical position of the displayed timing information, including the horizontal arrows, can be changed by selecting the information with the mouse pointer, then dragging to the desired position. To add additional cursors: Right click over an existing set of timing cursors. Select Duplicate to make available another set of cursors with the exact time spread as the original, or select...
- Page 220 The B cursor is placed at the location selected, and timing information is provided, including number of slots. Page 220 of 264 | Instant Throughput...
-
Page 221: Security Pane
15. Security Pane Security Security pane displays encryption-related information and allows for various user inputs. The pane will update as traffic is recorded, and can be saved with the capture, alleviating the need to re-enter link keys Security on successive captures. The pane also accepts user-entry of link keys, a private key, PIN codes, and user-defined device names. -
Page 222: Debug Mode
15.2 Debug Mode When Debug Mode is used, the analyzer will use the pre-defined Diffie Hellman private key and public keys that are used with this mode to automatically decrypt the traffic. 15.3 Proper Entry of Link Key Security Entry of a link key into the pane may be needed to decrypt traffic, especially for SSP pairings. -
Page 223: Indicators And Icons
15.5 Indicators and Icons Various background colors are used to provide the user with an at-a-glance understanding of each security event. Background Description Link key and/or PIN code calculated Conflict with PIN code or incorrect link key entered (note the differing PIN codes at left) Link key not entered Various icons indicate pairing and decryption status: Icon... -
Page 224: Entry Of User-Defined Device Names
To calculate public keys from a private key: Security Select Manage SSP Keys from the pane toolbar. Secure Simple Pairing Key Management window opens: Enter the private key in the Private Key box. Select Add. The public keys are calculated and displayed in the Public Key X and Public Key Y boxes. The public keys can now be copied to the clipboard by right-clicking either public key box and selecting Select All (or double- click and select Copy). - Page 225 Security Details window opens: Enter the desired name in one or both device Name boxes. The user-entered name now appears in the Security pane as well as throughout various panes in the application. Security Pane | Page 225 of 264...
-
Page 226: Instant Piconet Pane
16. Instant Piconet Pane Instant Piconet pane provides an instantaneous, dynamic, and graphical depiction of Bluetooth devices, Instant Piconet events, and topologies captured by the analyzer. The pane updates as traffic is captured and can also be used on saved captures to step through topology changes. Features are provided to show/hide labels (BD ADDR, LMP name, or user-defined name) and to show/hide broadcast events. -
Page 227: Instant Piconet Graphics And Icons
Instant Piconet pane toolbar: Instant Piconet Follow live. tracks topology while capturing. Instant Piconet Instant Timing Note: When active, cursor in is disabled. Previous change. Next change. Previous data channel topology change. Next data channel topology change. Timestamp of current view (links to Overview when selected). Show/hide addresses/device labels. - Page 228 Represents an active data connection. Throughputs are indicated. Represents a scatternet composed of two simple piconets. The device in the center is the slave of the device on the right, and the master of the device on the left. Page 228 of 264 | Instant Piconet Pane...
- Page 229 Represents an inquiry. The inquirer device is represented with blue outline, like masters, while responding devices are represented with black outline. Represents a paging. The pager device is represented with blue outline, like masters, while the paged device is represented with black outline. And here are a few more details about other visual elements: Simple Piconet, Showing a Paging Simple Piconet, Showing a still connection...
-
Page 230: Display Features
Piconet, with data transfers shown Simple Scatternet 16.2 Display Features To use the flyover: Position the mouse over any device. Page 230 of 264 | Instant Piconet Pane... - Page 231 The flyover indicator appears, advising the user of the device’s name, and master/slave status: To show/hide BD ADDR, LMP Name, or user-provided name: Instant Piconet Toggle the ADDR button in the toolbar. Each device shown will show/hide the BD ADDR. If an LMP name is available, this will be displayed. If the user Devices has edited the device name in the window, the edited name will be displayed.
-
Page 232: Details Pane
17. Details Pane Details pane provides detailed information on the event selected in the Overview, including protocol and Details profile decoding, baseband information, and various format options. The pane also provides a very useful feature allowing the user to re-populate the Overview, by allowing the user to add selected fields of interest into the Overview to create a new column. - Page 233 Details toolbar: Details Pane | Page 233 of 264...
- Page 234 Functions available on the Details toolbar are described below: Show all fields. Some fields not typically needed (such as good CRC values) are hidden by default. Adds selected field to active Overview (you can also select/drag a field to an Overview) Show numeric values in decimal.
-
Page 235: Abstraction And Relationship To Overviews
17.1 Abstraction and Relationship to Overviews Details pane will show all elements of higher level abstracts when these are selected, and as lower-level Details abstracts are exposed in the Overview and selected, the pane will drill-down to match the abstraction level selected (e.g., transaction, request, response, packet, etc.). - Page 236 When selecting just the SDP Service Search Attribute Request, only this request (and underlying protocols, Details profiles, and packets) will be provided in the pane: This concept holds true as each underlying Overview element is exposed, for example as shown below where a NULL (ACK) baseband packet is selected: Page 236 of 264 | Details Pane...
-
Page 237: Adding Details Fields To An Overview
Grouping of procedures and transactions is enabled or disabled by selecting or deselecting the Group Procedures and Transactions selection, available in the Protocol: drop-down menu, shown below. This feature is enabled by default. With Group Procedures and Transactions selected, transactional grouping is displayed at the highest level, such as shown below, where the ATT READ subsumes a transaction consisting of and ATT READ REQUEST and an ATT READ RESPONSE. - Page 238 Details pane repopulates to show details on the event selected. Details Select the desired field in the pane. Details Select the Show in Overview button in the toolbar. Or Details Left click and drag the desired field from the pane and drop in the Overview. Details The field from the pane is now shown in the Overview.
-
Page 239: Rssi Strength Characterizations
17.3 RSSI Strength Characterizations Details In the pane, a categorical characterization is provided to advise the user of RSSI strength on a selected Bluetooth packet (BLE or BR/EDR). This measurement is made at the antenna on which the signal was received. Sniffer Radio Details RX Strength... -
Page 240: Raw Data Pane
18. Raw Data Pane Raw Data pane provides a low-level data view of items selected in the Overview and includes various Raw Data Details Details format and copy options. The pane is linked to the pane, as fields selected in the Raw Data pane are highlighted in the pane, and therefore it is indirectly linked to the selection in the active... -
Page 241: Formatting The Raw Data Pane
Press ENTER. Raw Data The left area of the pane is searched. Strings found are highlighted in blue in the left and right areas. 18.3 Formatting the Raw Data Pane To format the Raw Data pane display: Raw Data Right-click in the left or right areas in the pane. -
Page 242: Protocol Error Verifications
19. Protocol Error Verifications The analyzer is designed to detect and display various errors and warnings. Errors of several types are flagged Details in the Overview and the pane. Detection and display of these errors can be disabled as desired. To open the Protocol Verifications tab: Select Tools | Options from the menu. - Page 243 Details Display of errors in the pane: Errors are flagged on the lowest level element that contains the error, and up into the higher-level abstracts as shown below. Warnings such as RSSI Too Low or CRC is not valid are also flagged. Placing the mouse over the flagged error provides an indication of the specific error: Protocol Error Verifications | Page 243 of 264...
-
Page 244: Tasks Pane
20. Tasks Pane Tasks pane provides the user with statuses on various actions initiated by the user and allows the user to cancel tasks in progress. To access the Task pane: Select View | Other Windows | Tasks from the menu. Tasks pane appears: Tasks... -
Page 245: Ble Hopping Sequence Calculator
21. BLE Hopping Sequence Calculator There are two types of channel hopping sequences defined for Bluetooth Low Energy. These hopping sequences are also called Channel Selection Algorithms (CSAs). The application provides a convenient tool to calculate a hopping sequence using either method. The channels available for sending of packets are classified as used or as unused (this is called the channel map). -
Page 246: Csa#1
21.1 CSA#1 CSA#1 (LE Default Hopping Selection tab) adds a constant increment for each channel hop (called a Hop Channel Map Increment). Selections are provided to enter the manually (in hex or binary), by toggling the Hop Increment channels (00 through 36), or by selecting All or Minimum as desired. The slide bar is provided to set the desired increment. -
Page 247: Software And Support
22. Software and Support The software application is unified across all Ellisys platforms (Explorer, Tracker, and Vanguard). The user may request a link to the software application from Ellisys at https://www.ellisys.com/support/download.php. The Help menu in the analyzer application provides convenient access to the latest updated software and technical support from an Internet-connected PC. - Page 248 Windows Internet settings (which are configured in Internet Explorer). If Internet Explorer can access Internet, then most likely the update mechanism will work as well. If your internal network will not allow access to the Ellisys software update site, or if you are otherwise unable access this...
-
Page 249: Getting Technical Support
The user can access technical support from the Help menu, which will open the default browser to the Ellisys technical support web page. In the event of a software malfunction or crash, the user can easily and automatically compress pertinent application information to be E-mailed to the Ellisys support team. -
Page 250: Flying Leads Probe - Explorer
24. Flying Leads Probe – Explorer The Flying Leads Cable connects the IO Probe Connector receptacle (located on the back panel) to one or more external HCI, WCI-2, Audio I2S, generic communications (UART, SPI, SWD, and I2C), or logic signal implementations. -
Page 251: Flying Leads Probe - Tracker And Vanguard
The figures below illustrate the keyed female plug on the probe, the keyed receptacle on the analyzer, and the wire colors. N.C. = Not Connected Figure 17 Flying Leads Probe and IO Probe Receptacle Figure 18 Probe Pin and Color Assignments – Tracker and Vanguard Flying Leads Probe – Tracker and Vanguard | Page 251 of 264... -
Page 252: Remote Api And Cli
API which allows for automated control of the application, including precise extraction of captured traffic. The link to download the Remote API is here: https://www.ellisys.com/better_analysis/bta_remote_api.zip. The download includes an introductory guide for the API, the plug-in DLL, and sample code written in C# and Python, and pertinent “ReadMe”... -
Page 253: Frequently Asked Questions
Manager, typically located in the Windows Control Panel, selecting the attached Ellisys analyzer, and manually pointing via “Update Driver” to the Ellisys “Drivers” folder which installs with the Bluetooth Explorer application. This folder is typically located in your Program Files folder at [path]\Ellisys\Ellisys Bluetooth Analyzer\Drivers. - Page 254 Q. Does the Radio Sensitivity slide bar in the Recording Options menu work for all radios? A. On Vanguard, the sensitivity setting is for Bluetooth only. On Explorer and Tracker, it affects Wi-Fi in the 2.4G band, but not 5G.
- Page 255 Fi Security button, located on the toolbar of the Wi-Fi Overview). Q. Can I request a feature addition? A. Yes, please feel free to open a dialog with Ellisys on such requests. Contact us at support@ellisys.com. Frequently Asked Questions | Page 255 of 264...
-
Page 256: Explorer Technical Characteristics
28. Explorer Technical Characteristics Bluetooth Capture Characteristics HCI Capture Characteristics Ellisys Rainbow™: Industry's first USB HCI transport: Low, Full, and High wideband concurrent capture of all Speed, with automatic detection Bluetooth channels. Introduced in UART HCI transport: Up to 8 Mbit/s, ... - Page 257 Power: 12-24 VDC, max 18 W captured traffic Trigger: SMA in and out, 50 Ω, max Use Ellisys hardware on any computer – 5VDC (Not Implemented) no additional licenses needed IO Probe: supports UART / SPI HCI, ...
-
Page 258: Tracker Technical Characteristics
75 x 75 x 17 mm (2.9 x 2.9 x 0.7'') captured traffic 100 g (0.2 lbs.) Use Ellisys hardware on any computer – no additional licenses needed Page 258 of 264 | Tracker Technical Characteristics... - Page 259 Warranty Two years limited hardware warranty for Professional and Enterprise editions One-year limited hardware warranty for Basic and Standard editions Tracker Technical Characteristics | Page 259 of 264...
-
Page 260: Vanguard Technical Characteristics
Data rate: 250 kbps Modulation: O-QPSK 512 MB of FIFO memory Timing accuracy: 125 ns Data is stored in highly optimized format Analyzed data is uploaded in real time Page 260 of 264 | Vanguard Technical Characteristics... - Page 261 required) Earth: Optional, to ground the unit Maintenance and Licensing Free lifetime software updates – no maintenance fees Free full-featured viewer software – easily share annotated traces between Vanguard Technical Characteristics | Page 261 of 264...
- Page 262 Warranty captured traffic Use Ellisys hardware on any computer – Two-year limited warranty [STD and PRO] no additional licenses needed Three-year limited warranty [ENT] Page 262 of 264 | Vanguard Technical Characteristics...
-
Page 263: Gatt Customizations
31. GATT Customizations Source of Analyzer’s GATT Definitions The analyzer software uses the Generic Attribute (GATT) definitions that are developed and provided by the Bluetooth Special Interest Group (SIG). These are provided in XML format. GATT Defined GATT is designed to operate upon Attribute Protocol (ATT). GATT defines a hierarchical data structure that provides a standardized method for discovery of device services and characteristics, which are used the manage the transfer of data between devices. - Page 264 Using Modified GATT XML It is possible to customize GATT XML definitions to allow the Ellisys analyzer application to decode vendor-specific profiles or override existing profiles. Customized GATT XML files must be placed in the path below: %USERPROFILE%\Documents\Ellisys Bluetooth Gatt\...
Need help?
Do you have a question about the Vanguard and is the answer not in the manual?
Questions and answers