
Summary of Contents for RPM DL10
- Page 1 PERFORMANCE PRODUCTS INC. DL10 DATA LOGGER AND RPMPRO SOFTWARE RPM PERFORMANCE PRODUCTS INC 7213 NW 3RD ST, OKLAHOMA CITY, OK 73127 405-495-0454 rpmperf.com...
-
Page 2: Table Of Contents
TABLE OF CONTENTS PAGE INTRODUCTION...................3 SETUP......................4 COMM PORT SETUP........4 DATA LOGGER SETUP......4 GRAPHICS SETUP........8 DISPLAYING REAL TIME DATA...............11 RECORDING DATA..................11 DOWNLOADING DATA................11 GRAPHING RUN DATA................13 INITIAL DISPLAY........13 ADDING/REMOVING CHANNELS..13 TIME SLIP / NOTES DISPLAY....14 ZOOMING IN/OUT........14 MODIFYING DISPLAY......14 LOG BOOK....................16 SETTING UP YOUR LOG PAGE....16 ENTERING DATA TO LOG PAGE....16 CALIBRATING CHANNELS................17... -
Page 3: Introduction
Once the initial setup is done to your liking, most of the rest is automatic. Once you get used to using the data provided by the DL10 we are certain you will be very pleased with your unit and software. -
Page 4: Setup
To setup the data logger you will need to connect the DL10 to the PC and turn on the 12 volt power to the logger. - Page 5 (4 magnet collar) and 2 pulses per sample. This gives 2 samples per revolution while the RPM is low at launch. Set the Samples per second to 100. If the pulses per sample is set to a value less than the number of pulses per revolution it is important to install the magnets so that the spacing between magnets is equal.
- Page 6 3 seconds of prelaunch, the computer will begin recording when the record button is pressed, and then watch for the engine RPM to exceed 5000. Once the RPM goes over 5000 during staging or at launch, the computer will store the previous three seconds of data, then record the run in the remaining memory.
- Page 7 Auto Start channel is not working. For example, if the Auto start is set for drive shaft RPM only, and the sensor was unplugged while working under the car and not plugged back in, the computer would not store the run.
-
Page 8: Graphics Setup
The first column on the left shows the data channels available in the data logger (the third RPM channel is not available yet). The columns to the right are used to set the graphics for each data channel. These columns are labeled Position, Scale, Show/Hide Scale, Name, Filter and Default. - Page 9 What this means is that once you get used to what your engine RPM and drive RPM look like, it will be obvious to you which one is which even if they are the same color, so for Run1 you could set the channels to different shades of blue and Run 2 to different shades of red, Run 3 to greens and so on.
- Page 10 If you used the Auto Zero function above, the start second for launch will be 0, so if you want to see some of the data prior to launch, set the graph seconds prior to launch to a negative number of seconds before launch such as -2 to see 2 seconds before launch. If you do not use the Auto Zero, the first second of the recording will be 0, and the "seconds before launch"...
-
Page 11: Displaying Real Time Data
DISPLAYING REAL TIME DATA The DL10 data logger allows you to monitor real time data on your PC. This is useful for checking sensors and making adjustments. To monitor the sensors, connect the data logger to the PC, then from the CONNECT menu, select DISPLAY. - Page 12 destination used and offer it as the first choice. In this manner you can change to a new folder without having to select the path each time.
-
Page 13: Graphing Run Data
GRAPHING RUN DATA THE INITIAL DISPLAY The graphics display window in the RPMPRO software has four sections. The top line is the menu or "pull down menu" line. Below that is the Text window and below that are the two graph windows. The menu line operates in standard Windows fashion, click on the heading to pull down the menu selections for that category, then click on your choice. -
Page 14: Time Slip/Notes Display
TIME SLIP/NOTES DISPLAY Although the software provides for a detailed log book, we have found it useful to have quick access to important information regarding the run while the run data graph is being displayed. To bring up the quick information lines, RIGHT click on the filename listed in the far left column of the text portion of the display. - Page 15 Multiple Run Display When more than one run is loaded it is possible that the runs may have different setup files. If more than one run is being displayed, the setup file for Run 1 is used. If you have added or changed sensors along the way, and the channel names for runs 2 to 4 are different, the software will "gray out"...
-
Page 16: Log Book
LOG BOOK SETTING UP THE LOG PAGE Each time a run is downloaded from the data logger, the software stores a copy of the default log page with it. This log page can then be accessed while the run is opened and specific data for that run can be entered and saved for future reference. -
Page 17: Calibrating Channels
CALIBRATIONS Each of the four analog channels, and the Accelerometer channel needs a calibration to convert the voltage reading into the actual pressure, temperature or other reading. Most sensors will come with a calibration sheet, and you need only enter those values. If you purchased sensors with your unit, we have already entered the calibrations for you (except shock travel and other sensors that need to be calibrated on the car). -
Page 18: Analog (Aux 1-4)
ANALOG CHANNEL CALIBRATIONS The analog channels will have two or more calibration points, depending on the sensor type. For temperature, pressure, vacuum and EGT sensors, a calibration sheet will be supplied with the sensor, and you simply enter the cals as shown on the sheet. For shock travel, position and other selected sensors you will need to calibrate them to actual reading taken with the sensor mounted on the car. -
Page 19: Menu Descriptions
MENU DISCRIPTIONS FILE MENU Clicking on FILE in the menu section at the top of the screen will drop down the following selections to choose from: OPEN To open and graph one or more runs, click OPEN to bring up the file select window. - Page 20 The display has Select, Run #, Data/Time and File Name columns. For each run stored, there will be information in the Run#, Date and Time columns. If the run had been downloaded previously, the File Name column will also have the file name it was stored under.
-
Page 21: Edit Menu
SETUP This function allows you to set the Record functions of the Data Logger. This includes the sample rates, active channels, run storage capability and acquisition start functions. These functions are explained in the DATA LOGGER SETUP section in the beginning of this manual. EDIT MENU The two functions of under the EDIT menu allow you to "Crop"... -
Page 22: Setup Menu
GRAPH SETUP MENU The Default Graph Setup is stored in the Data Logger and is used to determine how a run is to be displayed when downloaded from the Data Logger. (This is explained in the SETUP section at the beginning of this manual.) The difference between the Default Graph Setup in the CONNECT menu, and this Graph Setup is that this Graph Setup only applies to the way the opened run is displayed, while the Default Graph Setup will change the way any run downloaded will be displayed. -
Page 23: Help Menu
HELP MENU The HELP selection allows you to view this software manual. The manual provides detailed explanations of the menus and functions of the software. ZOOM OUT The ZOOM OUT selection has two functions, depending on whether the display has been zoomed in from the Default Graph or not. -
Page 24: Installation
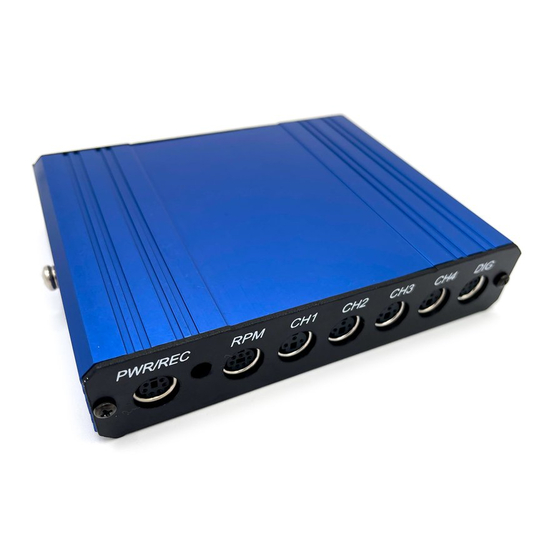
INSTALATION The DL10 system is easy to install, but it is important to remember a few guidelines. By taking the time to install the system according to these guidelines, you can ensure reliable operation and accurate data. DATA LOGGER The Data Logger can be mounted at any angle just about anywhere in the car. Adhesive backed Velcro is a quick and easy method, or you can use the mounting screws on the sides of the computer.. - Page 25 The most frequent cause of RPM sensor failure is when the sensor wires are subjected to frequent flexing at the point where they leave the sensor. To prevent this, once the sensor is mounted, tie wrap the wires to the mount in such a way that it limits their movement.
- Page 26 The depth of the probe into the header tube is also important. The thing to remember is that the probe tip should be at least 1/4" inside the main flow of the exhaust gasses. In most cases the main exhaust flow leaving the head flows to the top of the exhaust tube. This means that if you have mounted the probe to the top of the tube, it should extend into the tube about 3/8 to 1/2 inch.
Need help?
Do you have a question about the DL10 and is the answer not in the manual?
Questions and answers