Chapters
Table of Contents

Related Manuals for Anritsu MP2110A BERTWave


Summary of Contents for Anritsu MP2110A BERTWave
- Page 1 MP2110A BERTWave Operation Manual 18th Edition For safety and warning information, please read this manual before attempting to use the equipment. Keep this manual with the equipment. ANRITSU CORPORATION Document No.: M-W3831AE-18.0...
- Page 2 Ensure that you clearly understand the meanings of the symbols BEFORE using the equipment. Some or all of the following symbols may be used on all Anritsu equipment. In addition, there may be other labels attached to products that are not shown in the diagrams in this manual.
-
Page 3: For Safety
● The performance-guarantee seal verifies the integrity of the equipment. To ensure the continued integrity of the equipment, only Anritsu service personnel, or service personnel of an Anritsu sales representative, should break this seal to repair or calibrate the equipment. Be careful not to break the seal by opening the equipment or unit covers. - Page 4 For Safety WARNING Falling Over ● This equipment should always be positioned in the correct manner. If the cabinet is turned on its side, etc., it will be unstable and may be damaged if it falls over as a result of receiving a slight mechanical shock.
- Page 5 Back-up Battery backup the memory. This battery must be replaced by service personnel when it has reached the end of its useful life; contact the Anritsu sales section or your nearest representative. Note: The battery used in this equipment has a maximum useful life of 2 years.
- Page 6 ● The USB flash drive may be damaged by static electric charges. ● Anritsu has thoroughly tested all external storage media such as USB flash drive, Hard disk drive and DVD drive. Users should note that external storage media may not have been tested by Anritsu, thus Anritsu cannot guarantee the performance or suitability of such media.
- Page 7 It is recommended to periodically back up all important data and programs to protect them from being lost accidentally. Anritsu will not be held responsible for lost data. To reduce the possibility of data loss, particular attention should be given to the following points.
- Page 8 For Safety CAUTION Use in a Residential This instrument is designed for an industrial environment. Environment In a residential environment this instrument may cause radio interference in which case the user may be required to take adequate measures. Use in Corrosive Exposure to corrosive gases such as hydrogen sulfide, sulfurous acid, Atmospheres and hydrogen chloride will cause faults and failures.
- Page 9 In addition, this warranty is valid only for the original equipment purchaser. It is not transferable if the equipment is resold. Anritsu Corporation shall assume no liability for damage or financial loss of the customer due to the use of or a failure to use this equipment, unless the damage or loss is caused due to Anritsu Corporation’s intentional or gross...
- Page 10 Anritsu Corporation Contact In the event of this equipment malfunctions, please contact an Anritsu Service and Sales office. Contact information can be found on the last page of the printed version of this manual, and is available in a separate file on the...
- Page 11 Notes On Export Management This product and its manuals may require an Export License/Approval by the Government of the product's country of origin for re-export from your country. Before re-exporting the product or manuals, please contact us to confirm whether they are export-controlled items or not. When you dispose of export-controlled items, the products/manuals need to be broken/shredded so as not to be unlawfully used for military purpose.
- Page 12 2012/19/EU (the “WEEE Directive”) in European Union. For Products placed on the EU market after August 13, 2005, please contact your local Anritsu representative at the end of the product's useful life to arrange disposal in accordance with your initial contract and the local law.
- Page 13 Anritsu electronic equipment, etc.). By using this Software, you shall be deemed to have agreed to be bound by the terms of this EULA, and Anritsu Corporation (hereafter Anritsu) hereby grants you the right to use this Software with the Anritsu specified equipment (hereafter Equipment) for the purposes set out in this EULA.
- Page 14 US embargoed countries or (b) to anyone financial or otherwise, due to your violation restricted by the Japanese export control of the terms of this EULA, Anritsu shall have regulations, or the US Treasury the right to seek proportional damages from Department's list of Specially Designated you.
- Page 15 Cautions Against Computer Virus Infection ● Copying files and data Only files that have been provided directly from Anritsu or generated using Anritsu equipment should be copied to the instrument. All other required files should be transferred by means of USB flash drive or CompactFlash media after undergoing a thorough virus check.
- Page 16 CE Conformity Marking Anritsu affixes the CE conformity marking on the following product(s) in accordance with the Decision 768/2008/EC to indicate that they conform to the EMC, LVD, and RoHS directive of the European Union (EU). CE marking 1. Product Model...
- Page 17 B: The equipment shall continue to operate as intended after the test. No degradation of performance or loss of function is allowed below a performance level specified by the manufacturer, when the equipment is used as intended. The performance level may be replaced by a permissible loss of performance.
- Page 18 4. Contact Name: Anritsu GmbH Address, city: Nemetschek Haus, Konrad-Zuse-Platz 1 81829 München, Country: Germany Name: ANRITSU EMEA Ltd. Address, city: 200 Capability Green, Luton Bedfordshire, LU1 3LU Country: United Kingdom xviii...
- Page 19 RCM Conformity Marking Anritsu affixes the RCM mark on the following product(s) in accordance with the regulation to indicate that they conform to the EMC framework of Australia/New Zealand. RCM marking 1. Product Model Model: MP2110A BERTWave 2. Applied Standards...
- Page 20 About Eco label The label shown on the left is attached to Anritsu products meeting our environmental standards. Details about this label and the environmental standards are available on the Anritsu website at https://www.anritsu.com.
-
Page 21: About This Manual
The manual set for the BERTWave Series consists of the following five operation manuals: MP2110A BERTWave Operation Manual (M-W3831AE) (This Manual) This manual is intended for those who use the MP2110A BERTWave, and explains the installation procedure, handling precautions, connector connection procedures, panel operations, maintenance procedures, specifications and various functions. - Page 22 • Windows file operations and the Windows Control Panel Manual Notation System The MP2110A BERTWave is referred to as the MP2110A in this manual. The user interface such as button and tab names are in bold. Example: PPG, System Menu The connector names on the panel are in Arial –...
-
Page 23: Table Of Contents
Table of Contents For Safety ............iii About This Manual ..........I Chapter 1 Outline ..........1-1 Introduction of BERTWave .......... 1-2 Configuration .............. 1-9 Features ..............1-16 Intended Use ............1-17 Technical Terms ............1-20 Abbreviations ............1-45 Chapter 2 Before Use ......... - Page 24 Chapter 4 Screen Operation ......4-1 Window Configuration ..........4-2 Data Input Method ............4-5 Setting System Menu ..........4-8 Multi-channel Signal Output ........4-19 Simultaneous Measurement Start and Stop at Multi-channels ............4-20 Linking Measurement Settings for Multiple Channels . 4-21 Displaying BER Measurement Results for Multiple Channels .............
- Page 25 Chapter 8 Maintenance ........8-1 Daily Maintenance ............8-2 Replacement of Optical Connector ......8-3 Optical Connector/Optical Adapter Cleaning ....8-5 Displaying Software Version........8-8 Updating Software ............8-9 Adding an Option License ......... 8-10 System Recovery Function ........8-12 Calibration ..............
-
Page 27: Chapter 1 Outline
Chapter 1 Outline This chapter explains the MP2110A BERTWave configuration, features, and technical terms used in this manual. Introduction of BERTWave ........... 1-2 1.1.1 MP2110A BERTWave ........1-3 1.1.2 MP2100B BERTWave ........1-8 Configuration ..............1-9 1.2.1 Standard Configuration ........1-9 1.2.2 Options ............ -
Page 28: Introduction Of Bertwave
Chapter 1 Outline 1.1 Introduction of BERTWave The BERTWave is a measuring instrument that combines the functions of a pulse pattern generator (PPG), bit error detector (ED) and sampling oscilloscope all-in-one instrument. The PPG is a digital signal generator that can edit the data rate, the voltage level of the pulse, and the pattern of data to be transmitted. -
Page 29: Mp2110A Bertwave
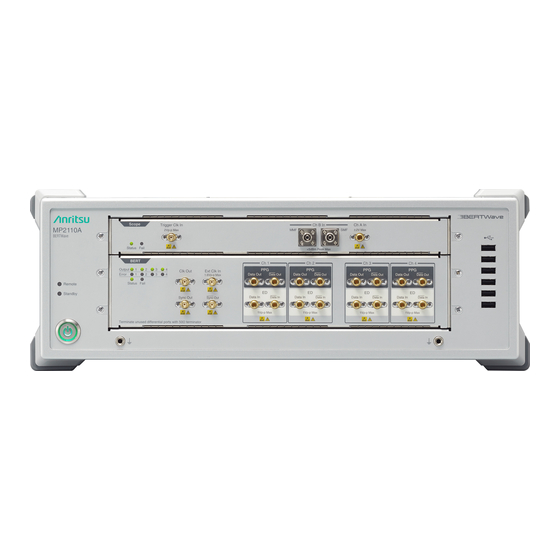
Introduction of BERTWave 1.1.1 MP2110A BERTWave MP2110A BERTWave (MP2110A) is a measuring instrument combining the BERT (Bit Error Rate Tester) and the sampling oscilloscope. It is used by connecting with the monitor, key board, and mouse as the same as PC. - Page 30 Chapter 1 Outline Scope: Sampling Oscilloscope BERT: Bit Error Rate Tester Figure 1.1.1-2 Front Panel of MP2110A The input connectors of the sampling oscilloscope can be selected by specifying the option. Table 1.1.1-1 Sampling Oscilloscope Input Connectors Channel A Channel B Channel C Channel D Options Number Electrical Optical Optical Electrical Optical Optical Optical Optical OpticalOptical...
- Page 31 Introduction of BERTWave BERT (Bit Error Rate Tester) uses PPG (Pulse Pattern Generator) and ED (Error Detector) together. The number of BERT channels can be selected by specifying the option. Table 1.1.1-2 Number of BERT Channels Option Number Number of Channels MP2110A-011 MP2110A-012 MP2110A-014...
- Page 32 Chapter 1 Outline By installing MP2110A-095 PAM4 Analysis Software, PAM4 waveform can be analyzed. Figure 1.1.1-3 Example of PAM4 Waveform Analysis...
- Page 33 Introduction of BERTWave By installing MP2110A-096 Jitter Analysis Software, jitter analysis result can be displayed. Figure 1.1.1-4 Example of Jitter Analysis...
-
Page 34: Mp2100B Bertwave
Figure 1.1.2-1 MP2100B External View MP2100B BERTWave is a space-saving measuring instrument that can operate using the 12.1-inch touch panel. The SFP slot and O/E converter can be added as the option. Refer to the following website for the MP2100B BERTWave information. https://www.anritsu.com/en-us/test-measurement/products/mp2100b... -
Page 35: Configuration
Configuration 1.2 Configuration 1.2.1 Standard Configuration The following table lists the standard configuration of the MP2110A. Table 1.2.1-1 Standard Configurations Model/ Item Product Name Q’ty Remarks Ordering No. Main unit MP2110A BERTWave Accessories POWER CORD Contained in accessory box. J1627A GND connection cable Z1364A MX210000A... - Page 36 Chapter 1 Outline Table 1.2.1-2 Connection Destination and Quantity of J0617B and Z0397A Option Number Connection Destination Q’ty MP2110A-030, MP2110A-040 Optical In SMF A, B, C, D MP2110A-039, MP2110A-049 Optical In MMF A, B, C, D MP2110A-022, MP2110A-032, Ch A In SMF, Ch A In MMF, MP2110A-042 Ch B In SMF, Ch B In MMF MP2110A-023, MP2110A-033,...
- Page 37 Configuration Table 1.2.1-4 Connection Destination and Quantity of J1341A Option Number Connection Destination Q’ty MP2110A-011 Ext Clk In, Clk Out, Sync Out×1, Data In×1, In×1 Data MP2110A-012 Ext Clk In, Clk Out, Sync Out×1, Data In×2, In×2 Data MP2110A-014 Ext Clk In, Clk Out, Sync Out×1, Data In×4, In×4 Data MP2110A-030,...
-
Page 38: Options
The MP2110A options are shown below. The numbers of the options installed are indicated on the label on the rear panel. For details of whether retro-fitted options or software options are included, please refer to the ordering information on the Anritsu website. https://www.anritsu.com/en-us/test-measurement/products/mp2110a 1-12... - Page 39 Configuration Table 1.2.2-1 MP2110A Option List Option Number Name MP2110A-011 1CH BERT* MP2110A-012 2CH BERT* MP2110A-014 4CH BERT* MP2110A-021 Dual Electrical Scope* MP2110A-022 Dual Optical Scope* MP2110A-023 Optical and Single-ended Electrical Scope* MP2110A-024 Precision Trigger* MP2110A-025 Optical Scope for Singlemode* MP2110A-026 Optical Scope for Multimode* MP2110A-030...
-
Page 40: Optional Accessories
Chapter 1 Outline 1.2.3 Optional Accessories Table 1.2.3-1 shows the optional accessories for MP2110A Contact us to confirm the specifications of the optical switch and programmable optical attenuator. Table 1.2.3-1 Optional Accessories Model/Order No. Name B0734A Carrying Case B0735A Rack Mount Kit G0307A Clock Recovery Module (<2.667G) G0342A... - Page 41 Fixed Optical Attenuator (1dB) J1825A Fixed Optical Attenuator (2dB) J1826A Fixed Optical Attenuator (3dB) J1827A Fixed Optical Attenuator (5dB) W3831AE MP2110A BERTWave Operation Manual* W3773AE BERTWave Series Remote Control Operation Manual* Z0306A Wrist Strap Z0541A USB Mouse Z0914A Ferrule Cleaner...
-
Page 42: Features
(typical value) (MP2110A-024) For sampling oscilloscope: EYE analysis in short time using high-speed sampling Compatibility of remote commands with previous Anritsu measuring instruments One or both of the following clock recovery units can be installed to the sampling oscilloscope: ... -
Page 43: Intended Use
Intended Use 1.4 Intended Use The MP2110A can be used for the following applications: Evaluating optical transceivers used in optical fiber communications Evaluating parts for digital communications Evaluating optical transceivers used in optical fiber communications Computer-based and public communications systems transmit and receive digitalized signals. - Page 44 Chapter 1 Outline The receiver sensitivity which is one of the performances in the optical transceiver is calculated by measuring the bit error rate and optical power. The following figure shows a connection example between the DUT and the measuring instruments when the DUT is the CFP4 module. TX1 to TX4 RX1 to RX4 Data and...
- Page 45 Intended Use The output waveform of the optical transceiver is evaluated using the pulse pattern generator and sampling oscilloscope. The output of optical transceiver is the wavelength multiplexed optic. Therefore, input only the optic of the wavelength to be measured using the optical demultiplexer or optical filter to MP2110A.
-
Page 46: Technical Terms
Chapter 1 Outline 1.5 Technical Terms This section explains the technical terms used in this manual. BER: Bit Error Rate The Bite Error Rate is the ratio of the total received bits and error bits. It depends on the SNR (signal to noise ratio). Standard Deviation of Noise Amplitude n Signal Amplitude s... - Page 47 Technical Terms SNR (dB) Figure 1.5-2 Relationship between SNR and BER Bit Rate The Bit Rate is the speed at which the communications interface transmits and receives data. It is expressed by the number of bits transmitted per second (bit/s or bps). 1-21...
- Page 48 Chapter 1 Outline Bathtub As an evaluation method of eye pattern waveform, there is a graph that displays the measurement result with time as the horizontal axis and bit error rate as the vertical axis. The left and right edges of the graph are the positions of the cross points of the eye pattern waveform, and have large bit error rates.
- Page 49 Technical Terms DCD: Duty Cycle Distortion The duty cycle distortion (DCD) is found from the following equation: DCD = (t – t )/Bp × 100 Where, : Time at crossing point between 50% level of Eye Amplitude and rising waveform : Time at crossing point between 50% level of Eye Amplitude and falling waveform Bp: Bit cycle...
- Page 50 Chapter 1 Outline DDJ vs Bit The amount of jitter, which is measured for each bit whose pattern changes, is displayed as a graph. The time difference between the clock and the waveform at the cross point level is measured and the result is plotted on the pattern location. When the waveform time is slower than the clock, the value is positive, and when the waveform is faster than the clock, the value is negative.
- Page 51 Technical Terms DDPWS (Data Dependent Pulse Width Shrinkage) DDPWS is the amount of pulse width shrinkage by data dependent jitter. 4… Figure 1.5-6 DDJ Measurement Method In Figure 1.5-6, the red line is the ideal symbol waveform and the blue line is the measured waveform with jitter.
- Page 52 Chapter 1 Outline Dual Dirac Estimation If the jitter elements include DJ, the histogram has multiple peaks at the waveform cross point. Dual Dirac Estimation is a method to estimate RJ and DJ using Dual Dirac function as the fitting curve of this histogram. Figure 1.5-7 Histogram of Jitter with DJ The Dual Dirac distribution is expressed as the combined formula of two normal distributions.
- Page 53 Technical Terms The Dual Dirac distribution assumes that RJ is the normal distribution and DJ is a constant value. The Jitter Analysis software displays σ and µ –µ of the Dual Dirac distribution approximated from the measured histogram to RJ (d-d) and DJ (d-d) respectively. Extinction Ratio The extinction ratio is the ratio of 1 Level and 0 Level;...
- Page 54 Chapter 1 Outline Eye Height For NRZ, eye height can be calculated by the following formula. Refer to Figure 1.5-21. Eye Height = (1 Level–3 ) – (0 Level +3 : 1 Level Standard Deviation : 0 Level Standard Deviation For PAM4, eye height varies depending on eye definition method and sample method.
- Page 55 Technical Terms Eye Levels, Eye Widths Eye Widths are the eye widths of the PAM4 waveform. They depend on how the eyes are defined. Eye Levels are the levels to measure eye widths. Level 3 Eye Width Upper Eye Level Upper Level 2 Eye Width Middle...
- Page 56 Chapter 1 Outline Eye Pattern The Eye Pattern is the pattern created by superimposing the digital waveforms sampled at the same timing. First measured waveform Second measured waveform Third measured waveform Fourth measured waveform Super- imposed waveforms Eye pattern Figure 1.5-14 Eye Pattern Drawing Method 1-30...
- Page 57 Technical Terms Eye Skews When PAM4 waveform and Sample Timing is Independent, Eye Skews are phase differences between the average value of the center of each eye (Eye Center) and the centers of Upper Eye, Middle Eye and Lower Eye. Eye Skew Middle Eye Skew Upper Level 3...
- Page 58 Chapter 1 Outline Eye Width Eye Width is equivalent to Eye Height in the horizontal direction. For NRZ, it is calculated from a histogram of the two eye pattern crossing points in the time direction. Eye Width = (t – 3 ) –...
- Page 59 Technical Terms Jitter Jitter is the variation in the time of the crossover point between the Eye Diagram rising and falling parts of the waveform. Jitter p-p (Jitter p-p): Full width of histogram in time direction Jitter RMS (Jitter RMS): Standard deviation of histogram in time direction Jitter p-p...
- Page 60 Chapter 1 Outline Table 1.5-1 Jitter Type Abbrev. Name Description Total Jitter Jitter of combined RJ and DJ Not a simple sum of RJ and DJ Random Jitter Jitter which occurs with external factors such as thermal noise. It has a characteristic to spread unlimitedly which approaches Gaussian distribution.
- Page 61 Technical Terms Levels p-p, Levels RMS, Level Skews When measuring the histogram of each level with PAM4 waveform, the peak value of its width is Levels p-p and the standard deviation is Levels RMS. If Sample Timing is Independent, Levels p-p, Levels and RMS are measured at the following positions.
- Page 62 Chapter 1 Outline Linearity It indicates the degree that the three Eye Amplitudes of the PAM4 waveform deviate from one third of the difference between Level 0 and Level 3. If the three Eye Amplitudes are equal, the linearity is 1. It is calculated with the smallest eye amplitude out of the three eye amplitudes.
- Page 63 Technical Terms One Level At Eye pattern measurement, the maximum level at the center 20% of the bit interval is the average value of the high histogram. 100 % 20 % 1 level 3 Eye height Crossing amplitude point level 3...
- Page 64 Chapter 1 Outline Outer OMA It is the optical modulation amplitude of PAM 4 waveform, and it is the difference between Level 3 and Level 0. Overshoot It is the ratio of the maximum power to Level 3 in the PAM4 waveform and is calculated by the following formula: Overshoot = Pmax –Level 3 ...
- Page 65 Technical Terms RNzero: Electrical random noise power measured at Level 0 OMA: For NRZ signal, OMA, and for PAM4 signal, Outer OMA. Bandwidth of the filter used Rise/Fall Time The Rise Time is time taken for the signal level to change to the next level.
- Page 66 Chapter 1 Outline RMS (root mean square) This is the DC voltage consuming the equal power the same as the consumed power when impressing AC voltage on a resistance. In Voltage, RMS is DC voltage consuming the equal power when AC voltage is impressing on a resistance.
- Page 67 Technical Terms Sampling Oscilloscope The sampling oscilloscope is a function for monitoring the waveform of the input signal. It requires a clock input sampling and the waveform is drawn out of the clock timing. For a periodic signal like PRBS, the waveform data is obtained by slightly varying the sampling timing.
- Page 68 Chapter 1 Outline TDEC (Transmitter and Dispersion Eye Closure) TDEC is the measured value of the eye opening of the NRZ signal and is calculated by the following formula. For details, refer to 95.8.5.2 “TDEC measurement method” of the IEEE 802.3.
- Page 69 Technical Terms TDECQ (Transmitter and Dispersion Eye Closure for PAM4) TDECQ is the measured value of the eye opening of the PAM4 signal and is calculated by the following formula. Outer TDECQ = (dB) Qt: 3.414 where SER (Symbol Error Rate) = 4.8 × 10 (as specified –4 in the IEEE 802.3cd)
- Page 70 Chapter 1 Outline Pmin: Minimum power measured in the waveform VECP (Vertical Eye Closure Penalty) VECP is the ratio of eye amplitude to eye opening and is calculated by the following formula. log( VECP = (dB) : Optical Modulation Amplitude ...
-
Page 71: Abbreviations
Abbreviations 1.6 Abbreviations The abbreviations used in this manual are listed in Table 1.6-1. Table 1.6-1 Abbreviation Abbreviation Description 100GbE 100 Giga bit Ethernet 400GbE 400 Giga bit Ethernet Application Attenuator Average Bit Error Rate BERT Bit Error Rate Tester BERTS Bit Error Rate Test Set Binary... - Page 72 Chapter 1 Outline Table 1.6-1 Abbreviation (Cont’d) Abbreviation Description Ground GPIB General Purpose Interface Bus International Electrotechnical Commission Input Insertion Internal Inter Symbol Interference International Telecommunication Union Local Area Network Maximum MDIO Management Data Input/Output Multi-mode fiber Multiplexer Not Applied NECL Negative Emitter Coupled Logic Negative...
- Page 73 Abbreviations Table 1.6-1 Abbreviation (Cont’d) Abbreviation Description Signal to Noise Ratio Sampling Scope SSPRQ Short Stress Pattern Random Quaternary Synchronous Transfer Mode SYNC Synchronize, Synchronization TDEC Transmitter and Dispersion Eye Closure TDECQ Transmitter and Dispersion Eye Closure for PAM4 Total Jitter Trig.
- Page 74 Chapter 1 Outline 1-48.
-
Page 75: Chapter 2 Before Use
Chapter 2 Before Use This chapter explains the following items: • Procedures from unpacking through turning power-on • Panel name and operation • Control panel and peripheral devices settings • Damage prevention measures Unpacking and Installation .......... 2-2 2.1.1 Unpacking ............2-2 2.1.2 Installation............ -
Page 76: Unpacking And Installation
2.1 Unpacking and Installation 2.1.1 Unpacking At unpacking, check that all items are included. Contact an Anritsu Service and Sales office if any parts are missing or damaged. Keep the original packaging materials. They are required when transporting the BERTWave in future. - Page 77 Unpacking and Installation CAUTION • If the MP2110A is not installed in a “good” direction as above, a small shock may turn it over and harm the user. • Do not stack three or more MP2110As on top of each other when using them.
- Page 78 Chapter 2 Before Use CAUTION Although the MP2110A operates at an ambient temperature of 5 to 40°C, avoid using it in locations, such as the following, since it may cause failure. • In direct sunlight for extended periods • Outdoors •...
-
Page 79: Part Names
Part Names 2.2 Part Names 2.2.1 Front Panel Remote Scope Standby Connectors Functional BERT Functional Ground Terminal Power Switch Ground Terminal Figure 2.2.1-1 Front Panel (Scope+BERT) Remote Scope Standby Connectors Functional Functional Ground Terminal Power Switch Ground Terminal Figure 2.2.1-2 Front Panel (Scope+CRU) - Page 80 Chapter 2 Before Use Table 2.2.1-1 Front Panel Description Name Description Scope Panel of the sampling oscilloscope If no scope option is installed, this slot is filled with a blank panel. BERT Panel of the bit error rate tester If neither BERT option nor MP2110A-055 is installed, this slot is filled with a blank panel.
- Page 81 Part Names BERT Panel Error Output Clk Out Ext Clk In BERT Ch 1 Ch 2 Ch 3 Ch 4 Ext Clk In Clk Out Output 1.6Vp-p Max Data Out Data Out Data Out Data Out Data Out Data Out Data Out Data Out Error...
- Page 82 Chapter 2 Before Use Scope Panel Ch B In Ch A In Scope Trigger Clk In ±2V Max 2Vp-p Max ±2V Max Status Fail Ch A In Trigger Clk In Ch B In Fail Status Figure 2.2.1-4 Scope Panel Names (MP2110A-021) Ch A In Scope Trigger Clk In...
- Page 83 Part Names The following label is on the panel of MP2110A-030, MP2110A-032, MP2110A-033, MP2110A-035, MP2110A-036, and MP2110A-039. Baseband Flat Option Installed The following tables describe the panel. Table 2.2.1-4 Lamp List Name Description Status Lights when MP2110A can receive remote commands upon successful start.
- Page 84 Chapter 2 Before Use Table 2.2.1-5 Connector List Connector Name Description Maximum Input Level Trigger Clk In For trigger clock input to 2 Vp-p the sampling oscilloscope. Ch A In* Data input Coaxial connector: ±2 V SMF: 860 to 1650 nm SMF optical connector: +8 dBm peak MMF: 800 to 860 nm...
- Page 85 Part Names CRU Panel Data In Recovered Clock Out Data Out Data Out Data In Optical Status Fail +6.5dBm Peak Max Fail Status Figure 2.2.1-9 CRU Panel Names (MP2110A-055) The following tables describe the panel. Table 2.2.1-6 Lamp List Name Description Status Lights when MP2110A can receive remote commands upon...
-
Page 86: Rear Panel
Chapter 2 Before Use 2.2.2 Rear Panel Serial Number, Option Number Label GPIB Connector Functional Inlet Ground Terminal HDMI USB3.0 Ethernet Mic Input Line Output Figure 2.2.2-1 Rear Panel The following table describes the connectors. Table 2.2.2-1 Connector List Name Description GPIB For connecting to a PC to control MP2110A remotely. -
Page 87: Power Connection
Power Connection 2.3 Power Connection 2.3.1 Power Requirements For normal operation of the MP2110A, use the power voltage range described below. Table 2.3.1-1 Power Requirements Power source Voltage range Frequency 100 Vac system 100 to 120 V 50 to 60 Hz 200 Vac system 200 to 240 V 50 to 60 Hz... -
Page 88: Connecting Power Cord
Chapter 2 Before Use 2.3.2 Connecting Power Cord Insert the power plug into an outlet, and connect the other end to the power inlet on the rear panel. To ensure that the MP2110A is properly grounded, always use the supplied 3-pin power cord. WARNING Always connect the MP2110A to a properly grounded outlet. -
Page 89: Connecting Peripheral Devices
Connecting Peripheral Devices 2.4 Connecting Peripheral Devices USB devices Connect a mouse, keyboard, storage and other USB devices to the USB connectors on the front or rear panel. External Monitor Connect an external monitor to the DP or HDMI connector on the rear-side panel. -
Page 90: Connecting Remote Control Devices
Chapter 2 Before Use 2.5 Connecting Remote Control Devices Refer to 4.3.10, “Remote Control” for details of how to set the remote control interface. Ethernet Connect an Ethernet cable that is CAT 5 cable or newer to the Ethernet connector on the rear panel. GPIB Connect the cable to the rear-panel GPIB connector. - Page 91 Connecting Remote Control Devices Connect cables without forming loops. (a) Daisy Chain (b) Star (c) Loop Figure 2.5-2 GPIB Cable Connection 2 2-17...
-
Page 92: Cautions On Handling Optical Fiber Cables
Chapter 2 Before Use 2.6 Cautions on Handling Optical Fiber Cables Optical fiber cables may degrade in performance or be damaged if handled improperly. Note the following points when handling them. CAUTION Do not pull the cable when removing the connector. - Page 93 Cautions on Handling Optical Fiber Cables CAUTION Do not excessively pull on or twist an optical fiber cable. Also, do not hang anything by using a cable. Doing so may break the optical fiber inside the cable. CAUTION Be careful not to hit the end of an optical connector against anything hard such as the floor or a desk by dropping the optical fiber cable.
-
Page 94: Connecting Coaxial Cable
Chapter 2 Before Use 2.7 Connecting Coaxial Cable Connect the coaxial cable to the MP2110A coaxial connector. Refer to 2.10 “Precautions for Preventing Damage”. 2.7.1 Notes on Coaxial Cable Connection WARNING When signals are input to the MP2110A, avoid excessive voltage beyond the rating. -
Page 95: How To Discharge The Electrostatic Charges Of The Coaxial Cable
Connecting Coaxial Cable 2.7.2 How to Discharge the Electrostatic Charges of the Coaxial Cable There is a risk of damaging MP2110A if the coaxial cable you connect to MP2110A is charged electrostatically. To prevent MP2110A from being damaged by ESD, discharge the electrostatic charges of the coaxial cable by using the ESD Discharger, which is an optional accessary of MP2110A, before cabling the connectors. -
Page 96: Turning Power On/Off
Chapter 2 Before Use 2.8 Turning Power On/Off 2.8.1 Power-on Before turning power on, connect an external monitor, a keyboard and a mouse to MP2110A. Refer to 2.4 “Connecting Peripheral Devices”. Turn on the external monitor. Connect the power cord plug, referring to 2.3 “Power Connection”. The MP2110A enters the standby state and the Standby lights orange. -
Page 97: Power-Off
Turning Power On/Off 2.8.2 Power-off Click System Menu in the application window. Click Exit. Click Yes. Press the Power switch. The Power switch blinks in green. After the power-off process has completed, the power switch lamp goes off, and the Standby lights orange. -
Page 98: Setting Control Panel
Windows settings are changed. Read the general notes in this section carefully when changes to the Windows settings are required. CAUTION Anritsu guarantees the MP2110A to work properly only when the factory settings for Windows have not been changed. -
Page 99: Setting Control Panel
Setting Control Panel 2.9.2 Setting Control Panel The system time, external display settings and Click panel settings are set at the Windows Control Panel. Do not change any settings other than those listed in Table 2.9.2-1. Table 2.9.2-1 Description of Control Panel Icon Description Date and Time... -
Page 100: Setting External Monitor
Chapter 2 Before Use 2.9.3 Setting External Monitor The external monitor resolution is changed using the following methods. MP2110A uses Windows Embedded Standard 7 (WES7) 64 bit version or Windows 10 IoT Enterprise 2019 LTSC (Win10). The setting method differs depending on the operating system. For WES7: Connect the external monitor to the monitor connector on the rear panel of the MP2110A. - Page 101 Setting Control Panel Click OK. The dialog box confirming changes of the desktop appears. Click Keep changes. 10. Click on the task bar. 11. When the external monitor resolution is set to 1280 × 800, click System Menu - Dock/Undock to fix the application window at top left of the screen (refer to 4.3.9 “Dock/Undock”).
- Page 102 Chapter 2 Before Use For Win10: Connect the external monitor to the monitor connector on the rear panel of the MP2110A. Set the MP2110A and monitor power to On. Click System Menu. Click Minimize. Right click on desk top. Click Display Settings. Change the external monitor resolution.
- Page 103 Setting Control Panel The dialog box confirming changes of the desktop appears. Click Keep changes. Click on the task bar. 10. When the external monitor resolution is set to 1280 × 800, click System Menu - Dock/Undock to fix the application window at top left of the screen (refer to 4.3.9 “Dock/Undock”).
-
Page 104: Precautions For Preventing Damage
Chapter 2 Before Use 2.10 Precautions for Preventing Damage CAUTION • Always use the supplied 3-pin power cord to ground both the MP2110A and DUT (included in test circuit). After confirming that both the MP2110A and DUT are grounded, use coaxial cables to connect them. NEVER connect the MP2110A and DUT without grounding, otherwise electrostatic discharge may damage the MP2110A. - Page 105 2.10 Precautions for Preventing Damage CAUTION Do not touch the core conductor of the coaxial cable connected to the input connector or bring it into contact with metal. Doing so may damage the input circuit of the MP2110A. CAUTION Do not touch the core conductor to the metal when connecting the coaxial cable to the connector.
-
Page 106: Precautions On Electrostatic Discharge And Electrical Overstress
Chapter 2 Before Use 2.10.1 Precautions on Electrostatic Discharge and Electrical Overstress CAUTION • When signals are input to the MP2110A, avoid excessive voltage beyond the rating. Otherwise, the circuit may be damaged. • Never feed any current or input signals to the output connector. - Page 107 2.10 Precautions for Preventing Damage CAUTION • Always use 3-pin power cords when connecting external devices, including experimental circuits, to AC outlets. Connect the ground wires of external devices and MP2110A to a common ground. • Turn on the external devices, including experimental circuits, before connecting them to the MP2110A.
- Page 108 Chapter 2 Before Use Follow the procedure below to check for electrical overstress to the MP2110A before connecting DUT (Device Under Test). Checking the ground connection using a tester Connect DUT and the ground terminal of the MP2110A with a ground wire.
- Page 109 2.10 Precautions for Preventing Damage Checking the output waveform with an oscilloscope Connect the DUT and the oscilloscope using a cable with an impedance of 50 Ω. Set the input impedance of the oscilloscope to 50 Ω. Observe the waveform with the oscilloscope, and perform the following operations to check the observed waveform for surge voltage exceeding the rated voltage*.
-
Page 110: Precautions When Using Bias-T
Chapter 2 Before Use 2.10.2 Precautions When Using Bias-T When connecting an external device such as a Bias-T to the output connectors of the MP2110A, if the output signal includes any DC voltage, variations in the output of the DC power supply or load may change the level of the output signal, risking damage to the internal circuits. - Page 111 2.10 Precautions for Preventing Damage Measurement Preparation 2: Set the MP2110A output to OFF. Set the DC power supply output to OFF. Disconnect the MP2110A and all equipment, or change the DUT connections. Since even unforeseen fluctuations in DC voltage and load (open or short circuits at the MP2110A output side and changes caused by using a high-frequency probe, etc.) can damage the DUT and the MP2110A, we recommend connecting a 50 Ω...
-
Page 112: Windows Security Measures
CAUTION If MP2110A is connected to an external network like the Internet, there may be a risk of causing unexpected problems suffering unexpected losses. Anritsu Corporation is not responsible for any losses caused by connecting it to a network. 2-38... -
Page 113: Activating Firewall
2.11 Windows Security Measures 2.11.1 Activating Firewall It is recommended to turn On the Windows firewall on MP2110A. For WES7: Windows firewall On/Off setting (WES7): Click Start → Control Panel from the Windows menu bar hidden in the lower part of the screen. Click System and Security →Windows Firewall to show Windows Firewall window. - Page 114 Chapter 2 Before Use Customize Settings window will be shown where Windows firewall On/Off settings can be changed. Use MP2110A with the following checkboxes Off (unchecked). ● Block all incoming connections, including those in the list of allowed programs ● Notify me when Windows Firewall blocks a new program Figure 2.11.1-2 Customize Settings Window 2-40...
- Page 115 2.11 Windows Security Measures Confirmation and setting of allowed programs through Windows firewall (WES7): Even if Windows firewall is On, in order for this instrument to operate properly, it is necessary to set as allowed programs those that enable external communication from MP2110A. Note: Depending on when MP2110A was released, factory default setting for allowed programs might not be set beforehand.
- Page 116 Chapter 2 Before Use Allowed Programs window will be shown where programs allowed through Windows firewall can be confirmed. Confirm if MX210000A is found and set to On (checked) under Allowed programs and features. When no such information is displayed, it is necessary to add MX210000A.
- Page 117 2.11 Windows Security Measures Procedure to add MX210000A when it is not registered (WES7): Use the mouse to click Allow another program… found in Allowed Programs window. Figure 2.11.1-5 Allowed Programs Window In Add a Program window, select MX210000A, and click Add. Figure 2.11.1-6 Add a Program Window 2-43...
- Page 118 Chapter 2 Before Use MX210000A is added to Allowed programs and features. Confirm if MX210000A is found and set to On (checked). Figure 2.11.1-7 Allowed Programs Window 2-44...
- Page 119 2.11 Windows Security Measures For Win10 Windows firewall On/Off setting (Win10) Click Start ( ) → Windows system → Control Panel from the Windows menu bar hidden in the lower part of the screen. With View by: Category, click System and Security → Windows Defender Firewall to show Windows Defender Firewall window.
- Page 120 Chapter 2 Before Use Confirmation and setting of allowed programs through Windows firewall (Win10) Even if Windows firewall is On, in order for this instrument to operate properly, it is necessary to set as allowed programs those that enable external communication from MP2110A. Click Allow an app or feature through Windows Defender Firewall found in left side of Windows Defender Firewall window.
- Page 121 2.11 Windows Security Measures Procedure to add MX210000A Main Application when it is not registered (Win10) Use the mouse to click Allow another apps… found in Allowed apps window. Figure 2.11.1-12 Allowed apps Window Add an app window is shown. Click Browse…. Figure 2.11.1-13 Add an app Window 2-47...
- Page 122 Chapter 2 Before Use Browse window of Add an app is shown. Select C:\Program Files\Anritsu\MP2100A\MX210000A\MainApp.exe, and click Open. Figure 2.11.1-14 Browse Window of Add an app In Add an app window, select MX210000A Main Application, and click Add. Figure 2.11.1-15 Add an app Window...
- Page 123 2.11 Windows Security Measures MX210000A Main Application is added to Allowed apps and features. Confirm if MX210000A Main Application is found and set to On (checked). Figure 2.11.1-16 Allowed apps Window 2-49...
-
Page 124: Installing Windows Important Update Programs (Windows Update)
Chapter 2 Before Use 2.11.2 Installing Windows Important Update Programs (Windows Update) It is necessary to regularly check for important Windows update programs and keep them up-to-date. However, the performance of MP2110A could decrease while downloading and installing Windows updates. Turn off automatic updates in Windows. Instead, it is recommended to manually check for, download, and install new updates on a periodic basis, avoiding the operating hours of MP2110A. - Page 125 2.11 Windows Security Measures Select Never check for updates (not recommended) in Important updates, then click OK. Figure 2.11.2-2 Change settings Window To check for newly available update programs (manual update), click Check for updates in Windows Update window. Figure 2.11.2-3 Windows Update Window (manual update) When a new update program is found, download and install following the displayed instructions.
- Page 126 Chapter 2 Before Use For Windows 10: Click Start ( )→ Settings ( ) from the Windows menu bar hidden in the lower part of the screen. Click Update and Security to show Windows Update window. To turn off automatic updates, select Windows Update found in left side of Windows Update window, and then click Advanced options.
- Page 127 2.11 Windows Security Measures To check for newly available update programs (manual update), click Check for updates in Windows Update window. Figure 2.11.2-6 Windows Update Window (manual update) When a new update program is found, download and install following the displayed instructions. 2-53...
-
Page 128: Using Antivirus Software
Chapter 2 Before Use 2.11.3 Using Antivirus Software It is recommended to install antivirus software on MP2110A. However, if the antivirus software updates virus definition data automatically or runs full scan in the background, the performance of MP2110A could decrease. Do not allow the software to execute them. Instead, it is recommended to manually run them on a periodic basis, avoiding the operating hours of MP2110A. -
Page 129: Chapter 3 Measurement Examples
Chapter 3 Measurement Examples This chapter explains examples of how to connect the MP2110A and the DUT and their measurement procedures. When changing the optical level input to the DUT such as the receiver sensibility measurement, connect other measurement instruments such as optical attenuator. -
Page 130: Measuring Bit Error Rate
Chapter 3 Measurement Examples 3.1 Measuring Bit Error Rate When the DUT input/output signal is electrical: Figure 3.1-1 Making Connections Using Electrical Signal Connect the DUT input connectors to PPG1 Data Out and Data Out connectors using the coaxial cables. If the DUT has only one input connector, connect it to the Data Out connector of PPG1. - Page 131 Measuring Bit Error Rate In the application window, click PPG/ED Ch1. Set Bit Rate, PPG Amplitude, ED Input Condition and Test Pattern. Refer to Chapter 5, “How to Operate BERT”, for details of the operation method. Click the PPG Data XData button and set the display to ON. Check the following items.
-
Page 132: Measuring Waveform
Chapter 3 Measurement Examples 3.2 Measuring Waveform When measuring the DUT with electrical signal inputs and outputs: Input the output signal of the built-in PPG to the DUT, and then measure the DUT output using the sampling oscilloscope. Figure 3.2-1 When Measuring DUT With Electrical Signal Inputs and Outputs (MP2110A-012, 021) Connect the DUT input connectors to PPG1 Data Out and Data Out using coaxial cables. - Page 133 Measuring Waveform Figure 3.2-2 User Interfaces Used For Operating PPG (Numbers Shown Correspond to Step Numbers.) In the application window, click PPG/ED Ch1. Set Clk Out, Bit Rate, PPG Amplitude and Test Pattern. Refer to Chapter 5, “How to Operate BERT” for details of the operation method.
- Page 134 Chapter 3 Measurement Examples Click Rate and set Tracking. Refer to Chapter 6, “How to Operate Sampling Scope” for details of the operation method. 10. Click Ch A and Ch B. 11. Click the Control Ch button and set the display to All. 12.
- Page 135 Measuring Waveform When the DUT is an optical transceiver: When the MP2110A-022, 023, 025, 026, 030, 032, 033, 035, 036, 039, 040, 042, 043, 045, 046 or 049 is selected, the output waveform of the optical transceiver can be measured using the O/E. Input the output signal of the built-in PPG to the DUT, and then connect the DUT optical output to the SMF or MMF.
- Page 136 Chapter 3 Measurement Examples Figure 3.2-5 User Interfaces Used For Operating PPG (Numbers Shown Correspond to Step Numbers.) In the application window, click PPG/ED Ch1. Set Clk Out, Bit Rate, PPG Amplitude and Test Pattern. Refer to Chapter 5, “How to Operate BERT” for details of the operation method.
- Page 137 Measuring Waveform 10 8 Figure 3.2-6 User Interfaces Used For Operating Scope (Numbers Shown Correspond to Step Numbers.) Click Scope. Refer to Chapter 6, “How to Operate Sampling Scope”, for details of the operation method. Click Time. Click Rate and set Tracking. 10.
-
Page 138: Measuring Multichannel Optical Module Bit Error Rate3-10
Chapter 3 Measurement Examples 3.3 Measuring Multichannel Optical Module Bit Error Rate This section explains the CFP4 module measurement method as an example of multichannel optical module. The CFP4 module contains four pairs of transmitters and receivers. With the MP2110A-014, the CFP4 module bit error rate can be measured for four channels simultaneously. - Page 139 Measuring Multichannel Optical Module Bit Error Rate ������� ������� TX1 to TX4 RX1 to RX4 Data and Data Data and Data Reference Clock Optical Fiber Optical Coupler or Optical Switch Optical Power Programmable Figure 3.3-1 Simultaneously Measuring Bit Error Rate for 4 Channels (MP2110A-014) 3-11...
- Page 140 Chapter 3 Measurement Examples Connect the PPG1-PPG4 Data Out connectors and Input connectors on the CFP4 for transmission using coaxial cables. Connect the PPG1-PPG4 Data Out connectors and Input connectors on the CFP4 for transmission using coaxial cables. To use the optional Reference Clock, connect the Reference Clock connector on the CFP4 for transmission and the Sync Out connector using a coaxial cable.
- Page 141 Measuring Multichannel Optical Module Bit Error Rate Figure 3.3-2 PPG/ED Settings 10. In the application window, click PPG/ED Ch1. 11. Set Bit Rate, PPG Amplitude, ED Input Condition and Test Pattern. Refer to Chapter 5, “How to Operate BERT” for details of the operation method.
- Page 142 Chapter 3 Measurement Examples 15. Change the color of the characters on the button to green by clicking on at All Outputs. Check the following items. The Output lamps 1 to 4 on the BERT panel are lit. (Refer to •...
-
Page 143: Chapter 4 Screen Operation
Chapter 4 Screen Operation This chapter explains the names of screen elements and the operating methods common among the MP2110A. Window Configuration ..........4-2 Data Input Method ............4-5 Setting System Menu ..........4-8 4.3.1 Save ............... 4-9 4.3.2 Open ............. 4-10 4.3.3 Screen Copy .......... -
Page 144: Window Configuration
Chapter 4 Screen Operation 4.1 Window Configuration Figure 4.1-1 shows the names of elements in the application window and their layout. Measurement All Measurements All Channels Status Function Menu Display Area Stop Indicator Output off Date and All Channels System Channel All Channels Time... - Page 145 Window Configuration Table 4.1-1 Application Screen Elements Name Description All BER Results Displays the BER measurement results for multiple channels. All Measurements Starts and stops up to four channels of error rate measurement (MP2110A-011, 012, 014) and up to four channels of waveform data (MP2110A-021 to 049) sampling at the same time.
- Page 146 Chapter 4 Screen Operation The buttons available on the function menu will vary depending on the installed options and software. The following table shows the relation between available buttons and installed options. Table 4.1-2 Buttons Displayed on Function Menu Option Number MP2110A-021, 022, Function Menu 023, 025, 026, 030,...
-
Page 147: Data Input Method
Data Input Method 4.2 Data Input Method The measurement setting item selection, numeric data, and character data are input from the panel displayed on the screen. The displayed panel varies depending on the input data types. Arrow Key Entry Panel Click the numeric data area when entering the numeric data of the bit rate or power voltage. - Page 148 Chapter 4 Screen Operation Numeric value entry panel Click the button for switching the display of the numeric value entry/ arrow key entry panel as shown in Figure 4.2-1, and then the numeric value entry panel as shown in Figure 4.2-2 is displayed. The key type, unit and input range displayed on the panel vary depending on the data.
- Page 149 Data Input Method Software Keyboard When entering character string data such as file name, click Screen Keyboard. In the Keyboard screen (Figure 4.2-3), click keys to enter an alphanumeric string. If you click Shift or Caps once, all keys are locked. To unlock them, click Shift or Caps again.
-
Page 150: Setting System Menu
Chapter 4 Screen Operation 4.3 Setting System Menu The following items can be set and confirmed at the system menu. • Saving measurement conditions and measurement results (Save) • Loading measurement conditions (Open) • Saving window image (Screen Copy) • Initializing device settings (Initialize) •... -
Page 151: Save
In the Keyboard screen, edit the file name. To save to a file, click OK. To cancel saving procedure, click the Close button. Measurement condition files are saved in the following folder: C:\Users\Public\Documents\Anritsu\MX210000A\UserData\Setting Measurement result files are saved in the following folder: C:\Users\Public\Documents\Anritsu\MX210000A\UserData\Result\CSV C:\Users\Public\Documents\Anritsu\MX210000A\UserData\Result\TXT CSV files can be load in spreadsheet software. -
Page 152: Open
Chapter 4 Screen Operation 4.3.2 Open Loading measurement conditions from file Click Open to display the Open panel. Select the target module form the following: PPG/ED Ch 1, PPG/ED Ch 2, PPG/ED Ch 3, PPG/ED Ch 4, Scope, All Setups The displayed module varies with options. -
Page 153: Screen Copy
When clicking Default Name/Root, the folder and file names are set to the default values. The default folder is as follows: C:\Users\Public\Documents\Anritsu\MX210000A\UserData\Screen Copy The default file name is the date and time. For example, the name of the file saved at 12:05:55.523 on 17 January... -
Page 154: Initialize
Chapter 4 Screen Operation 4.3.4 Initialize Initializing measurement conditions Click Initialize, and you are asked if you want to initialize all settings. To initialize the measurement conditions, click OK. To cancel the initialization, click Cancel. 4.3.5 Panel Lock Panel locking Preventing screen operations at other than System Menu is called “panel locking”. -
Page 155: Before Use
Setting System Menu 4.3.7 Before Use Playing back the video of countermeasure against static electricity Click Before Use. Other window is displayed and the video of countermeasure against static electricity is played back in the window. The playback time is about 1 minute 40 seconds. Figure 4.3.7-1 Display Window for Video of Countermeasure Against Static Electricity 4-13... -
Page 156: Minimize
Chapter 4 Screen Operation 4.3.8 Minimize Minimizing the screen display Click Minimize to display the desk top. MX210000A is displayed on the task bar. To display the screen, click MX210000A on the task bar. 4.3.9 Dock/Undock Changing the window display method Click Dock/Undock. -
Page 157: Remote Control
Setting System Menu 4.3.10 Remote Control Clicking Remote Control displays the following dialog box. Figure 4.3.10-1 Remote Control Dialog Box To set GPIB Click the GPIB Address text box. A dialog box for inputting the address is displayed. Enter the GPIB address in the range of 0 to 30. To complete the setting, click OK. - Page 158 Chapter 4 Screen Operation Click Change Network Connections to change the IP address, subnet mask, and gateway address of the MP2110A. The Windows Network Connections window is displayed. Right-click the Local Area Connection (Left) or Local Area Connection (Right) icon, and click Properties. Click Internet Protocol Version 4 (TCP/IPv4), and click Properties.
-
Page 159: System Information
Setting System Menu 4.3.11 System Information Displaying the system information Click System Information. The System Information dialog box appears. Software Version Figure 4.3.11-1 System Information Dialog Box Click Save To Clipboard to copy the system information to the Windows clipboard. Click Save To File to open the Save dialog box. -
Page 160: Exit
Click Exit. You will see the dialog box asking if you want to terminate the application. To terminate the application, click Yes. To cancel the application termination, click No. To restart the application: • Double-click the MX210000A icon. • On the Start menu, point to All Programs, Anritsu, and then click MX210000A. 4-18... -
Page 161: Multi-Channel Signal Output
Multi-channel Signal Output 4.4 Multi-channel Signal Output The MP2110A can set PPG channels 1 to 4 to On/Off at the same time. To output signal from PPG: Click on at All Outputs shown in Figure 4.4-1. The letters of on turn green and then the Output status indicator turns green. -
Page 162: Simultaneous Measurement Start And Stop At Multi-Channels
Chapter 4 Screen Operation 4.5 Simultaneous Measurement Start and Stop at Multi-channels The MP2110A can measure error rates for up to four channels and sample waveform data for up to four channels simultaneously. To start simultaneous measurement, click the key shown in Figure 4.5-1. -
Page 163: Linking Measurement Settings For Multiple Channels
Linking Measurement Settings for Multiple Channels 4.6 Linking Measurement Settings for Multiple Channels With the MP2110A-014, Ch Tracking is displayed in the application screen. To apply the PPG and ED settings for Ch1 to other channels, click on. In this state, altering settings for Ch1 also alters the settings for other channels. -
Page 164: Displaying Ber Measurement Results For Multiple Channels
Chapter 4 Screen Operation 4.7 Displaying BER Measurement Results for Multiple Channels With the MP2110A-014, All BER Results is displayed in the application screen. To view BER measurement results for all channels, click Open. Figure 4.7-1 All BER Results Figure 4.7-2 All BER Results Display Table 4.7-1 All BER Measurements Buttons Name Description... -
Page 165: Displaying Date/Time And Status
Displaying Date/Time and Status 4.8 Displaying Date/Time and Status To display date and time Date and time are displayed on the upper right side of the screen. Date and time can be changed in the Windows Control Panel. To display status The following three kinds of indicators indicate the status. - Page 166 Chapter 4 Screen Operation 4-24.
-
Page 167: Chapter 5 How To Operate Bert
Chapter 5 How to Operate BERT This chapter explains the BERT module setting items and how to measure the bit error. Procedure for Generating Pulse Signal ......5-2 PPG/ED Panel .............. 5-3 5.2.1 Setting Reference Clock ........5-7 5.2.2 Setting Bit Rate ..........5-8 5.2.3 Setting Patterns .......... -
Page 168: Procedure For Generating Pulse Signal
Chapter 5 How to Operate BERT 5.1 Procedure for Generating Pulse Signal The basic procedure is as shown in the following figure. Starting Set the pattern. Select a reference clock. Set positive logic or negative logic. Is the external clock used? Input the clock to Ext Is the synchronous Clk In connector. -
Page 169: Ppg/Ed Panel
PPG/ED Panel 5.2 PPG/ED Panel Clicking PPG/ED Ch1 of the function key displays the following panel. The elements that are set as common in the channels other than Ch 1 are displayed by the light blue characters. Figure 5.2-1 PPG/ED Settings Panel Figure 5.2-2 shows the bit rate display when setting Ext Clk In at Reference CLK. - Page 170 Chapter 5 How to Operate BERT When Setup/Result is clicked, the panel display is changed to the panel shown in Figure 5.2-3. And when Setup/Result is clicked again, the panel display is changed to the panel shown in Figure 5.2-1. Figure 5.2-3 PPG/ED Results Panel (In case of MP2110A-014)
- Page 171 PPG/ED Panel The following table describes the panel. Table 5.2-1 Setting Items of PPG/ED Item Description Setup/Result Switches the PPG/ED panel display. PPG Data/XData Sets the PPG data signal output On/Off. XData means on the front panel. Data The right side of the button is lit in green while the data is outputting to the connector.
- Page 172 Chapter 5 How to Operate BERT Table 5.2-1 Setting Items of PPG/ED (Cont’d) Item Description Test Pattern* Selects the test pattern by clicking the button. The polarity of test pattern can be changed by clicking POS or NEG. The polarity when the test pattern is “1” is shown below: POS: The voltage of Data connector is higher than the voltage of connector.
-
Page 173: Setting Reference Clock
PPG/ED Panel 5.2.1 Setting Reference Clock BERT uses the reference clock to generate the data and detect an error. The reference clock can be selected from the following supply sources: Internal clock generated inside the MP2110A External clock input from the Ext Clk In connector The internal clock accuracy is ±10 ppm after power is applied for 1 hour. -
Page 174: Setting Bit Rate
Chapter 5 How to Operate BERT 5.2.2 Setting Bit Rate Set the bit rate when Reference CLK has been set to Internal. The bit rate is set as common in PPG/ED Ch 1 to Ch 4. For example, when the bit rate is changed in the PPG/ED Ch1 panel, the bit rates of PPG/ED Ch2 to PPG/ED Ch4 are also changed. - Page 175 PPG/ED Panel Setting Amplitude Click the PPG Amplitude text box and set the amplitude voltage. When the attenuators are inserted between the Data Out connector and Data Out connector of MP2110A and the DUTs, click the Ext ATT text box and input the attenuation. The amplitude voltage after passing through the attenuator is displayed.
-
Page 176: Setting Patterns
Chapter 5 How to Operate BERT 5.2.3 Setting Patterns The following three test patterns can be selected. PRBS 1/2 Clock Pattern 1/16 Clock Pattern PRBS PRBS is the pattern generated at the hardware. The generated pattern length, maximum length of contiguous 1s, and maximum length of contiguous 0s differ depending on the hardware configuration. - Page 177 PPG/ED Panel Pattern Maximum Maximum Pattern PRBS Generation number of number of Length Polynomial contiguous 1s contiguous 0 2^7–1 2^9–1 2^15–1 32767 2^23–1 8388607 2^31–1 214748647 The ratio of 1s to the PRBS pattern length is 50%. 1/2 Clock Pattern “1/2 Clock Pattern”...
- Page 178 Chapter 5 How to Operate BERT Pattern Logic There are two types of logic; Positive Logic (POS) and Negative Logic (NEG). With positive logic, the voltage at the Data connector goes High when the data is “1”. With negative logic, the voltage at the Data connector goes Low when the data is “1”.
-
Page 179: Setting Output Waveform
PPG/ED Panel 5.2.4 Setting Output Waveform The PPG Data connector and Data connector are AC coupling. When it is necessary to impose DC voltage on an output waveform, connect a bias-T. CAUTION The impedance of the Data Out and Data Out connectors is 50 Ω. -
Page 180: Setting Sync Out
Chapter 5 How to Operate BERT 5.2.5 Setting Sync Out Set the signal type output from the front-panel Sync Out connector. Sync Out connector outputs a clock synchronized to the data generated by the PPG. The Sync Out Connector is a DC coupling. To monitor the waveform pattern of the pulse pattern generator, set Pattern Sync at Sync Out and connect the Sync Out connector and the Trigger Clk In connector of the sampling oscilloscope using a coaxial cable. - Page 181 PPG/ED Panel The Sync Output amplitude cannot be set. The time interval outputting the pulse varies depending on the pattern length and bit rate when Sync Output is Pattern Sync . Select the pattern for the measurement referring to Table 5.2.5-1. Table 5.2.5-1 Cycle of Sync Output (Pattern Sync) Bit Rate (kbit/s) Pattern Name...
-
Page 182: Setting Clk Out
Chapter 5 How to Operate BERT 5.2.6 Setting Clk Out Set a signal output from the Clk Out connector on the front panel. Clk Out is a function to output the clock synchronized to the data generated from the pulse pattern generator to the Clk Out connector on the front panel. -
Page 183: Inserting Bit Error
PPG/ED Panel Figure 5.2.6-2 Connection Example When Setting Ch3/4 at Clk Out 5.2.7 Inserting Bit Error Insert a bit error when confirming whether to detect the bit error at the ED. The number of bit errors to be inserted at one time is determined according to the bit rate. -
Page 184: Setting Error Detection Method
Chapter 5 How to Operate BERT 5.2.8 Setting Error Detection Method Set the conditions for detecting a bit error. Signal input connectors The block diagram for Data In and Data In connectors on BERT panel is as shown below. Data In –... - Page 185 PPG/ED Panel Make a signal input connector selection, depending on the settings for ED Input Condition. Differential 50 Ohm: Signal input connector for both Data In and Data In connectors. The differential voltage of each signal input to two connectors is the input voltage. Electrical Single-Ended Data: Signal input connector for Data In connector Electrical Single-Ended XData:...
- Page 186 Chapter 5 How to Operate BERT Threshold Level Voltage level for evaluating “1” and “0”. The input connectors are AC coupled, so set a voltage corresponding to the signal waveform excluding the DC components. The waveform excepting the waveform input to the connector and the DC component when inputting the 1.2V LVCMOS signal to the Data In connector and Data In connector is shown below.
- Page 187 PPG/ED Panel Voltage (V) Input waveform to the Data In Time connector Voltage (V) Input waveform to the Time connector POS 0 NEG 1 Figure 5.2.8-3 Values Defined as Input Waveform Pattern The ED compares the received bit string and the internally generated bit stream bit-by-bit and evaluates it differences as it errors.
-
Page 188: Setting Ed Measurement Condition
Chapter 5 How to Operate BERT 5.2.9 Setting ED Measurement Condition To set how to measure bit error: Set Gating Cycle at Gating. Single: Performs measurement until the time set at the measurement period is exceeded. Repeat: Performs measurement until ER Result button display becomes Stop. - Page 189 PPG/ED Panel Measurement method The ED Result display can be refreshed either in real time (approx. 0.1 s intervals) or when the progress bar reaches 100%. The display method is set at Current of Gating. On: Updates measurement results in real time. Off: Updates measurement results when progress reaches 100% for either Single or Repeat Gating Cycle.
- Page 190 Chapter 5 How to Operate BERT When SYNC Loss is displayed in red Pattern synchronization has not been obtained; check the following: The Test Pattern generated by the DUT matches the Test Pattern for the error detector. The Logic POS and NEG settings are correct. ...
-
Page 191: Measurement Result
PPG/ED Panel 5.2.10 Measurement Result The following measurement result is displayed in the ED Result. Start Time: Time when bit error measurement started Elapsed Time: Time elapsed from start of bit error rate measurement When Gating Cycle is Single or Repeat, when time exceeds the Time setting at Gating, the time is reset back to 0. -
Page 192: Saving Measurement Results
The measurement result of the saved bit error is as follows: Bit Error Measurement Result CC (Clock Count) EC (Error Count) ER (Error Rate) Frequency Start Time Stop Time Test Pattern Anritsu;MP2110A ;01.00;TXT---------------------------------- Pattern PRBS2^9–1 Option 12,21,24,93 Start 2017/03/27 15:46:16 2017/03/27 15:46:26 | Total --------+----------------------------------------------------------------------- | 0.0000E-11... - Page 193 Input the file name. When changing the file name, click OK, and when canceling the procedure, click Cancel and go back to the step 4. The measurement result file is saved in the following folder. C:\Users\Public\Documents\Anritsu\MX210000A\UserData\Result\CSV C:\Users\Public\Documents\Anritsu\MX210000A\UserData\Result\TXT 5-27...
-
Page 194: Setting Restrictions
Chapter 5 How to Operate BERT 5.3 Setting Restrictions The setting items of the PPG have the following restrictions. When Test Pattern is not PRBS (Test Pattern is 1/2 Clock or 1/16 Clock) in MP2110A, the Pattern Sync is disabled due to the hardware restrictions. The setting item can be selected, but “PPG 1/8 Clock”... -
Page 195: Chapter 6 How To Operate Sampling Scope
Chapter 6 How to Operate Sampling Scope This chapter explains the Sampling Scope setting items and how to measure the waveform. Note: This chapter explains how to operate MP2110A with the software version 7.01.00 or later. Measurement Procedure ..........6-2 Explanation of Windows .......... -
Page 196: Measurement Procedure
Chapter 6 How to Operate Sampling Scope Measurement Procedure The following figure shows the basic measurement procedure. Start Calibration required? Eye mode? Perform calibration. Set pattern length. Input the signal to be Track the clock measured to the connector rate to BERT? (Ch A, Ch B, A, B, C or D) of the Scope panel. -
Page 197: Explanation Of Windows
Explanation of Windows Explanation of Windows 6.2.1 Result Window In the function menu, click Scope, and then the Scope result window is displayed. Opens the Setup Dialog Box. Opens the Measure Dialog Box. Opens the Amplitude, O/E Dialog Box. Opens the Time, CRU Dialog Box. Trace switch buttons Control Ch Sampling start/stop... - Page 198 Chapter 6 How to Operate Sampling Scope MP2110A-021 Dual Electrical Scope does not display Amplitude O/E but Amplitude. When MP2110A-054 Clock Recovery (Electrical/Optical) and MP2110A-055 26G/53Gbaud Clock Recovery (SM Optical) are not installed, not Time/CRU but Time is displayed. When Channel Math in Amplitude O/E dialog box is On, Scale/Offset cannot be operated.
- Page 199 Explanation of Windows Control Ch Toggles the channel(s) to be controlled by Sampling, Auto Scale and Clear Display. All channels Single Active channel only When Control Ch is set to Single, the buttons effective only for the active channel are indicated by the same color as the active channel. Color of the active channel is displayed.
- Page 200 Chapter 6 How to Operate Sampling Scope When Control Ch is set to Single, the buttons in the following dialog boxes and effective only for the active channel are also indicated by the same color as the active channel. Setup Dialog Box ...
- Page 201 Explanation of Windows Channel A Top level On-screen warning Channel B Top level Channel A Channel B Level scale Level scale Channel B Channel A Optical Optical connector type connector type Channel A Channel B Level offset Level offset Channel B Channel A GND level GND level...
- Page 202 Chapter 6 How to Operate Sampling Scope Note: The arrows that indicate the GND levels appear differently according to the options installed. ■ With MP2110A-021, 022, 023, 025, 026, 040, 042, 043, 045, 046 or 049, the GND levels are indicated by thick lines. Ch A: Ch B: Ch C:...
- Page 203 Explanation of Windows Figure 6.2.1-7 Quick Menu Graph display mode setting There are three graph display modes. Overlap: Overlaps traces of multiple channels. Single: Displays only the trace of the active channel. Tile: Displays four trace graphs in tile view. Single Overlap Tile...
- Page 204 Chapter 6 How to Operate Sampling Scope The graph size changes depending on the number of measurement results displayed on Result Window. Waveform display area Measurement result display area Figure 6.2.1-9 Result Window (Number of measurement items is from five to eight) Waveform display area...
- Page 205 Explanation of Windows When the number of measurement items is nine or more, Zoom display icon ( ) is shown. Clicking this icon displays Scope Result dialog box and the waveform is displayed larger. Figure 6.2.1-11 Enlarging Display of Result Window (Number of measurement items is nine or more) Click Screen Copy in the Scope Result dialog box to save the images of the Result window and Scope Result dialog box to a file.
- Page 206 Chapter 6 How to Operate Sampling Scope When clicking a measurement item, the letter turns blue, and the measurement area is displayed with a yellow dotted line in the window. When clicking the measurement item again, the display of the measurement area disappears.
- Page 207 Explanation of Windows Status Display The following statuses of the sampling scope are displayed. Table 6.2.1-1 Status Display Items Item Color Description Orange The correction value of O/E is not appropriate. Calibrate the O/E module according to 6.3.2, “Adjusting Dark Current”. Yellow There is a difference of ±...
-
Page 208: Displaying Measured Jitter
Chapter 6 How to Operate Sampling Scope 6.2.2 Displaying Measured Jitter When MP2110A-096 is installed, Graph is displayed in the Result window. Click Graph to display the Graph selection buttons. Note: Graph cannot be operated when Sampling Mode is set to Pulse or Coherent Eye. - Page 209 Explanation of Windows Figure 6.2.2-2 Example of How Corrected Measurement Results are Displayed Displaying Graphs When Graph in the Result window is clicked, Graph selection buttons appear and the graph to display can be selected. When Sampling Mode is Eye, the active channel is displayed on the button.
- Page 210 Chapter 6 How to Operate Sampling Scope Figure 6.2.2-4 Switching Graph Display 6-16...
- Page 211 Explanation of Windows 6.2.2.1 Display of Eye Measurement TJ Histogram When clicking TJ Histogram, a graph selection button, the histogram of the active channel is displayed. Figure 6.2.2.1-1 TJ Histogram Table 6.2.2.1-1 TJ Histogram Item Name Description Estimate RJ/DJ Appears when Sampling Mode is set to Histogram Eye.
- Page 212 Chapter 6 How to Operate Sampling Scope Bathtub When clicking Bathtub on the Graph selection buttons, a bathtub curve for the active channel is displayed. Figure 6.2.2.1-2 Bathtub Table 6.2.2.1-2 Bathtub Item Name Description TJ Measurement Sets the BER to measure the TJ and eye opening.
- Page 213 Explanation of Windows 6.2.2.2 Graphs of Jitter Analysis (Advanced Jitter) For jitter analysis (Advanced Jitter), except for the DDJ Histogram graph, the type of measurement edge (All, Fall or Rise) is displayed in the graph name. The measurement edge type is set on the Algorithm tab of the Jitter Measure dialog box.
- Page 214 Chapter 6 How to Operate Sampling Scope Bathtub When clicking Bathtub on the Graph selection buttons, the following graph is displayed. Figure 6.2.2.2-2 Bathtub Table 6.2.2.2-2 Bathtub Item Name Description TJ Measurement Sets the BER to measure the TJ and eye opening.
- Page 215 Explanation of Windows RJ/PJ Histogram Clicking RJ/PJ Histogram on the Graph selection buttons, a histogram that is the sum of RJ and PJ is displayed. When Estimate RJ / PJ Histogram is set to ON, histogram of RJ approximated by dual Dirac function is displayed in yellow and amplitude of PJ is displayed in red line.
- Page 216 Chapter 6 How to Operate Sampling Scope Composite Histogram Click Composite Histogram on the Graph selection buttons, TJ, RJ/PJ, and DDJ histograms are displayed. Figure 6.2.2.2-4 Composite Histogram Table 6.2.2.2-4 Composite Histogram Item Name Description TJ Samples The number of samples for the histogram RJ/PJ Samples DDJ Samples 6-22...
- Page 217 Explanation of Windows DDJ Histogram Click DDJ Histogram on the Graph selection buttons, the histogram of DDJ is displayed by edge. Figure 6.2.2.2-5 DDJ Histogram Table 6.2.2.2-5 DDJ Histogram Item Name Description All Edges When the button display is ON, the histogram is displayed.
- Page 218 Chapter 6 How to Operate Sampling Scope PJ vs Frequency When clicking PJ vs Frequency on the Graph selection buttons, spectrum of jitter is displayed. PJ Frequency Figure 6.2.2.2-6 PJ vs Frequency Table 6.2.2.2-6 PJ vs Frequency Item Name Description PJ Calculate Calculates the jitter peak spectrum frequency.
- Page 219 Explanation of Windows DDJ vs Bit When clicking DDJ vs Bit on the Graph selection buttons, Pattern, and DDJ graph are displayed. Notes: If PDJ measurement is ON, DDJ vs Bit changes to PDJ vs Bit. When the display range on the horizontal axis is 193 bits or more, the pattern graph (white line) is not displayed.
-
Page 220: Setup Dialog Box
Chapter 6 How to Operate Sampling Scope 6.2.3 Setup Dialog Box Click Setup shown in Figure 6.2.1-1, to display the Setup dialog box shown in Figure 6.2.3-1. Active channel switch Figure 6.2.3-1 Setup Dialog Box (General, Utilities tab) 6-26... - Page 221 Explanation of Windows Table 6.2.3-1 Items of Setup Dialog Box (General tab) Item Description Signal Type When MP2110A-095 is installed, select the type of signal (NRZ or PAM4). To measure jitter, select NRZ. Sampling Mode* Select sampling mode from Eye, Pulse, Coherent Eye, Advanced Jitter.
- Page 222 Chapter 6 How to Operate Sampling Scope Table 6.2.3-2 Items of Setup Dialog Box (Utilities tab) Item Description Waveform Selects the color of waveform from Color Grade or Gray Scale. It does not apply to jitter graphs. When Gray Scale is selected, click Color Select, and you can set the waveform color.
- Page 223 Explanation of Windows Active channel switch Figure 6.2.3-2 Setup Dialog Box (Save tab) 6-29...
- Page 224 This function is available when Sampling Mode is Coherent Eye and Test Pattern is other than Variable. The text file is saved to the following folder. C:\Users\Public\Documents\Anritsu\MX210000A \UserData\Result\TXT Samples / UI Sets the number of times that the amplitude is measured per UI by Pattern Capture (number of samples).
- Page 225 Explanation of Windows Table 6.2.3-4 Sampling Mode Setting and Graph Sampling Mode Advanced Jitter Graph to Bathtub (CHA) Bathtub display TJ Histogram (CHA) DDJ Histogram Bathtub (CHB) Composite Histogram TJ Histogram (CHB) DDJ vs Bit Bathtub (CHC) PJ vs Frequency TJ Histogram (CHC) RJ/PJ Histogram Bathtub (CHD)
-
Page 226: Measure Dialog Box
Chapter 6 How to Operate Sampling Scope 6.2.4 Measure Dialog Box When clicking Measure in the Figure 6.2.1-1 “Result Window”, the Measure dialog box shown in Figure 6.2.4-1 is displayed. If both Signal Type of Ch A and Ch B are set to PAM4 in the Setup dialog box, Mask Test tab cannot be operated. - Page 227 Explanation of Windows Advanced Jitter Figure 6.2.4-2 Measure Dialog Box - Amplitude/Time Tab (Jitter) 6-33...
- Page 228 Chapter 6 How to Operate Sampling Scope Table 6.2.4-1 Items of Amplitude/Time Tab Item Description Display On: Displays the Amplitude/Time measurement results in the Result window. Off: Does not display the Amplitude/Time measurement results in the Result window. Item Selection Select measurement items.
- Page 229 Explanation of Windows Clicking NRZ at Measure Setup displays the Setup (NRZ Amplitude/Time) dialog box. Figure 6.2.4-3 Setup (NRZ Amplitude/Time) Dialog Box Table 6.2.4-2 Items of Setup (NRZ Amplitude/Time) Dialog Box Item Description Rise/Fall Time Sets the position to measure Rise Time and Fall Time. Rise/Fall Time When setting to On, the Rise Time and Fall Time are corrected.
- Page 230 Chapter 6 How to Operate Sampling Scope Clicking PAM4 at Measure Setup displays the Setup (PAM4 Amplitude/Time) dialog box. Figure 6.2.4-4 Setup (PAM4 Amplitude/Time) Dialog Box The TDECQ equalizer is set on the Measure Dialog Box – Equalizer Tab shown in Figure 6.2.4-9. When you see the following message, check the settings on the General tab of the Setup dialog box.
- Page 231 Explanation of Windows Table 6.2.4-3 Items of Setup (PAM4 Amplitude/Time) Dialog Box Item Description Configuration Sampling Timing Set the reference position of the upper eye and the lower eye. Track to Middle Eye Timing: Adjust to the center eye position. Refer to Figure 1.5-11. Independent Timing: The reference positions of the three eyes can be set separately.
- Page 232 Chapter 6 How to Operate Sampling Scope *1: This is displayed when the installed scope is other than MP2110A-021. *2: The settings are valid when all of the following conditions are met: Item Selection is Item Type: PAM4. Sampling Mode is Coherent Eye Test Patterns other than Variable The following figure shows the positions of Pmax and Pmin when Peak Power Hit Ratio is set to 1%.
- Page 233 Explanation of Windows Jitter Measure Dialog Box Clicking Jitter at Measure Setup displays the Jitter Measure dialog box. If Sampling in the Setup dialog box is Advanced Jitter, the Algorithm tab and Advanced tab are displayed in the Jitter Measure dialog box. Figure 6.2.4-7 Jitter Measure Dialog Box - Algorithm Tab Table 6.2.4-4 Items of Jitter Measure Dialog Box - Algorithm Tab Item...
- Page 234 Chapter 6 How to Operate Sampling Scope Table 6.2.4-5 Settable Standards for PDJ measurement and Filter Sets (Unit Hz) PDJ Filter Standard HP1' STM-0 – 20 k – 12 k 400 k – STM-1 – 65 k – 12 k 1.3 M STM-4 –...
- Page 235 Explanation of Windows When Sampling Mode of the Setup dialog box is Advanced Jitter, the Advanced tab is displayed in the Jitter Measure dialog box. When Sampling Mode of the Setup dialog box is Eye, the settings on the Advanced tab can be configured for each channel. Advanced Jitter Figure 6.2.4-8 Jitter Measure Dialog Box - Advanced Tab 6-41...
- Page 236 Chapter 6 How to Operate Sampling Scope Table 6.2.4-7 Items of Jitter Measure Dialog Box - Advanced Tab Item Description TJ Measurement Sets the bit error rate to measure the eye opening in the Bathtub graph. Fixed RJ Set Off to display the graph using RJ calculated from the measured waveform.
- Page 237 Explanation of Windows Figure 6.2.4-9 Measure Dialog Box – Equalizer Tab 6-43...
- Page 238 Chapter 6 How to Operate Sampling Scope Table 6.2.4-8 Items of Equalizer Tab* Item Description Display Equalizer Off: Displays waveforms not applying Reference Equalizer. Waveform On: Displays waveforms applying Reference Equalizer. Equalizer Type Sets the equalizer type to automatically calculate the Tap for Reference Equalizer.
- Page 239 Explanation of Windows Figure 6.2.4-10 Measure Dialog Box - Mask Test Tab 6-45...
- Page 240 Chapter 6 How to Operate Sampling Scope Table 6.2.4-9 Items of Mask Test Tab Item Description Mask Test Turns on and off the mask test on the specified channel. Eye Mask Select Select the Mask type. Refer to “Table 6.9.2-1 Mask List”. Mask Margin Test Click Run to measure Mask Margin and then stop sampling.
-
Page 241: Amplitude, O/E Dialog Box
Explanation of Windows 6.2.5 Amplitude, O/E Dialog Box When you click Amplitude O/E in the Result Window shown in Figure 6.2.1-1, you will see the Amplitude dialog box (one of Figure 6.2.5-1 to Figure 6.2.5-3) that corresponds with your system configuration. The O/E tab is displayed if the MP2110A is provided with optical input connector(s). - Page 242 Chapter 6 How to Operate Sampling Scope Figure 6.2.5-2 Amplitude Dialog Box (When MP2110A-022, 030, 032, 039, 040, 042, and 049) 6-48...
- Page 243 Explanation of Windows Figure 6.2.5-3 Amplitude Dialog Box (When MP2110A-023, 033, and 043) 6-49...
- Page 244 Chapter 6 How to Operate Sampling Scope Table 6.2.5-1 Items of Amplitude Dialog Box Item Description Scale Offset Sets the level scale. Scale Sets vertical scale. Offset Sets vertical offset. Attenuation Sets attenuation amount for external attenuation. Tracking Off: Sets the scale for the active channel. Sets the scale for all channels to the same value.
-
Page 245: Time, Cru Dialog Box
Explanation of Windows To measure an optical signal at the other wavelength than 850 nm, 1310 nm, or 1550 nm by selecting User at Wavelength, change the setting values of Conversion Gain and Responsivity according to the changed wavelength. For the way to change the setting values, refer to 6.3.3, “Adjusting values for changing the wavelength bands”. - Page 246 Chapter 6 How to Operate Sampling Scope Figure 6.2.6-2 Time Dialog Box (CRU Tab) (When MP2110A-054 is installed) 6-52...
- Page 247 Explanation of Windows Figure 6.2.6-3 Time Dialog Box (CRU Tab) (When MP2110A-055 is installed) Figure 6.2.6-4 Time Dialog Box (CRU Tab) (When MP2110A-054 and MP2110A-055 are installed) 6-53...
- Page 248 Chapter 6 How to Operate Sampling Scope Table 6.2.6-1 Items of Time Dialog Box Item Description Data Clock Rate Sets input data speed, clock frequency, and frequency dividing rate. Tracking* Specifies Symbol Rate whether to follow the Bit Rate of PPG/ED Ch1.
- Page 249 Explanation of Windows ● When Reference Clock of PPG is set to External, Tracking is set to other than Off. ● When Clock Out of PPG is set to Off, Tracking is set to Clock Out. *2: When MP2110A-054 or MP2110A-055 is installed *3: When MP2110A-054 and MP2110A-055 are installed *4: When MP2110A-024 is installed Table 6.2.6-1 Items of Time Dialog Box (Cont’d)
- Page 250 Chapter 6 How to Operate Sampling Scope Table 6.2.6-1 Items of Time Dialog Box (Cont’d) Item Description Clock Recovery Sets the clock recovery unit when Operation Mode is Recovery. Displayed only when Operation Mode is Recovery. Lock Status Whether or not the clock recovery unit is locked on the input signal is indicated.
- Page 251 Explanation of Windows Depending on options, the settings are restricted as follows: Scope Option There are the following restrictions when MP2110A-011, 012, or 014 is not installed. ● Tracking cannot be set to Symbol Rate: PPG at Data Clock Rate in the Time dialog box.
-
Page 252: Calibration And Adjustment
Chapter 6 How to Operate Sampling Scope Calibration and Adjustment 6.3.1 Calibrating Level The amplitude accuracy of the sampling oscilloscope is guaranteed after performing calibration. When the calibration is required, the error message “Calibration is required” is displayed in the Setup dialog box in red. Perform the calibration, when using the MP2110A for the first time or the message is displayed. - Page 253 Calibration and Adjustment Upon completion of the calibration, a dialog box appears and gives you the calibration result. Figure 6.3.1-1 Calibration Result Display (When Calibration Is Successful) Figure 6.3.1-2 Calibration Result Display (When Calibration Fails) If the calibration fails, follow the instruction that applies to your situation, and then retry from step 2.
-
Page 254: Adjusting Dark Current
Chapter 6 How to Operate Sampling Scope 6.3.2 Adjusting Dark Current When light is not input to the Optical connector, the O/E module output voltage is adjusted. The output voltage of the O/E module used changes depending on the ambient temperature. Calibrate the MP2110A before using the optical connector. - Page 255 Calibration and Adjustment The System Conversion Gain value is automatically set by setting the Conversion Gain value. Adjustment method of Responsivity Adjust the wavelength of the optical power meter to the optical signal. Measure unmodulated optical signal power with the optical power meter.
-
Page 256: Performing Self Test
After the self test is completed, the result is displayed. When the power supply test result is failed: When the power voltage is displayed, record the value. If the power supply test result shows “failed”, contact an Anritsu Service and Sales office. 6-62... -
Page 257: Setting Cru
Setting CRU Setting CRU The clock recovery unit (CRU) generates a clock signal from the signal input to CRU In connector. The waveform can be observed by using the generated clock signal. The clock recovery unit sets the following. Operation Rate ... - Page 258 Chapter 6 How to Operate Sampling Scope Procedure For MP2110A-054 Connect the CRU Out and Trigger Clk In connectors with a supplied U-link coaxial cable (SMA). Trigger Clk In CRU Out CRU In Ch B In Scope 2Vp-p Max 1Vp-p Max ±2V Max Status Fail U Link Coaxial Cable (SMA)
- Page 259 Setting CRU For MP2110A-054 Input the signal to the CRU In connector. For MP2110A-055 Input the signal to the Data In connector. Click Time CRU. Click the CRU tab. When both MP2110A-054 and MP2110A-055 are installed, click the CRU(26G) or CRU(53G) tab. Click the Operation Mode button and set the display to Recovery.
-
Page 260: Setting Rate
Chapter 6 How to Operate Sampling Scope Setting Rate To collect data, the trigger clock synchronized with the input signal is required. When BERT is installed in MP2110A, the synchronizing clock (Sync Out) can be used as the trigger clock. When MP2110A-054 Clock Recovery or MP2110A-055 26G/53Gbaud Clock Recovery (SM Optical) is installed, the clock recovery unit can be set. -
Page 261: Setting Symbol Rate
Setting Rate 6.5.1 Setting Symbol Rate This section explains how to set the symbol rate of the signal to measure with Scope. Click Time. Click Rate tab. Click the Tracking button of the Data Clock Rate to set to Off. Click the Recalculate Option button to select Clock Rate. -
Page 262: Setting Clock Rate And Divide Ratio
Chapter 6 How to Operate Sampling Scope 6.5.2 Setting Clock Rate and Divide Ratio The symbol rate can be set by measuring the clock rate from the signal input to the Trigger Clk In connector of the front panel. Click Time. Click the Rate tab. -
Page 263: Setting Pattern Length
Setting Pattern Length Setting Pattern Length When the Pulse mode is set as described in Section 6.7 “Collecting Data”, the pattern length can be set. In the Pulse mode, the pattern is synchronized by collecting data at the pattern length time cycle. 6.6.1 Click Time. -
Page 264: Pam4
Chapter 6 How to Operate Sampling Scope Enter the pattern length. PPG/ED’s test patterns and their length are shown in the table below. Table 6.6.1-1 Setting Length Pattern Length Test Pattern (symbols) PRBS 2^7–1 PRBS 2^9–1 PRBS 2^13–1 8191 PRBS 2^15–1 32767 1/2 Clock Pattern 1/16 Clock Pattern... -
Page 265: Collecting Data
Collecting Data Collecting Data The data collection method is composed of the following types. Data synchronization method: Eye mode, Pulse mode, Coherent eye mode Cumulative display for waveform: None, Infinite, Limited, Persistency, Average Note: In this document, measurement of one data item on the screen is described as “data capture”... - Page 266 Chapter 6 How to Operate Sampling Scope Figure 6.7-2 Pulse Mode Display Example Setting overwritten waveform display When setting the display method to Infinite, Limited or Persistency, the acquired data is overwritten on the screen. Click Setup to open the Setup dialog box. Select the single waveform data collection count from the following Number of Samples.
- Page 267 Collecting Data When selecting Limited at step 3, set the at-end condition. ● To end overwriting waveform when the set time is passed, set Limit Type to Time. Click the Time text box to input the time. ● To end overwriting waveform when the data count set at the screen is reached, set Limit Type to Sample.
- Page 268 Chapter 6 How to Operate Sampling Scope Figure 6.7-4 Accumulation Type Settings (Infinite) Displaying averaging waveform When setting the display method to Averaging at the pulse mode, the averaging process is performed. Averaging process is used to suppress waveform noise. Note: When Averaging is set, the precision trigger is disabled even when Precision Trigger is set to On.
- Page 269 Collecting Data In averaging, the mean value of the data count input at Averaging is calculated and the results are displayed on the screen. However, when 1 is input, no averaging is performed. The number of averaging waveforms is displayed on the screen while executing averaging.
- Page 270 Chapter 6 How to Operate Sampling Scope Once the data collection is started, the waveform is displayed on the screen. Starting data collection Display the waveform of the channel with the monitor signal input. When the Trace Switch Buttons are displayed in gray, reset the gray display by clicking them.
-
Page 271: Adjusting Scales
Adjusting Scales Adjusting Scales 6.8.1 Adjusting Scales Automatically Measure the waveform amplitude and period, and then set to the easily viewable scale. For Eye /Coherent Eye Mode With the trace switch buttons, select the channel you want to display in the center of the waveform display area. In this example, click Ch Click Auto Scale. - Page 272 Chapter 6 How to Operate Sampling Scope adjusted to the active channel signal. ● When Control Ch is All The time axis offset is adjusted to the active channel signal. The Software Delay settings for channels other than the active channel are also adjusted so that the waveforms are displayed in the center.
-
Page 273: Adjusting Vertical Axis
Adjusting Scales 6.8.2 Adjusting Vertical Axis To adjust voltage or optical power at center of vertical axis Click Quick Menu on the left side of the waveform display area. When the buttons are displayed, click the Offset button of Amplitude. The mouse icon is displayed in the button. - Page 274 Chapter 6 How to Operate Sampling Scope Setting same vertical scale for multiple waveforms The vertical scales at all channels can be set to the equal value using the MP2110A-021, MP2110A-022, MP2110A-030, MP2110A-032, MP2110A-039, MP2110A-040, MP2110A-042, and MP2110A-049. Click Amplitude. Click the Tracking button, and set to On.
-
Page 275: Adjusting Horizontal Axis
Adjusting Scales 6.8.3 Adjusting Horizontal Axis Adjusting time at left edge of waveform display area Click Quick Menu in the right side of the waveform display area. When the buttons are displayed, click the Offset or Delay button of Time. The rotary knob icon is displayed in the button. Input the time at left edge of screen using the mouse wheel. -
Page 276: Measuring Waveform
Chapter 6 How to Operate Sampling Scope Measuring Waveform The waveform measurement methods are as follows. For the explanation of the measurement items, refer to 1.5 “Technical Terms”. ● Amplitude and time measurements Select the measurement items from the following: For NRZ One Level, Zero Level, Eye Amplitude, Eye Height, Eye Height (Ratio), Crossing, SNR, Average Power (dBm), Average Power (mW),... - Page 277 Measuring Waveform measures the data count in the mask. The set data count can measure the mask margin within the mask. Table 6.9-1 Measurement Method per Displayed Mode Sampling Mode Coherent Advanced Pulse Jitter Measurement Method Amplitude and time ...
-
Page 278: Setting And Displaying Measurement Items
Chapter 6 How to Operate Sampling Scope 6.9.1 Setting and Displaying Measurement Items Waveform amplitude and time can be measured when data is collected by Eye mode or Coherent Eye mode. Figure 6.9.1-1 Amplitude/Time Tab When Signal Type is NRZ 6-84... - Page 279 Measuring Waveform To set measurement items: Click Measure to open the Measure dialog box. Click Amplitude/Time tab. Click on the right column of an item or items you want to add. The column of the selected item turns into light blue. Click Add, and the light blue column is selected by ...
- Page 280 Chapter 6 How to Operate Sampling Scope Figure 6.9.1-2 Display Example of Measurement Area If the item is measured properly in PAM4 waveform, PAM4 in black is displayed. When there is a possibility the waveform may not have been measured correctly due to too small amplitude or too large jitter, channel name and “NRZ?”...
- Page 281 Measuring Waveform Figure 6.9.1-4 Example of PAM4 Display Deleting items Click Measure. The Measure dialog box appears. The Measure dialog box is displayed. Click Amplitude/Time tab. Click in the right column of the item(s) you want to delete. Click Delete. The Results window items are removed. To delete all the items selected for the active channel, click All Delete Channel Item.
- Page 282 Chapter 6 How to Operate Sampling Scope 6.9.1.1 NRZ Figure 6.9.1.1-1 Setup (NRZ Amplitude/Time) Dialog Box To change EYE Boundary The 1 and 0 level measurement area can be changed. Click NRZ at Measure Setup on Figure 6.9.1-1. Click the Offset from Crossing text box to set the area center position.
- Page 283 Measuring Waveform Width Offset from Crossing Figure 6.9.1.1-2 Setting Item of EYE Boundary 6-89...
- Page 284 Chapter 6 How to Operate Sampling Scope To set measurement method of rise/fall time When measuring the rise time and fall time levels, select from amplitude 10/90% level or 20/80% level. ● Click the Rise/Fall Time button to display 10/90% or 20/80%. The bandwidth of the sampling oscilloscope is corrected with the measurement value of the Rise/Fall time, and the corrected bandwidth is displayed.
- Page 285 Measuring Waveform 6.9.1.2 How to measure TDECQ This section explains how to measure TDECQ. Click Setup. Figure 6.9.1.2-1 General Tab Settings Set measurement channel’s Signal Type to PAM4. Set Sampling Mode to Coherent Eye. Set Test Pattern to one of the following: PRBS2^7-1: 127 symbols PRBS2^9-1:...
- Page 286 Chapter 6 How to Operate Sampling Scope Figure 6.9.1.2-2 O/E Tab Settings Click Amplitude O/E. Click O/E tab. Set Input Connector (Wavelength) when needed. Select a filter at Filter Selection. To measure TDECQ specified in the IEEE standard, select: ● 400GbE/8 SMF (13.3G) for TDECQ of 26 Gbaud ●...
- Page 287 Measuring Waveform Figure 6.9.1.2-4 Rate Tab Settings 10. Click Time. 11. Set Precision Trigger when needed. 12. Click Auto Scale. If the scales are not set properly, set the value for Divide Ratio, and then click Acquire Clock Rate. In Coherent Eye or Pulse mode, only the following values can be set for Divide Ratio: 1/2, 1/4, 1/8, 1/16, 1/32, 1/40, 1/48, or 1/64 Figure 6.9.1.2-5 Amplitude/Time Tab Settings...
- Page 288 Chapter 6 How to Operate Sampling Scope 14. Set Item Selection to Item Type: PAM4. 15. Click and select the measurement item(s), and then click Add. 16. Click PAM4 at Measure Setup to display Setup (PAM4 Amplitude/Time) dialog box. Figure 6.9.1.2-6 Setup (PAM4 Amplitude/Time) Dialog Box 17.
- Page 289 Measuring Waveform 20. Click Sampling, and you will see that Sampling is followed by Run. Set Target SER and Optimize Threshold as needed. Figure 6.9.1.2-8 Display Example of Measurement Results 21. To display the not-equalized waveform, set Display Equalized Waveform shown in Figure 6.9.1.2-7 to Off. To change the waveform color, on the Utilities tab shown in Figure 6.9.1.2-1, set Waveform Color to Gray Scale, and then click Color Select.
-
Page 290: Mask Test
Chapter 6 How to Operate Sampling Scope 6.9.2 Mask Test To execute the mask test, first select measurement channel and mask. There are two types of mask tests as follows: ● Set the upper data error count and measure the mask margin. ●... - Page 291 Measuring Waveform To select channel and mask Click Measure to open the Measure dialog box. Click Mask Test tab. Click Target Channel button, and then select the channel to be measured. The next channel cannot be selected. Channel whose signal type is set to PAM4. ...
- Page 292 Chapter 6 How to Operate Sampling Scope To measure mask margin Click Setup. Click the Sampling Mode button to set the display Eye or Coherent Eye. Click Sampling to set the display Run. When the trace is displayed, click Auto Scale. Check that the eye pattern is displayed in the center of the screen.
- Page 293 Measuring Waveform To set Mask Margin and execute mask test Click Setup. Click the Sampling Mode button to set the display Eye or Coherent Eye. Click Sampling to set the display Run. When the trace is displayed, click Auto Scale. Check that the eye pattern is displayed in the center of the screen.
- Page 294 Chapter 6 How to Operate Sampling Scope Figure 6.9.2-2 Mask Test Example The following values are displayed in the measurement result: Total Samples: Total data count displayed on the screen Total Waveforms: Total waveform count displayed on the screen Mask Margin: Mask Margin measurement results or settings Hit Count or Hit Ratio:...
- Page 295 Measuring Waveform Adjusting mask position To adjust mask position automatically When Align Method is Zero/One/Crossing, click the Mask Alignment Update. When clicking the Mask Alignment Update calculate Zero/One/Crossing of the currently described waveform and optimize the mask position automatically. The mask position is adjusted automatically if the Scale and Offset on the screen are changed.
- Page 296 Chapter 6 How to Operate Sampling Scope Clicking Center moves the marker without depending on the waveforms. In this case, the setting values of X1, ΔX, Y1, and ΔY are initialized. Although the marker is not displayed at Display Off, the marker position can be adjusted by changing the value in the text box.
- Page 297 Measuring Waveform “Restriction enabled” is displayed in the measurement result display area. Figure 6.9.2-5 Example of Area Limited Mask Test 6-103...
-
Page 298: Jitter Analysis
Chapter 6 How to Operate Sampling Scope 6.9.3 Jitter Analysis The jitter analysis displays the measurement results of the following items by jitter element. Numeric value (ps, UI Unit) Histogram Spectrum Pattern display per bit Jitter can be analyzed when Sampling Mode of Scope is set to Eye or Advanced Jitter. - Page 299 Measuring Waveform Jitter analysis can measure different kinds of jitter at the same time. Also, Eye Mask can be measured simultaneously. Figure 6.9.3-2 Display Example of Jitter Analysis and Eye Mask Test When Channel Math of Scope is Off, jitter can be analyzed without any limit of pattern length.
- Page 300 Chapter 6 How to Operate Sampling Scope Jitter Analysis (Advanced Jitter) allows jitter analysis for waveforms up to 32768 of pattern length. Fall Edge Rise Edge Figure 6.9.3-3 Measured Part and Display Example of Jitter Analysis (Advanced Jitter) 6-106...
- Page 301 Measuring Waveform Jitter Analysis (Eye) Click Scope. Click Setup and set Sampling Mode to Eye. Set Signal Type to NRZ if it is displayed. Click Time and set Data Clock Rate and Pattern Length. Click Sampling to display Sampling Run at the button display. Click Auto Scale.
- Page 302 Chapter 6 How to Operate Sampling Scope 13. Click the TJ Measurement BER button to specify the BER to measure the eye aperture with the Bathtub graph. Set the following items as needed. Fixed RJ, RJ Value, Correction Factor, DJ (Scale), RJ (Scale), RJ (rms), Define Threshold, Manual Crossing 14.
- Page 303 Measuring Waveform 17. Click the Measurement Edge Type button to set the edge for jitter measurement. All: Rising edge and falling edge Falling: Only falling edge Rising: Only rising edge 18. Click Advanced tab. 19. Click the TJ Measurement BER button to specify the BER to measure the eye aperture with the Bathtub graph.
- Page 304 Chapter 6 How to Operate Sampling Scope The following message dialogs are displayed when analysis errors occur. Table 6.9.3-1 Jitter Analysis Error Message Message Description Illegal Error An unexpected error has occurred. NRZ? NRZ? error has occurred in Scope. Change settings of Scope so that NRZ? error will not occur.
-
Page 305: Measurement Using Histogram
Measuring Waveform 6.9.4 Measurement Using Histogram The histogram display displays the data distribution in the set field to measure the mean, standard deviation, and dispersion width. To display histogram, set the axis, time, or amplitude for measuring histogram. And then, set the screen area to display histogram using the histogram marker. - Page 306 Chapter 6 How to Operate Sampling Scope Click Histogram to open the Histogram panel. The Histogram panel can be moved anywhere on the Scope window. Click the Histogram button and set the display to On. To measure the histogram in the time direction, click the Axis button to change it to Time.
- Page 307 Measuring Waveform Figure 6.9.4-2 Histogram Measurement Example (Amplitude) Figure 6.9.4-3 Histogram Measurement Example (Time) 6-113...
-
Page 308: Using Marker
Chapter 6 How to Operate Sampling Scope 6.9.5 Using Marker The marker is used to read the amplitude and time values of the waveform. Also, the level and time differences between two points can be measured. There are two markers each for the x- and y-axes. Display of each marker can be set to on or off separately. - Page 309 Measuring Waveform Figure 6.9.5-1 Marker Display 6-115...
-
Page 310: Displaying Waveform Calculation
Chapter 6 How to Operate Sampling Scope 6.9.6 Displaying Waveform Calculation MP2110A-021 can display the math results of two waveforms of CH A and CH B as different waveforms. The calculated math results can be measured at Section 6.9.1 “Setting and Displaying Measurement Items”. Note: When calculating the EYE pattern waveform, set Sampling Mode to Coherent Eye and collect the data. -
Page 311: Using Trace Memory
Measuring Waveform 6.9.7 Using Trace Memory The trace memory is a function to save the measurement waveform in the memory. The waveform saved in the trace memory calls the reference trace. To save the waveform in the trace memory Click Setup to open the Setup dialog box. Select a channel or channels for waveform display by clicking the Trace switch buttons. -
Page 312: Displaying A Label
Chapter 6 How to Operate Sampling Scope 6.9.8 Displaying a Label This section describes how to display an arbitrary string (label) in the Scope screen. Label Figure 6.9.8-1 Label Display Displaying labels Channels subject to label display vary depending on the graph display mode. -
Page 313: Saving Measurement Results
Measuring Waveform Note: Up to 1023 characters can be entered. However, all characters may not be displayed because the characters that can be displayed are limited. The color of the label cannot be changed. Deleting the displayed label The channels subject to label deletion vary depending on the Control Ch setting. - Page 314 File List. Click OK to save the screen image. When overwriting a file, a confirmation dialog box is displayed. The path to the default folder is: C:\Users\Public\Documents\Anritsu\MX210000A\UserData\Screen Copy The date and time are recorded in the default file name. 6-120...
- Page 315 Click Capture. The file selection screen same as the entire screen to be saved is displayed. Set the file format, folder and file name and click OK. The image png file is saved in the following path when the folder is set to the default. C:\Users\Public\Documents\Anritsu\MX210000A\UserData\Screen Copy 6-121...
- Page 316 Click OK or press the rotary knob. The measurement condition file is saved in the following folder. The extension for saved files is WFS. C:\Users\Public\Documents\Anritsu\MX210000A\UserData\Setting The measurement result file is saved in the following folder. The extension of the measurement data file is CSV and TXT.
- Page 317 Measuring Waveform Amplitude/Time Measurement and Histogram Rise Time Ch A N/A N/A N/A N/A N/A Measurement - Channel A Rise Time Ch B N/A N/A N/A N/A N/A [Setups] Rise Time Ch C N/A N/A N/A N/A N/A Axis Amplitude Rise Time Ch D 17.49 17.45 0.13 15.51 17.53 X1 Marker 0.50UI Fall Time Ch A N/A N/A N/A N/A N/A N/A...
- Page 318 Chapter 6 How to Operate Sampling Scope Outer OMA(uW) Ch B N/A N/A N/A N/A N/A Level(2) RMS Ch C N/A N/A N/A N/A N/A Outer OMA(uW) Ch C N/A N/A N/A N/A N/A Level(2) RMS Ch D N/A N/A N/A N/A N/A Outer OMA(uW) Ch D N/A N/A N/A N/A N/A Level(1) RMS Ch A N/A N/A N/A N/A N/A Outer ExR Ch A N/A N/A N/A N/A N/A...
- Page 319 Measuring Waveform Eye(Lower) Level Ch D N/A N/A N/A N/A N/A TDECQ (Middle/Left) Ch A N/A N/A N/A N/A N/A TDECQ (Middle/Left) Ch B N/A N/A N/A N/A N/A Eye(Upper) Skew Ch A N/A N/A N/A N/A N/A TDECQ (Middle/Left) Ch C N/A N/A N/A N/A N/A Eye(Upper) Skew Ch B N/A N/A N/A N/A N/A TDECQ (Middle/Left) Ch D N/A N/A N/A N/A N/A Eye(Upper) Skew Ch C N/A N/A N/A N/A N/A...
- Page 320 Chapter 6 How to Operate Sampling Scope EYE Opening (CHA) Waveform EYE Opening (CHB) 665x497 EYE Opening (CHC) Ch A EYE Opening (CHD) 2.001209e-011 0 0 0 0 0 0 0 0 …(waveformdata) J2 Jitter (CHA) J2 Jitter (CHB) Ch B J2 Jitter (CHC) 0 0 0 0 0 0 0 0 …(waveformdata) J2 Jitter (CHD)
- Page 321 Measuring Waveform 0.000000e+000 2.500797e-001 2.629325e-001 3.878785e-010 2.363070e-001 2.199969e-001 7.757569e-010 2.187477e-001 1.760318e-001 1.163635e-009 1.946739e-001 1.231880e-001 1.551514e-009 1.636975e-001 8.758698e-002 1.939392e-009 1.281193e-001 6.095059e-002 2.327271e-009 9.216683e-002 3.583689e-002 2.715149e-009 6.032596e-002 2.320497e-002 3.103028e-009 3.563668e-002 1.473366e-002 3.490906e-009 1.888023e-002 6.455358e-003 3.878785e-009 8.229616e-003 3.710222e-003 4.266663e-009 3.418210e-003 1.479800e-003 4.654542e-009 1.258116e-003 6.433911e-004 5.042420e-009 4.094003e-004...
- Page 322 Chapter 6 How to Operate Sampling Scope 6-128.
-
Page 323: Chapter 7 Performance Test
Chapter 7 Performance Test This chapter describes how to test the performance of the MP2110A. Performance Test for Pulse Pattern Generator .... 7-2 7.1.1 Required equipment ......... 7-2 7.1.2 Frequency accuracy ......... 7-3 7.1.3 Waveform ............7-4 7.1.4 Skew ..............7-9 Performance Test for Error Detector ...... -
Page 324: Performance Test For Pulse Pattern Generator
1 hour. Table 7.1.1-1 Equipment for Performance Test Recommended Product Name Required Performance Equipment Sampling Electrical interface MP2110A oscilloscope Bandwidth: 40 GHz or more (Anritsu) Frequency counter Frequency range: MF2412C 500 MHz to 20 GHz (Anritsu) Accuracy: 0.1 ppm max. -
Page 325: Frequency Accuracy
Performance Test for Pulse Pattern Generator 7.1.2 Frequency accuracy (1) Specification ±10 ppm (One hour after power on) (2) Setup Sync Out Coaxial Terminator Frequency Counter 7 025 000 002.3 Input Figure 7.1.2-1 Operation Frequency Range Test Setup (3) Procedure Connect the Sync Out connector to the input connector of the frequency counter. -
Page 326: Waveform
Chapter 7 Performance Test Read the value measured by the frequency counter. Check that the read value is within the following limited values. Without the MP2110A-093: 3 037 500±30.37 kHz With the MP2110A-093: 1 187 500±11.87 kHz 7.1.3 Waveform (1) Specification Amplitude: 0.1 to 0.8 Vp-p Accuracy:... - Page 327 Performance Test for Pulse Pattern Generator Coaxial Terminator Figure 7.1.3-2 PPG1 Data Out Waveform Test Connection Diagram Coaxial Terminator Sampling oscilloscope Figure 7.1.3-3 PPG1 Data Out Waveform Test Connection Diagram...
- Page 328 Chapter 7 Performance Test Coaxial Terminator Sampling oscilloscope Figure 7.1.3-4 PPG1 Data Out Waveform Test Connection Diagram...
- Page 329 Performance Test for Pulse Pattern Generator (3) Procedure Connect the coaxial terminator to the PPG1 Data connector. Connect the Clk Out connector and the Trigger Clk In connector of the sampling oscilloscope using a coaxial cable. Connect the PPG1 Data Out connector and the Ch A In connector of the sampling oscilloscope using a coaxial cable.
- Page 330 Chapter 7 Performance Test 10. Click PPG/ED Ch1. 11. Set Amplitude to 0.3 Vp-p. 12. Click Scope. Configure the settings as shown below: Dialog Box Item Setting Value Measure - Item (A) Fall Time Amplitude/Time (A) Rise Time (A) Crossing (A) Jitter RMS 13.
-
Page 331: Skew
Performance Test for Pulse Pattern Generator 7.1.4 Skew (1) Specification ±8 ps (Amplitude 0.3 Vp-p, 25.78125 Gbit/s) (2) Setup Figure 7.1.4-1 PPG1 Data Out Skew Test Connection Diagram Figure 7.1.4-2 PPG1 Data Out Skew Test Connection Diagram (3) Procedure Connect the Clk Out connector and the Trigger Clk In connector of the sampling oscilloscope using a coaxial cable. - Page 332 Chapter 7 Performance Test Click PPG/ED Ch1. Configure the settings as shown below: Item Setting Value Reference Clock Internal Bit Rate 100GbE/4 (25.78125G), 0 ppm Clock Output Ch1/2 PPG Amplitude 0.3 Vp-p External ATT 0 dB Test Pattern (PPG) PRBS 2^9–1, POS PPG Data/XData Click Scope.
- Page 333 Performance Test for Pulse Pattern Generator Figure 7.1.4-3 Measurement Example of Skew For PPG2 to PPG4, perform a test in the same way. For PPG3 and PPG4 test, change the Clock Output in step 4 to the following value. Item Setting Value Clock Output Ch3/4...
-
Page 334: Performance Test For Error Detector
1 hour. Table 7.2.1-1 Equipment for Performance Test Recommended Product Name Required Performance Equipment Sampling Electrical interface MP2110A oscilloscope Bandwidth: 40 GHz or more (Anritsu) Fixed 20 dB, K connector 41KC-20 attenuator Bandwidth: DC to 40 GHz (Anritsu) 7-12... -
Page 335: Operating Frequency
Performance Test for Error Detector 7.2.2 Operating frequency (1) Specification Without MP2110A-093: 24.3 Gbit/s –100 ppm to 28.2 Gbit/s +100 ppm With MP2110A-093: 24.3 Gbit/s –100 ppm to 28.2 Gbit/s +100 ppm, 9.5 Gbit/s –100 ppm to 14.2 Gbit/s +100 ppm BER 10 or less under the following conditions: –12... - Page 336 Chapter 7 Performance Test Fixed Attenuator Coaxial Terminator (a) Amplitude Check Coaxial Terminator Fixed Attenuator (b) Input Level Measurement Figure 7.2.2-2 ED1 Data In Input Sensitivity Test Connection Diagram 7-14...
- Page 337 Performance Test for Error Detector (3) Procedure Connect the Clk Out connector and the Trigger Clk In connector of the sampling oscilloscope using a coaxial cable. Connect the coaxial terminator to the ED1 In connector Data and PPG1 Out connector. Data Attach a 20 dB fixed attenuator to the PPG1 Data Out connector.
- Page 338 Chapter 7 Performance Test Connect the 20 dB fixed attenuator and ED1 Data In connector using a coaxial cable. (Refer to (b) in Figure 7.2.2-1.) 10. Click Start at All Measurements. 11. Record the error rate ER for the ED Result after measurement is complete.
-
Page 339: Rx Sensitivity
Performance Test for Error Detector 7.2.3 Rx sensitivity (1) Specification 40 mVp-p BER 10 or less under the following conditions: –12 Bit rate: 25.78125 Gbit/s Pattern: PRBS31 Mark ratio: Single-end Back-to-back connection (2) Setup Same as Figure 7.2.2-1 and Figure 7.2.2-2. (3) Procedure Connect the Clk Out connector and the Trigger Clk In connector of the sampling oscilloscope using a coaxial cable. - Page 340 Chapter 7 Performance Test Click Scope. Configure the settings as shown below: Dialog Box Item Setting Value Setup Signal Type Sampling Mode Number of Samples 4050 Accumulation Time Persistency Time 10.0 sec Time Tracking Bit Rate: PPG, Divide Ratio: Clock Output Measure - Display...
-
Page 341: Maximum Input Level And Patterns
Performance Test for Error Detector 7.2.4 Maximum input level and patterns (1) Specification 800 mVp-p BER 10 or less under the following conditions: – Bit rate: When MP2110A-093 is not installed: 24.3 to 28.2 Gbit/s When MP2110A-093 is installed: 9.5 to 28.2 Gbit/s ... - Page 342 Chapter 7 Performance Test Click PPG/ED Ch1. Configure the settings as shown below: Item Setting Value Reference Clock Internal Symbol Rate 100GbE/4 (25.78125G), 0 ppm Clock Output Ch1/2 PPG Amplitude External ATT Test Pattern (PPG) PRBS 2^31–1, POS Test Pattern (ED) PRBS 2^31–1, POS ED Input Condition Single-Ended Data Threshold...
-
Page 343: Error Detection
Performance Test for Error Detector 7.2.5 Error detection (1) Specification Error detection is possible under the following conditions: Amplitude: 50 mV Bit rate: 25.78125 Gbit/s Pattern: PRBS31 Mark ratio: Single-end Back-to-back connection (2) Setup Same as Figure 7.2.2-1 and Figure 7.2.2-2. - Page 344 Chapter 7 Performance Test Click Scope. Configure the settings as shown below: Dialog Box Item Setting Value Setup Signal Type Sampling Mode Number of Samples 4050 Accumulation Time Persistency Time 10.0 sec Time Tracking Symbol Rate: PPG, Divide Ratio: Sync Output Measure - Display...
-
Page 345: Performance Test For Sampling Oscilloscope
Performance Test for Sampling Oscilloscope 7.3 Performance Test for Sampling Oscilloscope This section describes the performance test item for the sampling oscilloscope. Amplitude accuracy Optical Power Meter CRU (MP2110A-054) 26G/53G CRU (MP2110A-055) 7-23... -
Page 346: Required Equipment
Recommended Product Name Required Performance Equipment Pulse Pattern Clock frequency: 7 GHz MP2110A Generator or Amplitude: 0.5 Vp-p (Anritsu) Signal Generator DC Power Source* Power voltage: ±2.5 V 2400 Power current: ±50 mA (Keithley Instruments) Setting accuracy: 1% or less... - Page 347 Performance Test for Sampling Oscilloscope MP2110A-035, MP2110A-036, MP2110A-039, MP2110A-040, MP2110A-042, MP2110A-045, MP2110A-046, and MP2110A-049 *3: Required for MP2110A-054 *4: Required for MP2110A-055 7-25...
-
Page 348: Amplitude Accuracy
Chapter 7 Performance Test 7.3.2 Amplitude accuracy (1) Specification (–2%–offset amplitude accuracy) to (+2%+offset amplitude accuracy) The offset amplitude accuracy after calibration is as shown in the following figure. Scale=250 mV/div Scale=200 mV/div Scale=100 mV/div Scale=50 mV/div Scale=15 mV/div Scale=1 mV/div Difference from Offset Voltage (mV) Figure 7.3.2-1 Offset Amplitude Accuracy (2) Setup... - Page 349 Performance Test for Sampling Oscilloscope DC Power Supply Coaxial Cable Figure 7.3.2-3 Amplitude Accuracy Test Connection Diagram (When using a signal generator) (3) Procedure In case of Figure 7.3.2-2, connect the Sync Out connector and the Trigger Clk In connector using a coaxial cable. In case of Figure 7.3.2-3, connect the Trigger Clk In connector and the signal generator output connector using a coaxial cable.
- Page 350 Chapter 7 Performance Test Click Scope. Configure the settings as shown below: Dialog Box Item Setting Value Setup Signal Type Sampling Mode Number of Samples 2048 Accumulation Time None Time Tracking Divide Ratio Unit UI On Screen Software Delay Amplitude Ch A Scale 50 mV/Div.
- Page 351 Performance Test for Sampling Oscilloscope With the MP2110A-021, test the amplitude accuracy for Ch B after measuring the amplitude accuracy for Ch A. Click Scope. Configure the settings as shown below: Dialog Box Item Setting Value Amplitude Ch B Scale 50 mV/Div.
-
Page 352: Optical Power Meter
Chapter 7 Performance Test 7.3.3 Optical Power Meter (1) Specification Accuracy: ±0.35 dB if the input level is –12 dBm or greater (2) Setup Light Source Optical Fiber Programmable Optical Power Meter Optical Attenuator Figure 7.3.3-1 Optical Power Meter Test Connection Diagram (SMF, When using a PPG of MP2110A) 7-30... - Page 353 Performance Test for Sampling Oscilloscope Light Source Optical Fiber Programmable Optical Power Meter Optical Attenuator Figure 7.3.3-2 Optical Power Meter Test Connection Diagram (MMF, when using a signal generator) 7-31...
- Page 354 Chapter 7 Performance Test (3) Procedure The SMF performance test for Ch B is explained below. In case of Figure 7.3.3-1, connect the Sync Out connector and the Trigger Clk In connector using a coaxial cable. In case of Figure 7.3.3-2, connect the Trigger Clk In connector and the signal generator output connector using a coaxial cable.
- Page 355 Performance Test for Sampling Oscilloscope Connect the output connector of the light source and the input connector of the programmable optical attenuator, using a single-mode optical fiber. Connect the output connector of the programmable optical attenuator and the optical power meter, using a single-mode optical fiber.
- Page 356 Chapter 7 Performance Test The MMF performance test for Ch B is explained below. In case of Figure 7.3.3-1, connect the Sync Out connector and the Trigger Clk In connector using a coaxial cable. In case of Figure 7.3.3-2, connect the Trigger Clk In connector and the signal generator Output connector using a coaxial cable.
- Page 357 Performance Test for Sampling Oscilloscope Connect the output connector of the programmable optical attenuator and the optical power meter, using a multi-mode optical fiber. Set the light source wavelength to 850 nm. 10. Set the optical power meter wavelength to 850 nm. 11.
-
Page 358: Cru (Mp2110A-054)
Chapter 7 Performance Test 7.3.4 CRU (MP2110A-054) (1) Specification Sensitivity: 20 mVp-p or less 25.78125 Gbit/s, PRBS2 –1 NRZ, Loop BW = 10 MHz, Single-ended, Mark ratio 1/2, Using MP2110A PPG Additive jitter: 400 fs or less 25.78125 Gbit/s, 26.5625 Gbit/s, 28.05 Gbit/s, Input amplitude 400±100 mVp-p, 1/4Clock Pattern, Loop BW = 10 MHz, Single-ended, Mark ratio 1/2, Using MP2110A PPG (2) Setup... - Page 359 Performance Test for Sampling Oscilloscope Coaxial Terminator Open (a) Jitter Check (b) Additive Jitter Test Figure 7.3.4-2 Additive Jitter Test Connection Diagram 7-37...
- Page 360 Chapter 7 Performance Test (3) Procedure Sensitivity Test Connect the Clk Out connector and the Trigger Clk In connector of the sampling oscilloscope using a coaxial cable. Connect the coaxial terminator to the PPG1 Data connector. Connect an Open connectors to ED1 Data In connector, and ED1 In connector respectively.
- Page 361 Performance Test for Sampling Oscilloscope Additive Jitter Test Remove the 20 dB fixed attenuator from PPG1 Data Out connector. Refer to Figure 7.3.4-2 (a). Connect a coaxial terminator to PPG1 Data Out connector. Connect the Sync Out connector and the Trigger Clk In connector using a coaxial cable.
- Page 362 Chapter 7 Performance Test Click Ch A of Scope to display the graph. Adjust Software Delay in Time Scale/Offset tab so that the cross point is displayed at center of the window. Write down the jitter RMS measurement value. The jitter RMS measurement value is the std Dev value for Histogram.
-
Page 363: 53G Cru (Mp2110A-055)
Performance Test for Sampling Oscilloscope 7.3.5 26G/53G CRU (MP2110A-055) (1) Specification Sensitivity: 265 µW or less (OMA) 25.78125 Gbit/s, PRBS2 –1 NRZ, Wavelength 1310 nm (2) Setup Light Source (SFP28) Optical Fiber Programmable Optical Attenuator Figure 7.3.5-1 CRU Sensitivity Test Connection Diagram (Amplitude Check) Figure 7.3.5-2 MT1000A Settings 7-41... - Page 364 Chapter 7 Performance Test Light Source (SFP28) Optical Fiber Programmable Optical Attenuator Figure 7.3.5-3 CRU Sensitivity Test Connection Diagram 7-42...
- Page 365 Performance Test for Sampling Oscilloscope (3) Procedure Connect the Sync Clock Out connector of MU100011A and the Trigger Clk In connector of the scope, using a coaxial cable. Refer to Figure 7.3.5-1. Connect the output connector of the light source and the input connector of the programmable optical attenuator, using a single-mode optical fiber.
- Page 366 Chapter 7 Performance Test 9. Connect the output connector of the variable optical attenuator and the Data In connector of the 26G/53Gbaud CRU, using a single-mode optical fiber. Refer to Figure 7.3.5-3. 10. Check that the Lock Status indicator turns green (Lock) within 40 seconds.
- Page 367 Chapter 8 Maintenance This chapter describes maintenance, storage and disposal procedures. Daily Maintenance ............8-2 Replacement of Optical Connector ....... 8-3 Optical Connector/Optical Adapter Cleaning ....8-5 Displaying Software Version ......... 8-8 Updating Software ............8-9 Adding an Option License ........... 8-10 System Recovery Function .........
-
Page 368: Chapter 8 Maintenance
Chapter 8 Maintenance 8.1 Daily Maintenance Before daily maintenance of the MP2110A, be sure to turn the power off and unplug it from the AC outlet. Panel surface dirt When surface dirt is noticeable, after the MP2110A has been used in a dusty environment, or when the MP2110A has not been used for an extended period of time, wipe its surface with a cloth soaked in detergent and wrung well. -
Page 369: Replacement Of Optical Connector
Replacement of Optical Connector 8.2 Replacement of Optical Connector The standard optical connector is the FC type. The optical connector can be removed and replaced with another connector (sold separately). For information, Figure 8.2-1 shows the connector type. Figure 8.2-1 Connector Type WARNING Do not look into the connection surface of the optical fiber cable of the light source optical connector or the end face... - Page 370 Chapter 8 Maintenance To remove the optical connector: Open the cover. Pull up the connector lever toward you. Check that the latch has been released, and then, gently pull the connector out straight toward you. Latch Figure 8.2-2 How to Remove the Optical Connector...
-
Page 371: Optical Connector/Optical Adapter Cleaning
Optical Connector/Optical Adapter Cleaning 8.3 Optical Connector/Optical Adapter Cleaning Cleaning the Ferrule End Surface Use an approved adapter cleaner to clean the ferrule end surface in the optical connector. The ferrule in the optical connectors needs periodic cleaning. Although the following procedures use the FC connector and adapter as an example, use the same methods when cleaning other connector and adapter types. - Page 372 Chapter 8 Maintenance Press the tip of a new (dry) adapter cleaner into the ferrule end surface and then wipe in one direction 2 or 3 times to dry the surface. Clean the adapter interior with adapter cleaner. (Refer to “Cleaning the Optical Adapter” below.) Attach the adapter in the reverse order.
- Page 373 Optical Connector/Optical Adapter Cleaning Cleaning the Optical Fiber Cable Ferrule End Surface Use an approved ferrule cleaner to clean the optical fiber cable ferrule end surface. Although the following procedures use the FC connector and adapter as an example, use the same methods when cleaning other connector and adapter types.
-
Page 374: Displaying Software Version
Chapter 8 Maintenance 8.4 Displaying Software Version Refer to Section 4.3.11 “System Information” for the software version display method. -
Page 375: Updating Software
Updating Software 8.5 Updating Software For how to update the software, refer to the Release Notes. The Release Notes can be downloaded from the following Anritsu website. https://www.anritsu.com/en-US/test-measurement/support/downloads?mo del=MP2110A... -
Page 376: Adding An Option License
Chapter 8 Maintenance 8.6 Adding an Option License <Procedure> Download the latest software (MX210000A) and Release Notes from Anritsu Web site and update the software. For adding an option license, the software of version 6.01 or later is required. https://www.anritsu.com/test-measurement/support/downloads?mode l=MP2110A. - Page 377 Adding an Option License 10. Click System Menu - System Information and confirm the added option. 8-11...
-
Page 378: System Recovery Function
Chapter 8 Maintenance 8.7 System Recovery Function The MP2110A has system recovery function to restore data on the hard disk to the factory shipment status. These functions can be used in the event of system instability. CAUTION Fully understand the following and back up all necessary data before performing a system recovery. - Page 379 System Recovery Function Press the F8 key on the keyboard. The following screen will appear. Use the keyboard cursor keys to select Repair Your Computer, and then press Enter. Click Next. Click OK. Leave the Password box blank. 8-13...
- Page 380 Chapter 8 Maintenance Click Reinstall Windows. Click Yes. 8-14...
- Page 381 Click Restore my files. 10. Click Cancel. 11. Start Internet Explorer, and open the following folder. C:\Program Files\Anritsu\PreSetup 12. Right-click “Recovery.bat” and click run as administrator. 13. Start Internet Explorer after restarting MP2110A. And check that the following folder is deleted.
- Page 382 Chapter 8 Maintenance 14. In Control Panel, click Network Connections. 15. Connect the cable to the Ethernet connector on the left side of the rear panel to establish the link. Ethernet cable 16. Right-click the Realtek PCIe GBE Family Controller icon where the cross mark (×) is not displayed.
- Page 383 System Recovery Function 25. When there are two Intel ® I211 Gigabit Network Connection icons, right-click other Intel ® I211 Gigabit Network Connection icon. 26. Click Rename. 27. Change the name to “DO NOT CHANGE 2”. 28. Click All Programs → Windows Media Player from the start menu. 29.
- Page 384 Chapter 8 Maintenance 30. Check that all check boxes are not selected, and click Next. 31. Click Make Windows Media Player the default music and video player, and click Finish. 8-18...
- Page 385 System Recovery Function 32. Install the BERTWave Control Software (MX210000A) in accordance with the release note. The Module Configuration dialog box is displayed after launching the installer. Select the modules installed in MP2110A, and click OK. The above dialog box is displayed by clicking MX210000A → Module Configuration from the start menu of Windows.
-
Page 386: For Win10
Chapter 8 Maintenance 8.7.2 For Win10 <Procedure> Disconnect the MP2110A from the network if connected. Connect the keyboard and mouse to the mainframe, and then turn the MP2110A power On. Press the F8 key on the keyboard. The following screen will appear. Use the keyboard cursor keys to select Repair Your Computer, and then press Enter . - Page 387 System Recovery Function In the Troubleshoot screen, click Advanced options. In the Advanced options screen, click System Image Recovery. 8-21...
- Page 388 Chapter 8 Maintenance In the System Image Recovery screen, click AnritsuUser, When you are prompted to enter the password, leave it blank, and then click Continue. 8-22...
- Page 389 System Recovery Function 10. In the Select a system image backup page, select Use the latest available system image(recommended), and click Next. 11. In the Choose additional restore options page, and click Next without any changes. 12. When “Your computer will be restored from the following system image:”...
- Page 390 Chapter 8 Maintenance 15. Click on the taskbar and type “Control Panel” in the Search box. 16. Click Control Panel icon. 17. Click Network and Internet. 18. Click Network and Sharing Center. 19. Click Change adapter settings. 20. Connect the cable to the Ethernet connector on the left side of the rear panel to establish the link.
- Page 391 System Recovery Function 28. Click Rename. 29. Change the name to “DO NOT CHANGE 1”. 30. When there are two Intel ® I211 Gigabit Network Connection icons, right-click other Intel ® I211 Gigabit Network Connection icon. 31. Click Rename. 32. Change the name to “DO NOT CHANGE 2”. ) →...
- Page 392 Chapter 8 Maintenance 35. Check that all check boxes are not selected, and click Finish. 36. Windows Media Player starts. Click “x” on the top right corner of the Windows Media Player window to close it. 37. Install the BERTWave Control Software (MX210000A) in accordance with the release notes.
- Page 393 System Recovery Function Checking operation Check the operation using the following procedure after recovering the system. ) → MX210000A → MX210000A . Click Start ( Click System Menu → Remote Control. Check that Local Area Connection (Left) and Local Area Connection (Right) are displayed in the Remote Control dialog box (refer to Figure 4.3.10-1).
-
Page 394: Calibration
The recommended calibration cycle after delivery of the MP2110A is twelve months. If you require support after delivery, contact an Anritsu Service and Sales office. Contact information can be found on the last page of the printed version of this manual, and is available in a separate file on the PDF version. -
Page 395: Storage
Storage 8.9 Storage Wipe off dust, fingerprint marks, stains, spots, etc. from the surface of the MP2110A before storing it. Fit the attached coaxial connector cover to the coaxial connector on the front panel. Also, put the cap on the optical connector. Put the power cord, DVD-ROM and other accessories in the accessory box and store it with the main frame. -
Page 396: Transporting And Disposal
Chapter 8 Maintenance 8.10 Transporting and Disposal The following describes precautions for transporting and disposing of the BERTWave. Repackaging Repack the MP2110A in the packing material (box) in which it was delivered. If the packing material has been thrown away or damaged, repack the MP2110A in the following manner: Prepare a corrugated cardboard, wooden, or aluminum box large enough to pack cushioning material in around the MP2110A. - Page 397 Appendix A Specifications Appendix A describes the specifications for the MP2110A. Only the specifications of the option installed at shipment are described from Section A.2 “BERT” to Section A.4, “General Performance”. However, the specifications of the retrofit option and the specifications of the option installed at shipment are the same.
-
Page 398: Configuration
Appendix A Specifications A.1 Configuration Table A.1-1 Standard Configuration Model/Ordering No. Product Name Q’ty – Main unit – MP2110A BERTWave – Standard Accessories – Power Code J0617B Replaceable optical connector (FC-PC) J1632A TERMINATOR J1341A OPEN J1627A GND connection cable J1763A U Link Coaxial Cable (K) J1764A U Link Coaxial Cable (SMA) - Page 399 Configuration Table A.1-3 Connection Destination and Quantity of J1632A Option Number Connection Destination Q’ty MP2110A-011 Data Out×1, Data Out×1, Out×1 Sync MP2110A-012 Data Out×2, Data Out×2, Out×1 Sync MP2110A-014 Data Out×4, Data Out×4, Out×1 Sync MP2110A-054 O/E Monitor Out×1 When MP2110A-022, MP2110A-023, MP2110A-025, MP2110A-026, MP2110A-030, MP2110A-032, MP2110A-033, MP2110A-035, MP2110A-036, MP2110A-039, MP2110A-040, MP2110A-042, MP2110A-043, MP2110A-045, MP2110A-046, or MP2110A-049 is...
- Page 400 Appendix A Specifications Table A.1-5 Options Model Product Name – Options at Shipment – MP2110A-011 1CH BERT* 1,*2 MP2110A-012 2CH BERT* 1,*2 MP2110A-014 4CH BERT* 1,*2 MP2110A-021 Dual Electrical Scope* MP2110A-022 Dual Optical Scope* MP2110A-023 Optical and Single-ended Electrical Scope* MP2110A-024 Precision Trigger* MP2110A-025...
- Page 401 Configuration Table A.1-5 Options (Cont’d) Model Product Name MP2110A-140 Quad Optical Scope for Singlemode Retrofit* MP2110A-142 Dual Optical Scope Retrofit* MP2110A-143 Optical and Single-ended Electrical Scope Retrofit* MP2110A-145 Optical Scope for Singlemode Retrofit* MP2110A-146 Optical Scope for Multimode Retrofit* MP2110A-149 Quad Optical Scope for Multimode Retrofit* MP2110A-154 Clock Recovery (Electrical/Optical) Retrofit*...
- Page 402 Appendix A Specifications *12: The retrofit options can be installed in the following cases: When no Scope option is installed. • When a Scope option is installed, the retrofit option is • MP2110A-02x, 03x or 04x with the same channel configuration. See the following table for available combinations of installed options and retrofit options.
-
Page 403: Bert
BERT A.2 BERT A.2.1 Common Performances Table A.2.1-1 Common Functions and Performances Item Specifications Internal clock Frequency 10 MHz Accuracy ±10 ppm* Bit rate offset ±100 ppm* Ext Clk In Function to input an external synchronous clock. Frequency Without MP2110A-093 With MP2110A-093 607.5 MHz –... - Page 404 Appendix A Specifications Table A.2.1-1 Common Functions and Performances (Cont’d) Item Specifications Clock Output* Clock Source* Ch1/2, Ch3/4 Division ratio Without MP2110A-093 With MP2110A-093 1/2* 1/4* Amplitude 0.3 to 0.5 Vp-p Duty 50±10% Connector SMA, female Termination 50 Ω, AC coupled Operation Bit Rate Without MP2110A-093 With MP2110A-093...
-
Page 405: Pulse Pattern Generator
BERT A.2.2 Pulse Pattern Generator Table A.2.2-1 PPG Item Specifications Data Output* Number of output MP2110A-011: 1 (Data Out, Data Out)* MP2110A-012: 2 (Data Out, Data Out)* MP2110A-014: 4 (Data Out, Data Out)* Amplitude Range 0.1 to 0.8 Vp-p / 0.01 V resolution (Single-ended) 0.2 to 1.6 Vp-p / 0.02 V resolution (Differential) Accuracy ±20 mV ±20% for settings*... -
Page 406: Error Detector
Appendix A Specifications *8: Selecting Clock Source to Ch1/2 when measuring Ch1 and Ch2, Selecting Clock Source to Ch3/4 when measuring Ch3 and Ch4. *9: Selecting Clock Source to Ch3/4 when measuring Ch1 and Ch2, Selecting Clock Source to Ch1/2 when measuring Ch3 and Ch4. A.2.3 Error Detector Table A.2.3-1 ED... -
Page 407: Appendix A Specifications
BERT Table A.2.3-1 ED (Cont’d) Item Specifications External ATT factor 0 to 30 dB* , 1 dB resolution Test Pattern PRBS: 2^7–1, 2^9–1, 2^15–1, 2^23–1, 2^31–1 Logic invertible Measurement Alarm Detection Sync loss* Bit Error Detection Total Error Rate: 0.0001E–18 to 1.0000E–03 Total Error Count: 0 to 9999999, 1.0000E07 to 9.9999E17 Recovered Clock... -
Page 408: Sampling Oscilloscope
Appendix A Specifications A.3 Sampling Oscilloscope A.3.1 Channel Configuration Table A.3.1-1 Channel Configuration Option Number Ch A Ch B Ch C Ch D MP2110A-x21 Electrical channel Electrical channel None None MP2110A-x22, Optical channel Optical channel None None MP2110A-x32, MP2110A-x42 MP2110A-x23, Electrical channel Optical channel None None... - Page 409 Sampling Oscilloscope *4: Operation is guaranteed at Symbol Rate of 9.95 Gbaud to 40 Gbaud. Possible to analyze when Symbol Length is same Table A.3.2-1 Common Functions and Performances (Cont’d) Item Specifications Number of Samples Number of samples on one screen <Eye>: 1350, 2048, 4050 <Pulse, Coherent Eye>:...
-
Page 410: Time Setting
Appendix A Specifications A.3.3 Time Setting Table A.3.3-1 Time Setting Item Specifications Recalculate Option Specifies the reference parameter Symbol Rate (Symbol Rate is automatically set when Clock Rate is entered) Clock Rate (Clock Rate is automatically set when Symbol Rate is entered) Symbol Rate Specifies the baud rate of the signal input to the Scope channel 100 Mbaud to 60 Gbaud, 1 kbaud step... - Page 411 Sampling Oscilloscope Table A.3.3-1 Time Setting (Cont’d) Item Specifications Pattern Length Specifies capturing pattern length when using Pulse, Coherent Eye Mode Tracking BERT option is required* . Tracks the Pattern length setting of BERT. PPG Ch1, PPG Ch2, PPG Ch3, PPG Ch4, ED Ch1, ED Ch2, ED Ch3, ED Ch4 Manual Settable when Test Pattern in Table A.3.2-1 is Variable.
-
Page 412: Measurement
Appendix A Specifications A.3.4 Measurement Table A.3.4-1 Measurement Item Specifications Signal Type Specifies the signal type of the target channel NRZ, PAM4* Active Channel Selects one channel among Ch A, Ch B, Ch C and Ch D. Marker X1: ON/OFF, X2: ON/OFF Y1: ON/OFF, Y2: ON/OFF PAM4 is selectable when MP2110A-095 is installed Table A.3.4-2 Amplitude/Time Measurement... - Page 413 Sampling Oscilloscope *7: RJ (rms), PJ (p-p), DDJ (p-p), DCD, ISI (p-p). DDPWS and PJ Frequency can be measured when Sampling Mode is Advanced Jitter. *8: BER specified in TJ Measurement BER in the setting items *9: Impossible to measure with differential signals Table A.3.4-2 Amplitude/Time Measurement (Cont’d) Item Specifications...
- Page 414 Appendix A Specifications Table A.3.4-2 Amplitude/Time Measurement (Cont’d) Item Specifications PAM4 Measure Setup (Cont’d) Eye Opening “Zero Hits”: The value at which the Eye opening becomes the largest in Definition the sample evaluation is measured. “1E–01 to 1E–06”: Error rate is set in step of 1E+01, The measurement result is calculated at the specified error rate.
- Page 415 Sampling Oscilloscope Table A.3.4-3 Jitter Measurement Item Specifications Jitter Measure Setup Settings related to jitter measurement items* TJ Measurement Sets the BER to measure TJ(User Define) and Eye Opening with the measurement result. Selectable up to 1.0E–001 to 1.0E–018, in 1.0E+001 Step Fixed RJ Function to use User-specified value for RJ results “ON”: Uses the value of Fixed RJ Factor...
- Page 416 Appendix A Specifications Table A.3.4-4 Histogram Item Specifications Histogram Setting functions related to the Histogram measurement Target Channel ON, OFF Measures the Active Channel Axis Amplitude, Time Marker X1, X2, Y1, Y2 Result Display Mean, Std. Dev, p-p, Hits Table A.3.4-5 Mask Test Item Specifications Mask Test...
-
Page 417: Utilities
Sampling Oscilloscope A.3.5 Utilities Table A.3.5-1 Utilities Item Specifications EYE/Pulse Shot Saves Result screen image as jpg or png format image. Inverse Background Saves EYE / Pulse Shot waveform area with reversing the color. Color Waveforms Only Saves only the waveform display area in the Result screen. Waveform Color Selects the gradation table of the waveform at the time of cumulative setting. -
Page 418: Horizontal System
Appendix A Specifications A.3.7 Horizontal System Table A.3.7-1 Horizontal System Item Specifications Trigger Clk In Connector SMA Connector (f.) Termination 50 Ω, AC coupled Trigger Clock 0.1 to 15.0 GHz Frequency When this item is set in the range of 2.4 to 15.0 GHz, the Precision Trigger function can be set to ON. -
Page 419: Electrical Channel
Sampling Oscilloscope A.3.9 Electrical Channel Table A.3.9-1 Electrical Channel Function Item Specifications Amplitude Setting Scale Scale Setting on the vertical axis. Both ChA and ChB can be set as follows 1 to 200 mV/div, 0.1 mV step Offset Offset setting on the vertical axis. Both ChA and ChB can be set as follows –500 to 500 mV, 1 mV step Attenuation Function of correcting Amplitude Scale / Offset and measurement result in... - Page 420 Appendix A Specifications Table A.3.9-2 Electrical Channel Performance Item Specifications Data Input Electric Input Connector Connector K Connector (f) Termination 50 Ω, DC coupled Maximum ±2 V maximum input before damage Amplitude Dynamic Range ±400 mV* Amplitude Accuracy ±2% of reading ± offset amplitude accuracy (refer to below fig. * Scale = 250mV/div Scale =...
- Page 421 Sampling Oscilloscope Differences at offset Amplitude values measurement value 150 mV 400 mVp-p Scale 50 mV/Div. 1 level 200 mV Offset voltage 50 mV 0 level –200 mV Differences at offset values 250 mV In this example, the difference between 1 level voltage (200 mV) and offset voltage (50 mV) is 150 mV.
-
Page 422: Optical Channel
Appendix A Specifications A.3.10 Optical Channel Table A.3.10-1 Optical Channel Function Item Specifications Amplitude Setting Scale Scale setting on the vertical axis. 1 to 200 µW /div, 1 µW step Offset Offset setting on the vertical axis. Both ChA and ChB can be set as follows. –500 to 500µW, 1 µW step Attenuation Function of correcting Amplitude Scale / Offset and measurement result in... - Page 423 Sampling Oscilloscope Table A.3.10-2 Optical Channel Performance Item Specifications Data Input Optical Input Connector Ch A, Ch B, Ch C, Ch D Connector FC Connector (SMF Input, MMF Input) Fiber SMF Input: 62.5 µm GI Multimode fiber, accepts single mode fiber (When the installed option is other than MP2110A-x30 or x40) Singlemode fiber (When the installed option is MP2110A-x30 or x40) MMF Input:...
- Page 424 Appendix A Specifications Table A.3.10-2 Optical Channel Performance (Cont’d) Item Specifications Optical Noise When MP2110A-022, 023, 025, 026, 032, 033, 035, 036, or 039 is installed: When MP2110A-054 When MP2110A-054 Conditions is not installed is installed* SMF Input, 1310 nm, Typ.
- Page 425 Sampling Oscilloscope Table A.3.10-2 Optical Channel Performance (Cont’d) Item Specifications Mask Sensitivity When MP2110A-022, 023, 025, 026, 032, 033, 035, 036, or 039 is installed: When MP2110A-054 is not When MP2110A-054 is installed* installed SMF: Typ. –15.0 dBm SMF: Typ. –13.5 dBm (1310 nm, OTU4 Filter) (1310 nm, OTU4 Filter) MMF: Typ.
- Page 426 Appendix A Specifications Table A.3.10-2 Optical Channel Performance (Cont’d) Item Specifications Optical Power Meter Range When MP2110A-022, 023, 025, 026, 032, 033, 035, 036, 039, 042, 043, 045, 046, or 049 is installed: –18 to 0 dBm (SMF Input) –18 to +2 dBm (MMF Input) When MP2110A-030 or 040 is installed: –18 to +2 dBm (SMF Input) Accuracy...
-
Page 427: Cru (Mp2110A-054
Sampling Oscilloscope A.3.11 CRU (MP2110A-054) Table A.3.11-1 CRU Input Item Specifications Data Format NRZ, PAM4 available (PRBS pattern) Operation Baud Rate 25.5 to 28.2 Gbaud Sensitivity Typical 10 mVp-p* Max. 20 mVp-p* Maximum Amplitude 800 mVp-p Maximum Amplitude 1 Vp-p (Before Damage) Tolerance against 500 bits or more at Zero Substitution Pattern PRBS 2... - Page 428 Appendix A Specifications Table A.3.11-2 CRU Output Item Specifications Output Mode The signal output from CRU Output can be selected from Recovered Clock or input signal. The through output of the input signal can be output only when the input signal is Clock.
- Page 429 Sampling Oscilloscope A.3.12 26G/53G CRU (MP2110A-055) Table A.3.12-1 Optical Data Input Item Specifications Fiber Singlemode fiber Wavelength 1260 to 1620 nm NRZ, PAM4 available Data Format 51.0 to 58.0 Gbaud Operation Baud Rate 25.5 to 28.9 Gbaud Sensitivity (for 53G) TypicalOuter OMA 100 µW* Max.
- Page 430 Appendix A Specifications Table A.3.12-3 Recovered Clock Output Item Specifications Output Mode The signal output from CRU Output can be selected from Recovered Clock or input signal. The through output of the input signal can be output only when the input signal is Clock.
-
Page 431: General Performance
General Performance A.4 General Performance Table A.4-1 Functions Item Specifications LED indicator Standby, Power, Remote BERT Option Fail, Status, Output, Error Scope Option Fail, Status Function Panel lock, initialization, minimization of application window File operation Setup file save/load, result file save, screen copy, (jpg or png file format) Recovery Disk OS recovery can be executed using this disk. - Page 432 Appendix A Specifications A-36.
-
Page 433: Appendix B Initial Values
Appendix B Initial Values B.1 System Menu Table B.1-1 Initial Values of System Menu Item Initial Value Dock/Undock Dock Remote Control GPIB Address Raw Socket Port Number 5001... - Page 434 Appendix B Initial Values B.2 PPG/ED Table B.2-1 Initial Values of PPG/ED Item Initial Value Data/XData Bit Rate Standard Variable Bit Rate 25781250 kbit/s Bit Rate Offset 0 ppm PPG Amplitude 0.40 Vp-p Ext ATT 0 dB ED Input Condition Single-Ended Data Ext ATT 0 dB...
- Page 435 B.3 Scope B.3 Scope Table B.3-1 Initial Values of Result Window Item Initial Value Ch A OFF* Ch B Ch C Ch D Control Ch Graph display mode setting Overlap* Single* *1: For MP2110A-021, MP2110A-022, MP2110A-023, MP2110A-032, MP2110A-033, MP2110A-042, and MP2110A-043 *2: For MP2110A-025, MP2110A-026, MP2110A-035, MP2110A-036, MP2110A-045, and MP2110A-046, Ch A is not displayed in Version 7 or later.
- Page 436 Appendix B Initial Values Table B.3-2 Setup Dialog Box Item Initial Value General Sampling Sampling Type Sampling Mode Test Pattern Variable Number of Samples 2048 Accumulation Type Persistency Limit Type Time Time 10.0 sec Samples 10 million Waveforms 100 wfms Averaging 10 wfms Pattern...
- Page 437 B.3 Scope Table B.3-3 Measure Dialog Box Item Initial Value Amplitude/Time Display Equalizer* Display Equalized Waveform Equalizer Type TDECQ Optimization Auto Number of Precursors Tap Count 0.000000 0.000000 1.000000 0.000000 0.000000 0.000000 0.000000 0.000000 0.000000 0.000000 0.000000 0.000000 0.000000 Mask Test Mask Test Eye Mask Select Test Method...
- Page 438 Appendix B Initial Values Table B.3-4 Setup (NRZ Amplitude/Time) Dialog Box Item Initial Value Time Rise/Fall Time 20/80% Rise/Fall Time Correction Correction Factor 0.0 ps Eye Boundary Offset form Crossing 0.50 UI Width 0.20 UI SNR Definition Noise Measure Area Zero Level + One Level Table B.3-5 Setup (PAM4 Amplitude/Time) Dialog Box* Item...
- Page 439 B.3 Scope Table B.3-6 Jitter Measure Dialog Box* Item Initial Value Algorithm PDJ Measurement Standard STM-0(51.84M) PDJ Filter Measurement Edge Type Advanced TJ Measurement BER 1.00E–012 Fixed RJ RJ Value 1.00 ps rms Correction Factor DJ (Scale) 1.00 RJ (Scale) 1.00 RJ (rms) 1.00 ps rms...
- Page 440 Appendix B Initial Values Table B.3-7 Amplitude Dialog Box Item Initial Value Scale Offset Scale 100 mV/Div* (None)* Offset 0 mV* 0 W* Attenuation 0 dB Tracking* Channel Math* Define Function CH A+CH B Scale Offset 0 mV O/E* Input Connector (Wavelength) MMF 850nm* SMF 1550nm* Conversion Gain...
- Page 441 B.3 Scope Table B.3-8 Time Dialog Box Item Initial Value Rate Data Clock Rate Tracking Tracking Target Recalculate Option Clock Rate Clock Rate 6 445 313 kHz Divide Ratio Symbol Rate 25 781 250 kbaud Divide Ratio Detect Precision Trigger* Scale/Offset Unit UI On Screen...
- Page 442 Appendix B Initial Values Table B.3-9 Histogram Panel Item Initial Value Histogram Axis Amplitude 0.50 UI 1.50 UI 100 mV* 100 W* –100 mV* –100 W* *1: For MP2110A-021, MP2110A-023, MP2110A-033, and MP2110A-043 *2: For MP2110A-022, MP2110A-025, MP2110A-026, MP2110A-030, MP2110A-032, MP2110A-035, MP2110A-036, MP2110A-039, MP2110A-040, MP2110A-042, MP2110A-045, MP2110A-046, and MP2110A-049 Table B.3-10 Marker Panel...
-
Page 443: Appendix C File Specifications
Appendix C File Specifications Appendix C describes the specifications for mask files. Mask file Specifications ..........C-2... - Page 444 The mask file specifications reading with Sampling Scope is as follows. Table C.1-1 Mask File Specifications Item Specification Save folder C:\Users\Public\Documents\Anritsu\MX2 10000A\Userdata\Mask File extension The mask file is the text format file. Describe the coordinates of the mask vertices, in which the mask margins are 100% (max.), 0%, and –100% (min), in the file.
- Page 445 Mask file Specifications The following items are described in the mask file. Table C.1-2 Details of Mask File Item Parameter to be set Description Version Masks Version#1 Make sure that the version is written. Mask name Mask name Mask name displayed on the measurement screen.
- Page 446 Appendix C File Specifications >>>>>>>>>> START >>>>>>>>>> Masks Version#1 <1GFC ; 1G Optical Fibre Channel Mask (1.0625 Gbps)> Relative Mask; X_min Y_min X_max Y_max Middle X X_min Y_min X_max Y_max 0.215 0.5 0.785 0.5 Bottom X X_min Y_min X_max Y_max -0.2 -0.4 -0.2...
-
Page 447: Appendix D Performance Test Record Form
Appendix D Performance Test Record Form Document number: Test Location: Date: Test person in charge: Product name: Serial number: Software version: Option: Power voltage: Power frequency: Ambient temperature: °C Relative humidity: Instruments used: Model name Serial number Model name Serial number Model name Serial number Model name... - Page 448 Appendix D Performance Test Record Form D.1 Pulse Pattern Generator Measurement Uncertainty The measurement uncertainly is up to double the amplitude measurement accuracy of the measuring instrument. When a value of which the measurement uncertainly is added or subtracted to/from the measurement value is in the range of the specifications, the value passes.
- Page 449 Pulse Pattern Generator Table D.1-2 Pulse Pattern Generator Performance Test Record Form (Without MP2110A-093) Frequency Accuracy Set Bit Rate Minimum Value Measured Value Maximum Value Connector Pass/Fail (kbit/s) (kHz) (kHz) (kHz) Sync Out 28200000 3524964.8 3525035.2 Pass/Fail 24300000 3037469.7 3037530.3 Pass/Fail Measurement Channel PPG Waveform (Amplitude) Connector...
- Page 450 Appendix D Performance Test Record Form Table D.1-3 Pulse Pattern Generator Performance Test Record Form (With MP2110A-093) Frequency Accuracy Set Bit Rate Minimum Measured Maximum Connector Pass/Fail (kbit/s) Value (kHz) Value (kHz) Value (kHz) Sync Out 28200000 3524964.8 3525035.2 Pass/Fail 9500000 1187488.2 1187511.8...
- Page 451 Error Detector D.2 Error Detector Table D.2-1 Error Detector Performance Test Record Form (Without MP2110A-093) Measurement Channel ED Operating Frequency Minimum ER Measured Maximum Connector Set Bit Rate Pass/Fail Value Value Value Data Out 28200000 kbit/s 1E–12 Pass/Fail 24300000 kbit/s 1E–12 Pass/Fail Data...
- Page 452 Appendix D Performance Test Record Form Table D.2-1 Error Detector Performance Test Record Form (Without MP2110A-093) (Cont’d) Error Detection Minimum EC Measured Maximum Connector Set Bit Rate Pass/Fail Value Value Value Data Out 25781250 kbit/s Pass/Fail Data 25781250 kbit/s Pass/Fail...
- Page 453 Error Detector Table D.2-2 Error Detector Performance Test Record Form (With MP2110A-093) Measurement Channel ED Operating Frequency Minimum ER Measured Maximum Connector Set Bit Rate Pass/Fail Value Value Value Data Out 28200000 kbit/s 1E–12 Pass/Fail 9500000 kbit/s 1E–12 Pass/Fail Data 28200000 kbit/s 1E–12 Pass/Fail...
- Page 454 Appendix D Performance Test Record Form Table D.2-2 Error Detector Performance Test Record Form (With MP2110A-093) (Cont’d) Error Detection Minimum Maximum Connector Set Bit Rate Measured Pass/Fail Value Value Value Data Out 25781250 kbit/s Pass/Fail Data 25781250 kbit/s Pass/Fail...
- Page 455 Sampling Oscilloscope D.3 Sampling Oscilloscope Amplitude Accuracy Table D.3-1 Level Accuracy Setting Minimum Measured Maximum Connector Pass/Fail Voltage Value Value Value +200 mV +186.5 mV +213.5 mV Pass/Fail Ch A –200 mV –213.5 mV –186.5 mV Pass/Fail +200 mV +186.5 mV +213.5 mV Pass/Fail Ch B...
- Page 456 Appendix D Performance Test Record Form Table D.3-4 Accuracy of Optical Power Meter (Ch C) Average Reading of Power (dBm) Minimum Level Maximum Connector Wavelength Optical Measurement Value Difference Value Power Meter Value 850 nm 1310 nm 1550 nm Table D.3-5 Accuracy of Optical Power Meter (Ch D) Average Reading of Power (dBm)
- Page 457 Sampling Oscilloscope 26G/53G CRU (MP2110A-055) Table D.3-7 CRU Output Sensitivity Pass/Fail D-11...
- Page 458 Appendix D Performance Test Record Form D-12.
-
Page 459: Appendix E Bibliography
Appendix E Bibliography Safety of laser products. Part 1: Equipment (1) IEC60825-1 classification, requirements and user's guide Safety requirements for electrical equipment for (2) IEC61010-1 measurement, control, and laboratory use - Part 1:General requirements Fibre optic communication subsystem basic test (3) IEC61280-2-1 procedures - Part 2-1: Test procedures for digital systems - Receiver sensitivity and overload measurement... - Page 460 (29) Anritsu Corporation Measurement Environment Solutions for Eliminating ESD/EOS https://www.anritsu.com/en-US/test-measurement/support/download s/application-notes/dwl18357 (30) Anritsu Corporation Jitter Analysis - Basic Classification of Jitter Components using Sampling Scope https://www.anritsu.com/en-US/test-measurement/support/download s/application-notes/dwl009658 (31) Anritsu Corporation Measurement Intrinsic Jitter Correction for Jitter Measurements https://www.anritsu.com/en-US/test-measurement/support/download...
- Page 461 Index References are to page numbers. Symbol and Numbers Basic Procedure of Generating Pulse Signal . 5-2 Bathtub ........1-22, 6-18, 6-20 1/16 Clock Pattern ........5-11 Before Use ........... 4-13 1/2 Clock Pattern ..........5-11 BERT Panel Names ........2-7 1/2Clock ............5-16 BERTWave Types ..........
- Page 462 Index Correction Factor ..........6-41 EC ..............5-26 Correction Factor ..........6-88 ED Input Condition ........5-5 Correspondence between Mouse Operation and Elapsed Time ..........5-25 Keyboard ............ 4-5 Equalizer ..........6-36, 6-42 Crossed-out Wheeled Bin Symbol ....xii Equipment Certificate ........ix CRU .............
- Page 463 Index History Rese ..........5-25 Loading measurement conditions from file . 4-10 History Reset ..........5-6 Local/Panel Unlock ........4-12 Hit Count ............6-98 Locking the panel operation ......4-12 Hit Ratio ............6-98 Hits .............6-110 Manual Crossing ......... 6-41 Manual Notation System........II Infinite ............6-71 Marker ............
- Page 464 Index Outer Extinction Ratio .........1-37 Remote Control ..........4-15 Outer OMA ...........1-38 Repackaging ..........8-22 Overlap ............6-9 Repeat ............5-22 Replacement of Optical Connector ....8-3 Result Window........6-3, 6-14 PAM4 Amplitude/Time .........6-92 Rise Edges ........... 6-23 Panel Lock ............4-12 Rise Samples ..........
- Page 465 Index Setting Symbol Rate ........6-66 To select channel and mask ......6-95 Setting Sync Output ........5-14 To set Mask Margin and execute mask test 6-97 Setting System Menu ........4-8 To set measurement items ......6-83 Setup/Result ..........5-5 To set measurement method of rise/fall time Single .............5-22, 6-9 ..............
-
Page 466: Index
Index Index-6.
Need help?
Do you have a question about the MP2110A BERTWave and is the answer not in the manual?
Questions and answers