Table of Contents
Advertisement
Quick Links
Advertisement
Table of Contents

Summary of Contents for Sevcon Clearview
- Page 1 Clearview Display Reference Manual Document no: 177/5250x Rev. A...
- Page 2 Sevcon Limited (Head Office) Kingsway South Gateshead NE11 0QA England T: +44 (0)191 497 9000 F: +44 (0)191 482 4223 uk.info@sevcon.com Sevcon USA, Inc. 155 Northboro Road Southborough MA 01772 T: 508 281 5510 F: 508 281 5520 us.info@sevcon.com Sevcon SAS Parc d'Activité...
-
Page 3: Table Of Contents
Table of Contents Chapter 1: Introduction About Clearview Display documentation ..........1-2 This version of the manual ......................1-2 Copyright ............................1-2 Scope of this manual ........................1-2 Related documents .......................... 1-2 Drawings and units ......................... 1-2 ... - Page 4 Input voltage ........................... 4-2 Output protection ..........................4-2 CAN interface ..........................4-2 Control inputs ..........................4-2 Isolation ............................4-2 EMC ..............................4-2 Regulatory compliance ........................4-3 Mechanical ..................... 4-4 Operating environment ........................4-4 ...
- Page 5 Configuring the Available Screens ............6-3 Screen List ............................6-3 First Screen ............................. 6-4 Configuring the Main Screen..............6-5 The Screen ............................6-5 Screen Item Object Dictionary Locations ..................6-6 The Arc Graph ..........................6-10 ...
-
Page 7: Chapter 1: Introduction
Chapter 1: Introduction... -
Page 8: About Clearview Display Documentation
Tech/Ops Sevcon. Scope of this manual This manual provides information on how to use the Clearview Display, and on which Sevcon products the display is compatible with. Details of controller parameters which can be adjusted with the display are not included in this manual. -
Page 9: Warnings, Cautions And Notes
A CAUTION is an instruction that draws attention to the risk of damage to the product, process or surroundings. A NOTE indicates important information that helps you make better use of your Sevcon product. Doc. 177/5250x... -
Page 10: Product Identification Label
For technical queries and application engineering support on this or any other Sevcon product please contact your nearest Sevcon sales office listed on the inside front cover of this manual. Alternatively you can submit enquiries and find the details of the nearest support centre through the Sevcon website, www.sevcon.com. -
Page 11: Chapter 2: About The Display
Chapter 2: About the Display... -
Page 12: Introduction
Introduction The Display is a configurable CANopen display which can be set up to show a variety of data from the Sevcon motor controllers it is connected to. It can also be used to configure parameters on the controllers. It has the following features: 320x240, 256 colour display. -
Page 13: Standard Features And Capabilities
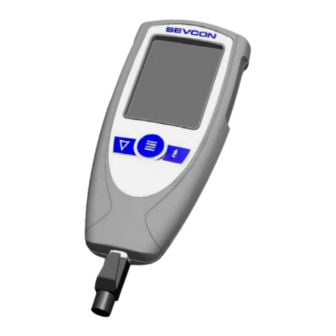
Standard features and capabilities Mechanical package Button SELEC Button DOWN Button Figure 1 Mechanical package Available accessories The following accessories are available from Sevcon: External harness to connect to system Drive Wizard – PC based configuration tool Doc. 177/5250x Rev. A... -
Page 14: Safety And Protective Functions
Safety and protective functions General Do not adjust the value of any parameter unless you fully understand the effect of this change. You should have read and understood the User Manual for all the connected devices before connecting the display to them. Do not attempt to open the display as there are no serviceable components. -
Page 15: Chapter 3: Connection
Chapter 3: Connection... -
Page 16: Connecting The Display
Connecting the Display Connector The display is supplied as standard with an 8 way Molex connector. CAN bus termination The display is designed to be permanently connected to a single or multi node CAN bus. To assist with wiring on the vehicle the display includes a CAN termination resistor which can be used as required to achieve the correct bus termination. -
Page 17: Chapter 4: Specification
Chapter 4: Specification... -
Page 18: Electrical
Electrical Input voltage Working voltage 15V to 28.8V limits: Input protection: Input protected against reverse connection of supply Maximum current draw 100mA Output protection Short-circuit: Protected against short circuit to supply CAN interface CAN protocol: CANopen profiles DS301 Physical layer uses ISO11898-2. Baud rates supported: 1Mbits/s, 500 kbits/s, 250 kbits/s, 125 kbits/s, 100 kbits/s, 50 kbits/s... -
Page 19: Regulatory Compliance
Specification EN 12895:2000, 4.2 Electrostatic Discharge Electrostatic 4 kV contact discharge discharge: 8 kV air discharge Electrical surge: EN 61000-4-5:1995, Table A.1 – Selection of Test Levels, Class Regulatory compliance Designed to meet: EN1175-1:1998 (which covers EN1726 for the controller) ISO 3691 UL583 ASME/ANSI B56.1:1993... -
Page 20: Mechanical
Mechanical Operating environment Operating temperature: -10°C to +50°C Non-operation -40°C to +85°C (can be stored for up to 12 months in this temperature: ambient range) Humidity: 95%(non-condensing) at 40°C and 3% at 40°C Ingress of dust and IP42 water: Weight Weight 0.3 kg Dimensions... -
Page 21: Chapter 5: Display Usage
Chapter 5: Display Usage... -
Page 22: Principle Of Operation
Principle of operation Functional description The Clearview Display can be used to display a variety of information about the current state of the Sevcon motor controllers to which it is connected. The information to be shown can be configured, and the screens which can be selected during normal operation can be configured. -
Page 23: Splash Screen
SDO request will be generated, and the display will only show the data that has been received in PDO messages. Please contact Sevcon for assistance with configuring RPDOs on the display. Doc. 177/5250x Rev. A... -
Page 24: Menu And Screen Changing
Menu and screen changing Figure 4 – The menu When the display has completed its power on initialisation, the first screen is shown. The first screen will be one of the screens shown below, and is configurable. To change between screens, the display has a simple menu. -
Page 25: Main Screen
Display Usage Main Screen Figure 5 – Customizable main screen An example of a main screen layout is shown in Figure 5. This screen can be configured to suit the vehicle or application with which the display is being used. The main screen is always visible in the display menu. - Page 26 Figure 6 – System Overview This screen displays information about the currently connected nodes, and the state of the nodes. The primary function is to show any active faults that are present. The screen is split into two halves: Top half shows the list of nodes that are currently connected, and if any faults are ...
-
Page 27: Vehicle Status
Where fewer motors are fitted, only data for the connected motors will be shown. Not all Sevcon controllers can measure battery voltage. If the master controller on the vehicle cannot measure battery voltage then the value displayed will be a constant value read out of that unit, probably nominal voltage. -
Page 28: Time To Distance
Time to Distance The time to distance screen is shown in Figure 8. Figure 8 – Time to Distance Screen This screen is intended to be used as a performance evaluation screen for the vehicle. It will display the time it takes to move from stationary to each of the distance markers. To use the screen: Real vehicle speed and traction drive state must be transmitted via a PDO from the ... -
Page 29: Personalities And Configuration
Display Usage Personalities and Configuration The personalities and configuration screens allow local display parameters, motor parameters, and drivability parameters to be adjusted. Figure 9 – Configuration Screen Figure 10 – Personalities Screen Items that are visible on these screens are dependent on the following: Items will only be shown if there is an associated motor controller, motor, or ... - Page 30 Figure 11 – Tree item in edit mode For a highlighted item, pressing the enter key will enter or exit edit mode. When in edit mode the value is highlighted, and can be altered using the up and down buttons. To send the new value to the controller, press the enter button, which will exit edit mode and send the value to the correct controller.
-
Page 31: Test
Display Usage Test The test screen is shown in Error! Reference source not found.. This screen is a tree format, similar to the configuration and personality screens, but the contents are read only. Figure 12 Test Screen During the power on process, the configuration of the I/O on the vehicle is determined. This means that only switch inputs configured in the PDO mappings of the vehicle will be displayed. -
Page 32: Fault History
Fault History The fault history screen is shown in Figure 13. Figure 13 Fault History Screen The fault history screen shows a chronological list of faults that have occurred on the vehicle. These are displayed with the most recent fault at the top of the list. The information shown is: ID –... -
Page 33: Debug
Display Usage The fault history can be cleared in the configuration screen. Figure 14 Fault History Help Debug The debug screen is not accessed through the menu. It is always present regardless of configuration, and enables a simple way to change the access level of the display. To access the debug menu: Bring up the menu with a long enter button press. -
Page 34: Software Update
Figure 15 Debug Screen Software Update It is possible to update the firmware of the display, using Sevcon’s DriveWizard or DVT configuration tool. Please contact Sevcon for assistance with this process. 5-14 Doc. 177/5250x Rev A... -
Page 35: Chapter 6: Configuring The Display
Chapter 6: Configuring the Display... -
Page 36: Display Can Bus Node Id
Display CAN bus Node ID. Node ID when Connected to a System The display is designed to be connected to a variety of different vehicle combinations, and does not have a fixed node id. The node id is set to be 10 greater than the highest node id that was discovered. For example, if connected to a 3 node system that has 3 motor controllers as nodes 1, 2 and 3, the display will have node id 13. -
Page 37: Configuring The Available Screens
Sub 11 Time to Distance 1 = enable, 0 = disable *The Backdoor screen is an advanced debug screen intended for Sevcon use only. This should not normally be enabled. The new selections will take effect on the next power cycle. -
Page 38: First Screen
First Screen The first screen after power on can be selected. Once the Splash screen / power on process is complete, the display will go to the chosen screen as the first screen to show. This is configured using an object dictionary item as shown below: Object Index 0x2807 Description Value... -
Page 39: Configuring The Main Screen
Configuring the Display Configuring the Main Screen. The Screen The screen on the display is 320 x 240 pixels. The co-ordinate system used to specify the location of an item on the screen is shown in the diagram below. The coordinates are (x,y) where ‘x’ is the horizontal offset from the left, and ‘y’... -
Page 40: Screen Item Object Dictionary Locations
Screen Item Object Dictionary Locations There are 10 OD entries which are for configuration of the items that can be displayed on the screen. These are at location 0x2900 to 0x2909. Each object fully defines one screen item. Each item has a set of sub-index items which are used to control the appearance of the item. The exact functionality varies depending on the type of item selected. - Page 41 Configuring the Display Sub 1 – Item Type The item type is selected according to the table below: Data Description Example Image No Item This entry is not used Ellipse graph. (Arc shaped analogue graph) Bar graph. (Rectangular analogue graph) Text Object (contents of a Data Object) Bitmap (bitmap selected from pre-compiled list)
- Page 42 Park Brake 0x2125,0 0x2125, 0 BDI Charge 0x2790,1 “%” 0x2790, 1 Left Motor RPM 0x606C,0 “RPM” SDO only Right Motor RPM 0x606C,0 “RPM” SDO only Steer Angle 0x2624,0 “˚” X364 0x2623, 0 Battery Voltage 0x5100,1 “V” SDO only Battery Current 0x5100,2 “A”...
- Page 43 Configuring the Display Right AC Motor 0x7078,0 “A” 0x2643,0 Current Vehicle Drive Mode N/A – 0x2720,6 composite* Vehicle Current N/A – 0x264F composite* *A composite item includes functionality to decode one or more sources of information into a single item that can be displayed on screen. Vehicle drive mode is composed of forwards and reverse switch data, and vehicle current is a summed total for battery current on all nodes combined.
-
Page 44: The Arc Graph
The Arc Graph The arc graph is a curved analogue graph. This is intended to show a variety of data including speed and motor RPM. The graph is constructed from the data parameters which can fully control the shape and appearance on screen. - Page 45 Configuring the Display To finally create the arc graph shape we define the start angle and end angle. The display will then create a bounding rectangle around the remaining arc, ready to be drawn onto the screen, e.g.: In this picture the blue rectangle contains the arc that will be seen on screen. The start and end angles in this case were (approximately) start at 15, and end at 165.
- Page 46 Sub 10 Data 5. Graph thickness. Sub 11 Data 6. Maximum value displayed Sub 5 – Style flags The style flags are contained within an U16 item. The flags help to define the operation of the item. The following attributes can be configured: Direction of the graph fill.
- Page 47 Configuring the Display Sub 11 – Maximum range This defines the maximum range of the graph. The operation of this depends on the signed / absolute setting: If graph setting absolute: If maximum range is less than the maximum for the referenced data object, then the maximum on screen range will be according to this item.
-
Page 48: The Bar Graph
The Bar Graph The bar graph is a rectangular analogue graph. This is intended to show a variety of data including speed and motor RPM. The graph is constructed from the data parameters which can fully control the shape and appearance on screen. - Page 49 Configuring the Display 00 = signed values 00 = fill upwards 00 = no tick marks 01 = absolute values 01 = fill downwards 01 = tick marks left or top 10 = fill to the right Sub 6 & 7 – (x,y) Size These items defines the x and y size of the outer rectangle shape used to create the frame.
-
Page 50: Data Object Text Item
Data Object Text item The text item will display the text representation of the contents of a data object. This is intended to display a typical ‘name’ ‘value’ ‘units’ text string on screen. Sub Index items The text item uses the following specific sub-items: Sub index Description type... - Page 51 Configuring the Display Sub 6 – Text font The text font can be selected from the following options (not all text characters are available in all fonts): Sub 6 value Font Arial 8pt Arial 8pt bold Arial 10pt Arial 10pt bold Arial 11pt Arial 11pt bold Arial 72pt...
-
Page 52: Bitmap Item
Bitmap item This item will display bitmaps that are pre-compiled into the code. It is not possible to upload bitmaps to the display. The bitmap can be controlled with an associated DO, so that up to 3 bitmaps can be selected in the screen item, with the bitmap displayed dependent on the value in the data object. - Page 53 Sub 10 = Bitmap 3. The supported bitmaps are: Bitmap number Description Image None No Bitmap Sevcon Small Logo Down Arrow (chevron) Up Arrow (chevron) Park Brake Active Fault Letter F Letter R Letter N ‘D’ highlighted in DNR set ‘N’...
- Page 54 Warning level fault icon Inhibit level fault icon Severe level fault icon If you require different bitmapsfor your application then contact your local Sevcon representative. Sub 7, 9, and 11 – Reference value When displaying multiple bitmaps, reference values are used in conjunction with the bitmap display logic.
-
Page 55: Time And Date Item
Configuring the Display Time and Date item The screen item will display the text representation of the current time and date. Sub items The text item uses the following specific sub-items: Sub index Description type Sub 5 Style flags. Control specific appearance settings. Sub 6 Data 1. -
Page 57: Chapter 7: Local Display Settings
Chapter 7: Local Display Settings... -
Page 58: Display Parameters
Display Parameters The display has a number of user configurable settings which can be used to change the regional settings, time, date, units format, etc. Clock Settings The display has a built in clock which is used to time stamp incoming fault events, and can be displayed on the screen. -
Page 59: Metric Or Imperial Units
Local Display Settings Metric or Imperial Units The display can automatically rescale some items on the screen to reflect metric or imperial units. This is selected using the “Units Format” item, located on the Configuration Screen under “Display” This will change between the following units: Speed in km/h or mph. -
Page 60: Fault Log
Fault log The fault log can be cleared at any time by using the “Display – Fault Log – Reset Fault Log” parameter in the Configuration screen. Doc. 177/5250x Rev A... -
Page 61: Chapter 8: Local Canbus Settings
Chapter 8: Local CANbus Settings... -
Page 62: Canbus Parameters
System Information The first time the display is powered on, and detects some connected Sevcon nodes it will interrogate the nodes to determine the system configuration. This “system info” is then stored in the display so that on subsequent power cycles it can start up more quickly. - Page 63 Local CAN Bus Settings The stored information can be cleared using the “CANbus-Clear System Info” parameter. Setting this item to ‘yes’ will cause the stored information to be erased. On the next power cycle the information will be re-acquired and stored. The System configuration is determined from the VPDO and PDO settings that have been configured on the controllers on the vehicle.
-
Page 65: Chapter 9: Example Screen Layout
Chapter 9: Example Screen Layout... -
Page 66: Example Layout
Example Layout The Screen layout described in this section is intended to demonstrate the setup of each screen item that can be used on the main screen. This is the same layout as provided in the generic supplied display. Doc. 177/5250x Rev A... -
Page 67: The Layout - Bitmaps
Example Screen Layout The layout – bitmaps Bitmap Sevcon Logo. Object 0x2906 Value Sub 1 Sub 2 Sub 3 Sub 4 Sub 5 0x0004 Sub 6 Sub 7 Sub 8 Sub 9 Sub 10 Sub 11 Sub 1 (4) for a btimap, located at (x,y) location of (sub2,sub3). -
Page 68: The Layout - Arc Graph And Bar Graph
The layout – Arc Graph and Bar Graph Arc graph showing vehicle speed Object 0x2900 Value Sub 1 Sub 2 Sub 3 Sub 4 Sub 5 0x0001 Sub 6 Sub 7 Sub 8 Sub 9 Sub 10 Sub 11 Sub 1 (1) for an arc graph, located at (x,y) location of (10,105). -
Page 69: The Layout - Text Items
Example Screen Layout The layout – Text items Text showing trip distance Object 0x2908 Value Sub 1 Sub 2 Sub 3 Sub 4 Sub 5 0x0007 Sub 6 Sub 7 Sub 8 Sub 9 Sub 10 Sub 11 Text showing vehicle current Sub 1 (3) for a text item, located at (x,y) Object 0x2902 Value... -
Page 70: The Layout - Date And Time
The layout – Date and Time Date and Time item Object 0x2907 Value Sub 1 Sub 2 Sub 3 Sub 4 Sub 5 0x0000 Sub 6 Sub 7 Sub 8 Sub 9 Sub 10 Sub 11 Sub 1 (5) for a time and date item, located at (x,y) location of (100,85).
Need help?
Do you have a question about the Clearview and is the answer not in the manual?
Questions and answers