Table of Contents
Advertisement
Quick Links
Phytoplankton Analyzer
PHYTO-PAM-II
and
Phyto-Win 3
Software V 3
Principles of Operation
2nd Edition: Nov 2016
PhytoPamII_2.doc
Heinz Walz GmbH, 2016
Heinz Walz GmbH Eichenring 6 91090 Effeltrich Germany
Phone +49-(0)9133/7765-0 Telefax +49-(0)9133/5395
Email info@walz.com Internet www.walz.com
Printed in Germany
Advertisement
Table of Contents

Related Manuals for Walz PHYTO-PAM-II


Summary of Contents for Walz PHYTO-PAM-II
- Page 1 Software V 3 Principles of Operation 2nd Edition: Nov 2016 PhytoPamII_2.doc Heinz Walz GmbH, 2016 Heinz Walz GmbH Eichenring 6 91090 Effeltrich Germany Phone +49-(0)9133/7765-0 Telefax +49-(0)9133/5395 Email info@walz.com Internet www.walz.com Printed in Germany...
-
Page 3: Table Of Contents
2.1.2 Stirring Device WATER-S (optional) ........9 2.1.3 Battery Charger MINI-PAM/L ..........10 3 PhytoWin Software installation and Phyto-PAM-II setup ..11 3.1 Measure PAR Lists ..............13 4 First fluorescence measurements ..........16 4.1 Principle of distinguishing between different groups of phytoplankton ................ - Page 4 Editing Tools ..............92 6.13.3 List of Script File Commands ......... 93 7 Technical Specifications ............101 7.1.1 PHYTO-PAM-II Compact Version ........101 7.1.2 System Control and Data Acquisition ........ 102 7.1.3 Battery Charger MINI-PAM/L .......... 103 7.1.4 Spherical Micro Quantum Sensor US-SQS/WB ....
- Page 5 MAY 2002 CONTENTS 11.1 Conditions ................115 11.2 Instructions ................. 116 ...
-
Page 7: 1 Safety Instructions
CHAPTER 1MAY 2002 SAFETY INSTRUCTIONS Safety instructions General safety instructions Read the safety instructions and the operating instructions first. Pay attention to all the safety warnings. Keep the device away from water or high moisture areas. Keep the device away from dust, sand and dirt. Always ensure there is sufficient ventilation. -
Page 8: Special Safety Instructions
PHYTO-PAM-II employs high intensity LED-array light sources which may cause damage to the eye. Avoid looking directly into these light sources during continuous illumination or saturation pulses. -
Page 9: 2 Phyto-Pam-Ii
But for the first time these spectra are not instrument specific but universal. Due to spectral calibration of PHYTO-PAM-II instruments reference spectra can be shared between users and instruments. The PHYTO-PAM-II user surface is based on the proven PhytoWin- software featuring classical PAM analysis like the estimation of the effective... - Page 10 Two versions of the PHYTO-PAM-II Phytoplankton Analyzer are available. A PHYTO-PAM-II Compact Version with integrated emitter-detector unit and a Modular PHYTO-PAM-II Version featuring different emitter-detector units connectable to a Power-and- Control-Unit. Both versions of the PHYTO-PAM-II are operated by PhytoWin-3 software.
-
Page 11: Compact Version
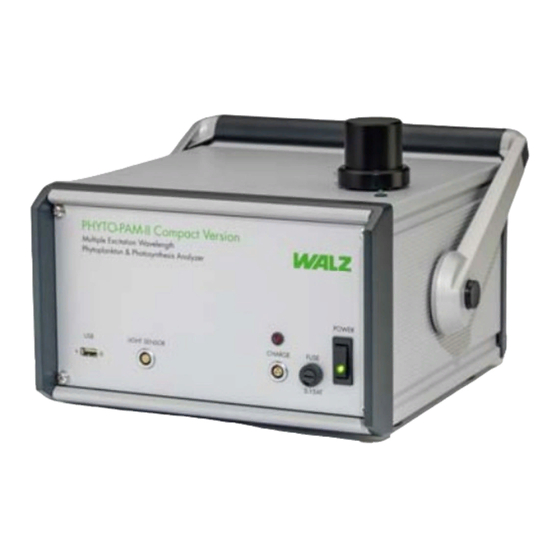
CHAPTER 2 PHYTO-PAM-II Compact Version The PHYTO-PAM-II Compact Version is a lightweight and easily portable instrument. The splash-proof cast aluminium housing incorporates the control unit as well as all essentials of the emitter- detector unit: the optical unit, the measuring and actinic LED-array, the photomultiplier-detector and the cuvette retainer. - Page 12 (red status LED on housing lights up). COB LED-Array The light emitting diodes (LED) are densely arranged on a 10 x 10 mm area. PHYTO-PAM-II provides 5 differently coloured measuring lights (440 nm, 480 nm, 540 nm, 590 nm, 625 nm), and 5 actinic light...
- Page 13 Fig. 2). To compensate for varying brightness of the different types of light emission diodes, more LEDs are used when the intensity of the individual LED is lower. Fig. 2: Typical normalized emission spectra of PHYTO-PAM-II light sources. Spectra are not corrected for spectral response of the spectrometer.
-
Page 14: Spherical Micro Quantum Sensor Us-Sqs/Wb
The Spherical Micro Quantum Sensor US-SQS/WB is included in the system package as calibration of the PAR-List is essential for correct assessment of all PHYTO-PAM-II functions. The US-SQS/WB device consists of a submersible spherical quantum sensor, US-SQS/L, and a small amplifier unit which is connected to the light sensor socket. -
Page 15: Stirring Device Water-S (Optional)
If needed the diffuser can be gently cleaned by using a cotton tip applicator moistened with some ethanol. The position of the light sensor is adjustable and will be determined for PHYTO-PAM-II applications by a 15.3 mm spacer above the sensor hood. 2.1.2 Stirring Device WATER-S (optional) Fig. -
Page 16: Battery Charger Mini-Pam/L
2.1.3 Battery Charger MINI-PAM/L The Battery Charger MINI-PAM/L is provided for recharging the internal lead-acid battery (12V/2Ah) of PHYTO-PAM-II. It is connected to the Charge-socket on the front panel of the Power- and-Control-Unit. The charger, which operates at input voltages between 100 and 240V AC, features overload protection. -
Page 17: 3 Phytowin Software Installation And Phyto-Pam-Ii Setup
PhytoWin-3 program needs be installed on the PC going to be used in conjunction with the PHYTO-PAM-II. At the end of the guided installation procedure a Phyto-PAM_3 folder is created on the PC with Data-directories of three different types of Phyto-PAM Measuring Heads (Phyto US, Phyto ED and Phyto Compact Unit). - Page 18 The Start-window is displayed, showing the number of the current PhytoWin version. Following query appears: to search for Com-Port and enter Measure Mode to view and analyse data acquired by the PHYTO-PAM-II and start the program in the viewing mode. to quit the program.
-
Page 19: Measure Par Lists
Exceptions are indicated. Measure PAR Lists To bring the PHYTO-PAM-II to operation first time the LED array light parameters (PAR lists) need to be calibrated. The light list measurements include calibration of the light sensor offset and... - Page 20 Switch on PHYTO-PAM-II and start PhytoWin-3 software. Please plug in the Spherical Micro Quantum Sensor US-SQS/WB to the PHYTO-PAM-II light sensor connector, the light sensor will be recognized and the Measure PAR Lists button in the Settings Window enabled.
- Page 21 CHAPTER 3 INSTALLATION The light sensor offset and all LED array parameters will be calibrated. When the Measure PAR List routine is finished a .par file will be stored within the Data-directories of the related measuring head folder. Disconnect light sensor.
-
Page 22: 4 First Fluorescence Measurements
Channels-Window The 5-channels excitation mode is the standard mode of operation of the PHYTO-PAM-II. After start of the program, on the PC monitor screen the "Channels"-window is displayed. This shows the current Chl fluorescence yield, Ft, measured continuously with 5 different excitation wavelengths. - Page 23 CHAPTER 4 FIRST MEASUREMENTS same time the ML at high frequency contributes to overall actinic intensity, which is displayed in the PAR-field in units of µmol quanta m (photosynthetically active radiation). A third type of illumination is triggered by the "Sat-Pulse" button. But, please avoid looking directly into the LED-array source, as this light is very strong and may harm your eyes.
- Page 24 CHAPTER 4 FIRST MEASUREMENTS Zero-offset function (Zoff). But, please note that it will always cause a decrease in the signal/noise ratio. In practice, natural surface waters often contain (besides phytoplankton) other fluorescing substances (like humic acids) in solution. In order to get rid of this contribution, together with the small background signal caused by system fluorescence, it is recommended to proceed as follows: ...
- Page 25 CHAPTER 4 FIRST MEASUREMENTS After Zoff-determination the filtrate is substituted by the sample and now the proper fluorescence measurements can start, as the fluorescence yields displayed for the 5 channels now are only due to the phytoplankton. The most fundamental measurement is the assessment of the quantum yield of photochemical energy conversion in PSII by application of a saturation pulse.
- Page 26 CHAPTER 4 FIRST MEASUREMENTS photosynthetically active radiation (PAR) provides a relative measure of electron transport rate (ETR). Plots of quantum yield and ETR versus PAR (so-called light response curves) give valuable information on the photosynthetic performance and light saturation characteristics of a sample. The PhytoWin-program provides a routine for automated recording of light response curves.
-
Page 27: Principle Of Distinguishing Between Different Groups Of Phytoplankton
PHYTO-PAM-II features now a new spectral composition using five excitation wavelengths that are chosen for optimal differentiation between cyanobacteria, green algae, diatoms/dinoflagellates and phycoerythrin-containing organisms, which differ substantially in the absorbance spectra of their antenna pigments. - Page 28 CHAPTER 4 FIRST MEASUREMENTS investigated water sample. In this sense, the success of practical applications to a considerable extent depends on close interaction with basic research, not only using Chlorophyll fluorescence, but also alternative methods, like microscopy, flow cytometry and analysis by HPLC.
-
Page 29: 5 Saturation Pulse Analysis
CHAPTER 5 SATURATION PULSE ANALYSIS Saturation Pulse Analysis Typically, five different types of fluorescence levels are acquired by Saturation Pulse analyses named Fo, Fm Fo’ Fm’ and F. In most cases, the PAM fluorescence signal is proportionally related the yield for chlorophyll fluorescence. -
Page 30: Measurements With Illuminated Samples
CHAPTER 5 SATURATION PULSE ANALYSIS Fig. 6: Measurements for Saturation Pulse Analysis. AL, Actinic Light; D, dark; SP, Saturation Pulse; FR, Far-red illumination. Measurements with Illuminated Samples Fo’ Minimum fluorescence level of illuminated sample which is lowered with respect to Fo by non-photochemical quenching. -
Page 31: Fluorescence Ratio Parameters
CHAPTER 5 SATURATION PULSE ANALYSIS can be estimated according to Oxborough and Baker (1997): Fm’ Maximum fluorescence level of illuminated sample as induced by a Saturation Pulse which temporarily closes all PS II reactions centers. Fm' is decreased with respect to Fm by non-photochemical quenching. - Page 32 CHAPTER 5 SATURATION PULSE ANALYSIS Table 1: Fluorescence Ratio Parameters. Source Equation Maximum photochemical quantum yield of PS II (Kitajima and Butler, 1975) Effective photochemical quantum yield of PS II ) II (Genty et al., 1989) Quantum yield of light-induced (ΔpH- and ...
- Page 33 CHAPTER 5 SATURATION PULSE ANALYSIS In algae and cyanobacteria, the dark-acclimated state often is not showing maximal PS II quantum yield, as the PS II acceptor pool may be reduced in the dark by stromal reductants and consequently the so-called state 2 is formed exhibiting low PS II quantum yield. In this case, preillumination with moderate far-red light should precede determinations of Fo and Fm.
- Page 34 CHAPTER 5 SATURATION PULSE ANALYSIS and NPQ Parameters of non-photochemical quenching Both parameters are associated with non-photochemical quenching of excitation energy, mainly involving a low thylakoid lumen pH- and a zeaxanthin-dependent quenching mechanism. In contrast to Y(II), qP and qL, calculations of the qN and the NPQ parameters always require fluorescence measurements with the sample both in the dark-acclimated and in the light-exposed states (see Table 1, page 26).
- Page 35 CHAPTER 5 SATURATION PULSE ANALYSIS Y(II) + Y(NPQ) + Y(NO) = 1 This concept of "complementary PS II quantum yields" is useful to analyze the partitioning of absorbed light energy in photosynthetic organisms. For instance, under high light-conditions, a much higher Y(NPQ) than Y(NO) indicates that excess excitation energy is safely dissipated at the antenna level, that is, photosynthetic energy fluxes are well-regulated.
-
Page 36: 6 Features Of Phytowin Software
CHAPTER 6 FEATURES OF THE SOFTWARE PHYTOWIN Features of PhytoWin Software Operation of the PHYTO-PAM-II Phytoplankton Analyzer is based on the PhytoWin-Software in conjunction with a Pentium PC. Installation of the software was described in chapter 3 and some first, basic measurements using this software were already described in chapter 4. - Page 37 CHAPTER 6 FEATURES OF THE SOFTWARE PHYTOWIN Channels: Original, unbiased fluorescence information at 5 different excitation wavelengths Settings: Controls for instrument settings, like measuring pulse frequency, actinic intensity, saturation pulse width and intensity, clock interval, number of averages, etc. ...
- Page 38 CHAPTER 6 FEATURES OF THE SOFTWARE PHYTOWIN for system operation and display of instrument status are located. These elements always accessible, independently of the selected window. For handling of the PhytoWin-Software the standard Windows-rules apply. For all possible operations "Tooltips" are provided which are displayed whenever the cursor is moved into the vicinity of the corresponding switch or button.
-
Page 39: Elements For System Operation And Display Of Instrument Status33
CHAPTER 6.1 ELEMENTS FOR SYSTEM OPERATION Elements for system operation and display of instrument status The elements for system operation and display of instrument status are always available in MEASURE mode and independent of the displayed window. Fig. 8 User surface of PhytoWin-Software elements for system operation and display of instrument status Fig. - Page 40 CHAPTER 6.1 ELEMENTS FOR SYSTEM OPERATION Display of current value of incident photosynthetically active radiation (quantum flux density) within the cuvette in units of µmol quanta m . The displayed values are either derived from an internal PAR-list or measured on-line with the help of the Spherical Micro Quantum Sensor (see 0).
- Page 41 CHAPTER 6.1 ELEMENTS FOR SYSTEM OPERATION SAT-Pulse = Yield-determination by a single saturation pulse. This measurement involves assessment of the fluorescence yield briefly before the saturation pulse, F, and of the maximal fluorescence yield, Fm’. While the Ft-values are continuously changing and not stored, the F- and Fm’-values are saved in the Report-file.
- Page 42 CHAPTER 6.1 ELEMENTS FOR SYSTEM OPERATION Start-button for Chlorophyll a content determination based on fluorescence yield. Please note: the measured apparent chlorophyll fluorescence is dependent on measuring light frequency and needs to be done at the measuring light frequency chosen for chlorophyll calibration during reference recording.
- Page 43 Gain-setting is adjusted to a value which is suitable for measurements with a given sample (Auto-Gain function). The gain steps are optimized to the extended dynamic range of the PHYTO-PAM-II photomultiplier and comprises 30 gain settings. The extended dynamic range distributes to the higher sensitivity of PHYTO-PAM-II.
- Page 44 CHAPTER 6.1 ELEMENTS FOR SYSTEM OPERATION Photomultiplier activation button. The indicator lamp lights up green indicating an active photomultiplier or red if photomultiplier is switched off. Remaining illumination time during the course of an actinic illumination period. The actinic illumination period is defined on the Settings-window (Act.
-
Page 45: Channels-Window
CHAPTER 6.2 CHANNELS WINDOW Channels-window The channels-window represents one out of nine windows which can be selected for different modes of signal display and analysis, as well as for definition of instrument settings. The channels window displays the original, non-deconvoluted fluorescence information at 5 excitation wavelengths. -
Page 46: Zero Offset And Noise N(T)
CHAPTER 6.2 CHANNELS WINDOW channels. These values resemble the last stored values in the Report window (see chapter 6.7). Also the dark adapted yield values of all five excitation channels are displayed as Fv/Fm. If no measurement is taken the corresponding value fields are crossed out 6.2.2 Zero Offset and noise N(t) At low chlorophyll content, when high Gain is required,... - Page 47 CHAPTER 6.2 CHANNELS WINDOW As an alternative to the display of the Zoff values, also momentary noise, N(F), individual fluorescence channels can be shown. For display of N(F), please click on N(F) in the selection box. When the noise caused Fehler! Textmarke nicht definiert.by an external disturbance has settled down, the indicator LED (below PAR-box) gives green light for carrying out a measurement (e.g.
-
Page 48: Algae-Window
CHAPTER 6.3 ALGAE WINDOW Algae-window The Algae-window shows the deconvoluted fluorescence information for cyanobacteria, green algae, diatoms/dinoflagellates and PE-Type organisms (phycoerythrin-containing organisms e.g. cryptophytes). The deconvolution is based on Reference Excitation Spectra (see chapter 6.8) that were previously measured. Fig. 10 Algae-window displaying deconvoluted fluorescence information after application of a saturation pulse In analogy to the Channels-window, the deconvoluted fluorescence parameters Ft, F, Fm’, Fm’-F, Y(II) and Fv/Fm are displayed. - Page 49 CHAPTER 6.3 ALGAE WINDOW allows the user to define maximal signal range for display at different sensitivities. The F-bar shows the current fluorescence yield (Ft) in the Measure- mode. In the View-mode the F-value sampled in conjunction with the corresponding saturation pulse is displayed. The Ft-values, as well as the corresponding indicator-bars, reflect the online measured deconvoluted contributions of the four types of phytoplankton to the overall fluorescence signal (i.e.
-
Page 50: Settings-Window
Settings-window In the settings-window instrument settings are accessible for manual adjustment. Fig. 11 Settings-window PHYTO-PAM-II Modular Version This button opens up a prompt for light list calibration. This routine includes calibration of the light sensor offset and determination of all important characteristics of the LED array. - Page 51 CHAPTER 6.4 SETTINGS WINDOW Measuring Light intensity: The measuring light intensity can be set to High ML or Low ML intensity by the pulldown menu. High light measuring light intensities are required for deconvolution. Measuring Light Frequency: Meas. Freq. gives the pulse frequency of the measuring light in relative units.
- Page 52 CHAPTER 6.4 SETTINGS WINDOW Dial-boxes for Intensity and Width. A total of 20 intensity settings are provided. When Width is set to 0 (default-setting), the actinic illumination period is infinite and must be manually terminated using the AL-button in the elements for system operation bar at the bottom left.
- Page 53 CHAPTER 6.4 SETTINGS WINDOW Display of present voltage of Power-and-Control-Unit internal battery. When voltage drops below 11 V and the blue indicator-bar disappears, the battery is almost empty and needs to be charged via the provided battery charger. There will be a warning: "Attention low battery! Please connect battery charger."...
- Page 54 CHAPTER 6.4 SETTINGS WINDOW fast. As Fm is determined from the average of data points at the end of the saturation pulse, this may lead to underestimation of Fm, dF and Yield. The "View Pulse" function allows to examine the fluorescence rise kinetics during a saturation pulse.
-
Page 55: Slow Kinetics Window
CHAPTER 6.5 SLOW KINETICS WINDOW Slow Kinetics window The Slow Kinetics window graphically displays all data measured by saturation pulse analysis. In addition by activation via start the slow kinetic window provides online recording of current Ft values. Fig. 13: Slow Kinetics window Clicking the Start button initiantes a new record and starts recording of current Ft values. - Page 56 CHAPTER 6.5 SLOW KINETICS WINDOW It is possible to display either the Channels-data or the deconvoluted Algae-data by selection via the corresponding radio buttons. On/Off switch for grid display Prints a black/white copy of the graph for documentation Autoscale option to display the complete graph Courser position: left box displays x-axis value, right box displays y-axis value.
-
Page 57: Light Curve Window
CHAPTER 6.6 LIGHT CURVE WINDOW Light Curve window Light curves give information on the light adaptation state and photosynthetic capacity of a sample. With increasing quantum flux density the effective quantum yield of PSII decreases, as PSII reaction centers progressively close and an increasing amount of energy is dissipated into heat. - Page 58 CHAPTER 6.6 LIGHT CURVE WINDOW It is possible to display either the Light Curves of the Channels-data (Yield and ETR measured with five different excitation wavelengths) or the Algae-data (Yield and ETR of four different pigment types of phytoplankton, deconvoluted using Reference Spectra for Blue, Green, Brown and PE-type Algae).
-
Page 59: Edit Light Curves
CHAPTER 6.6 LIGHT CURVE WINDOW is shown as Next: or in the AL Time-box in the elements for system operation bar on the right hand side. Light Curves can be auto scaled by clicking the autoscale- icon. A Print-icon is provided for print-out of Light Curves via a serial printer (please define printer settings in the main menu). - Page 60 CHAPTER 6.6 LIGHT CURVE WINDOW Fig. 15 Edit-window for definition of Light Curve parameters For changing the Intensity-setting or Time (in units of 10 s) of a particular step, the corresponding fields first have to be marked by cursor/mouse click and then the desired setting can be typed in. Steps It is recommended to select progressively increasing PAR-values, with the highest value being at least two times higher than the PAR at...
- Page 61 CHAPTER 6.6 LIGHT CURVE WINDOW Intensity One can choose between 20 intensity settings of actinic light and 8 frequency settings of the measuring light (MF1, MF2, MF4, MF8, MF16, MF32, MF64 and MF128), which at higher frequencies has a distinct actinic effect. The latter is relevant for assessment of the early part of the light curve, where only a small decrease of Yield occurs (or even a rise in some types of phytoplankton) and ETR increases almost linearly with PAR.
-
Page 62: Light Curve Fit-Parameters
CHAPTER 6.6 LIGHT CURVE WINDOW Light Curve recordings may be started repetitively with the help of the Clock-function (see 6.1). In this way, changes in the light adaptation state and the physiological health of a sample can be followed over longer periods of time. The Light Curve Parameters can be saved in lcp- files and reinstalled at any time by opening the corresponding file. - Page 63 CHAPTER 6.6 LIGHT CURVE WINDOW Rapid light curves plotting ETR/Yield versus PAR are often described by the following three cardinal points. α (alpha), electrons/photons: Initial slope of RLC which is related to quantum efficiency of photosynthesis. , µmol electrons/(m · s): Maximum electron transport rate. IK, µmol photons/(m ·...
- Page 64 CHAPTER 6.6 LIGHT CURVE WINDOW Param eter α 1·10-5 1·1 1·10-6 1·1 1·10-7 1·1 Fig. 16: Exemplary Light Curves.
- Page 65 CHAPTER 6.6 LIGHT CURVE WINDOW Also, the Platt et al. (1980) model considers photoinhibition but their equation is not based on mechanistic considerations but on the empirical finding the many light response curves can be described by the product of 2 exponentials: ...
- Page 66 CHAPTER 6.6 LIGHT CURVE WINDOW The Fit button starts an iterative process during which the free parameters of the selected model equations (EP or Platt et al.) are varied until the best fit between theory and experiment is obtained. The fitted curves are displayed as continuous lines superimposed on the data points of the Yield- and ETR-Light Curves.
- Page 67 CHAPTER 6.6 LIGHT CURVE WINDOW points in the rising part of the Yield Light Curve, including the peak value. A speed-button is provided for opening a window listing the Light Curve Fit Parameters for Ch1-Ch5 and for the deconvoluted types of phytoplankton (Blue, Green, Brown and PE- Type).
-
Page 68: Comments On Light Curves
CHAPTER 6.6 LIGHT CURVE WINDOW Fig. 17 Light Curve Fit Parameters The quality of Light Curves for Blue, Green, Brown and PE-type, just like the deconvoluted values for fluorescence yield of Blue, Green, Brown and PE-type (see section 6.3), strongly depends on proper choice of Reference Spectra (see 6.7). - Page 69 CHAPTER 6.6 LIGHT CURVE WINDOW quantum yield (so-called state 2). In this case, maximal PS II quantum yield is induced at moderate light intensities. Despite similarity of Rapid Light Curves with classical light response curves (P-I curves), there are also some basic differences, which should be kept in mind when evaluating Light Curves.
-
Page 70: Report Window
A report and its associated records are automatically saved to the Report folder of the corresponding PHYTO-PAM-II measuring head. (e.g. C:\PhytoPam_DSP\ Data_CU6\Report). In Measure Mode only the last Record can be analysed. In View mode all Report/Record files are available for analysis. - Page 71 CHAPTER 6.7 REPORT WINDOW Record: A new record can be manually defined with the help of the New Record button on the right-hand side of the elements for operation bar. A Light Curve or Slow Kinetics recording automatically start a new record.
- Page 72 CHAPTER 6.7 REPORT WINDOW The Record view (View Rec) provides detailed information on an individual experiment for the last record or in View Mode for all records. Minimum number of column headlines in the data field is 6 (Date, Time, No.,Temp, ML, PAR). Columns for Fo´ fluorescence and fluorescence ratio parameters can be added by selecting the item on the side bar by ticking checkmarks in “Select Column”.
- Page 73 CHAPTER 6.7 REPORT WINDOW export. The Report-file can be printed out, given that a suitable serial printer is connected and has been defined by the Printer Setup routine. Export Record button exports the selected record file as .csv file to the Export Folder of the corresponding measuring head. All values ticked with checkmarks in “Select Column”...
-
Page 74: Reference-Window Deconvolution And Chlorophyll Determination Calibration Values
PHYTOWIN REFERENCE WINDOW Reference-window deconvolution and Chlorophyll determination calibration values The primary signals measured by the PHYTO-PAM-II are five different fluorescence signals obtained by excitation of the sample with five measuring light beams at five different wavelengths (440, 480, 540, 590 and 625 nm). For the sake of deconvolution, the five... - Page 75 CHAPTER 6.8 REFERENCE WINDOW Additionally PHYTO-PAM-II references provide information about chlorophyll content biased on fluorescence yield. Therefor each reference spectrum includes chlorophyll calibration data which can be set during reference generation (see 6.8.1). All Reference information are stored in Ref6-files.
- Page 76 CHAPTER 4.8 PHYTOWIN REFERENCE WINDOW activated, the spectrum of a particular Reference is used for deconvolution. If it is known, that a given sample does not contain substantial amounts of a particular type of phytoplankton (e.g. green algae in certain ocean waters), deconvolution of the other types of phytoplankton will be improved by deactivating the corresponding Reference.
- Page 77 Data-directory of the applied measuring head. Also references measured by other instruments can be copied to the Data-directory of the applied measuring head. Loaded references are normalized in respect to the spectral composition of the PHYTO-PAM-II instrument.
-
Page 78: How To Generate Reference Spectra
CHAPTER 4.8 PHYTOWIN REFERENCE WINDOW 6.8.1 How to generate Reference Spectra The quality of deconvolution bases on the quality of the applied reference spectra. Reference spectra are generated from pure cultures samples of algae. Data can be recalculated with new reference spectra at any time. - Page 79 CHAPTER 6.8 REFERENCE WINDOW A prompt to set chlorophyll concentration appears. chlorophyll concentration predefined to 100 µg/l. The exact chlorophyll concentration chlorophyll calibration can be edited manually e.g. after standard chlorophyll determination. Finalize the reference spectrum by saving. To edit the chlorophyll calibration implemented in the reference spectrum please open the reference spectrum file in a text editor program.
-
Page 80: Fluo Spec -Window
CHAPTER 4.8 PHYTOWIN REFERENCE WINDOW Fluo Spec -window PHYTO-PAM-II References are universal. The Fluo Spec Window shows the rawdata of the reference spectra and some of the spectral information used for normalization. Fig. 21: Fluo Spec window displaying rawdata of universal Reference... -
Page 81: Fast Kinetik - Window
CHAPTER 6.10 FAST KINETICS WINDOW Fast Kinetik - window 6.10 The fast kinetic window is provides analysis of the wavelength dependend O-I fluorescence rise kinetics upon onset of pulses of strong actinic light. The obtained data can be fitted in the O-I fitting window (chapter 6.10.1) for evaluation of the functional optical cross-section of PS II, Sigma(II). - Page 82 CHAPTER 6.10 FAST KINETICS WINDOW fast kinetic light flashes and records the resulting fluorescence kinetics. When ST is checked, all actinic LEDs contribute to a single turnover flash which then is particularly strong. Selection of a color for measuring light automatically sets actinic light to the same color.
-
Page 83: O-I Fit Window
CHAPTER 6.10 FAST KINETICS WINDOW Displays the values for Fo and I of the displayed Fast Kinetics recording Pulldown menu to select a fast kinetic file for graphical display The Calc button provides access to the O-I window 6.10.1 Fit window The O-I Fit window serves for analysis of the O-I rise kinetics by a... - Page 84 CHAPTER 6.10 FAST KINETICS WINDOW The immediate result of an O-I Fit is information on the time constant of the fluorescence rise. With information on the incident PAR driving this rise (saved in the PAR Lists), the functional absorption cross-section of PS II is calculated by the program. Knowledge of Sigma(II) permits transformation of incident PAR (in µmol quanta ·...
- Page 85 CHAPTER 6.10 FAST KINETICS WINDOW analyzed by curve fitting. To this end, the kinetics of interest have to be marked in the data list of the O-I fit window. Thereafter, the field “Common” is available. A parameter selected in the Common box will be identical for all marked curves.
- Page 86 CHAPTER 6.10 FAST KINETICS WINDOW Reoxidation of QA- formed during the O-I rise is taken into account. “With reoxidation” should be disabled if QA- reoxidation cannot occur, e.g. in presence of the PS II inhibitor DCMU. 1. reox Tau (ms) = Time constant of QA- reoxidation by QB (first QA reoxidation time constant).
-
Page 87: Parameters And Output Of Fo-I 1 Rise Analysis
CHAPTER 6.10 FAST KINETICS WINDOW 6.10.2 Parameters and Output of Fo-I Rise Analysis Table 3: Adopted from: Schreiber et al. (2012) Photosynth Res 113: 127-144 Parameters Definition Free model parameters Unit: dimensionless Sigmoidicity parameter. J = p/(1-p), p is Joliot’s connectivity parameter describing excitation energy flux from a PS II to neighboring PS II. -
Page 88: View - Mode
MEASURE-mode and the VIEW-mode. While the MEASURE-mode requires connection of the PC with the turned-on PHYTO-PAM-II, for the VIEW-mode only the PC is required. The MEASURE-mode is for data generation, the VIEW mode for Data inspection, recalculation or export. - Page 89 CHAPTER 6.11 VIEW MODE The opened Report-file is displayed on the Report- window. The Report is organized into Records, defined by Date and Time, referring to the moment at which a particular Record was started in the MEASURE-mode. The arrows allow to jump to the first or the last Record and to move forward and backwards by single steps in the Records.
- Page 90 CHAPTER 4.11 PHYTO WIN VIEW MODE "Lines" which relate either to a measurement involving the application of a saturation pulse or Chl determination is listed. After selection of a particular Record, the data of the corresponding measurement are selected to be viewed and analysed in detail on the various display windows (Channels, Algae, Slow Kinetics, Report, Light Curve, Reference, Fluo Spec or Fast Kinetics).
-
Page 91: Main Menu Bar
CHAPTER 6.12 MAIN MENU Main Menu Bar 6.12 The Main Menu Bar contains pull down menus for File, Window, Options and Help. File Window Options Help Open Report Channels Tooltips L Curve Details Export Report Settings Info L Curve Fit Parameters Print Report Algae Hotkeys... - Page 92 CHAPTER 6.12 MAIN MENU Options: L Curve Details to select graphical display of light curves. Enables grid (Grid) or (Join) joining of data points with line segments. L Curve Parameter opens the light curve Fit Parameter Window displaying the fit parameter α, ETRmax and IK of the Eilers and Peeters or Platt et al model fit.
-
Page 93: Options: Etr Parameter
CHAPTER 6.12 MAIN MENU 6.12.1 Options: ETR Parameter Relative ETR: When Relative ETR is selected, no attempt is made to estimate the absolute rate of photosynthetic electron transport, as no assumption is made on the absorption of the incident PAR. In the case of dilute phytoplankton suspensions, it is clear that only a minute fraction of the incident light is actually reaching the PS II reaction centers where primary charge separation takes place. -
Page 94: Al Current/Par List
Report Inst Freshw Ecol Inland Fish Berlin 13: 47-60. 6.12.2 Al current/PAR list PHYTO-PAM-II functions depend on accurate calibration of the LED array including the generation of an valid internal PAR list. This is done via automated routine of the MEASURE PAR LIST... - Page 95 MAIN MENU list menu in the menu bar opens the currently used PAR lists in a separate window. PHYTO-PAM-II provides six actinic light colors. The pull down menu determines the PAR list display of actinic light color or actinic light pulse color (ActP of the fast kinetic mode).
-
Page 96: Script Files
CHAPTER 6.13 PHYTOWIN SCRIPT FILES Script files 6.13 Script files are used for automated execution of experimental procedures. Particularly, script files are advantageous when the same type of analysis needs to be repeated frequently and when complicated protocols must be exactly reproduced. Fig. -
Page 97: Data Management
CHAPTER 6.13 PHYTOWIN SCRIPT FILES 6.13.1 Data Management Four commands are provided for script file management: New Script File Clears the script file window and prompts for a new script file name. Open Script File Opens a script file with name format “filename.PRG”. -
Page 98: Editing Tools
CHAPTER 6.13 PHYTOWIN SCRIPT FILES 6.13.2 Editing Tools Copy The command stores one or several lines of the current script file in the clipboard. To execute the copy command, select one or several lines using the mouse cursor (Left-click once to pick one line. Hold down Shift key and select first and last line of a series of script file commands. -
Page 99: List Of Script File Commands
CHAPTER 6.13 PHYTOWIN SCRIPT FILES Delete Select one or several commands to be deleted (see above) and click icon. The command is equivalent to pressing “delete” on the keyboard. Undo Delete Reverses the last delete action. Disable/Enable Disables command lines of the current script file, or enables previously disabled command lines. - Page 100 CHAPTER 6.13 PHYTOWIN SCRIPT FILES PARA- COMMAND, INPUT METER COMMENT Section 1: -- Program Control Commands -- Call Execute another Phyto- Script file name Win script file as a sub- (filename.prg) program. A sub-program can be displayed by double-clicking an existing calling line.
- Page 101 CHAPTER 6.13 PHYTOWIN SCRIPT FILES PARA- COMMAND, INPUT METER COMMENT TimeStep Define the time interval Time interval in (s) = between the beginnings seconds of two consecutive events; if the TimeStep command is not preceded by an event, the time interval starts with script file execution.
- Page 102 CHAPTER 6.13 PHYTOWIN SCRIPT FILES PARA- COMMAND, INPUT METER COMMENT Message = Halt script execution and Message title and display a message. message text. Clicking OK on the message window or hitting the Enter key continues execution of the script file. Comment Insert a comment line in Comment text...
- Page 103 CHAPTER 6.13 PHYTOWIN SCRIPT FILES PARA- COMMAND, INPUT METER COMMENT Start Light Start recording of a light None Curve curve: equivalent to the “Start” button on the light curve window. Clock Start or stop the Check/uncheck repetitive trigger. Clock Sets or modifies clock Clock interval in s Time interval.
- Page 104 CHAPTER 6.13 PHYTOWIN SCRIPT FILES PARA- COMMAND, INPUT METER COMMENT Sat- Perform saturation pulse None Pulse/Fast analysis (in SP Analysis Kin. Mode). Perform fast kinetics (in Fast Kinetics Mode). Determine Fo level None fluorescence. Section 3: -- Actinic Light Commands -- Switch actinic light Check on/off on/off.
- Page 105 CHAPTER 6.13 PHYTOWIN SCRIPT FILES PARA- COMMAND, INPUT METER COMMENT Keep Off: Determine Fo and Check on/off Fo,Fm Fm values at start of each induction or light curve. On: Use the previous Fo and Fm values for all subsequent saturation pulse analyses.
- Page 106 CHAPTER 6.13 PHYTOWIN SCRIPT FILES PARA- COMMAND, INPUT METER COMMENT Start Fast Starts recording of a Fast none kinetics Kinetics. Equivalent to the “Start” button on the fast kinetics window Starts recording of a Fast none Average Kinetics average series With ST Fast Kinetics recording Yes or No checkbox...
-
Page 107: 7 Technical Specifications
Subject to change without prior notice 7.1.1 PHYTO-PAM-II Compact Version General design: Metal housing for PHYTO-PAM-II Power-and- Control-Unit including all opto-electronic components as well as the measuring chamber for 15 mm Ø quartz cuvette WATER-K. Chip-on-board multi-wavelength measuring light LED emitter: 440, 480, 540, 590, and 625 nm for pulse-modulated measuring light;... -
Page 108: System Control And Data Acquisition
CHAPTER 7 TECHNICAL SPECIFICATIONS Communication: USB 1.1, USB 2.0 and USB 3.0 compatible User interface: Windows computer with PhytoWin-3 software Power supply: Rechargeable sealed lead-acid battery 12 V/2 Ah; Battery Charger MINI-PAM/L (100 to 240 V AC) Dimensions: 29 cm x 30 cm x 20.5 cm (l x w x h), aluminum housing with carrying handle and cuvette cover Power consumption: Basic operation 1.3 W, ML +AL at maximum output 3.7 W. -
Page 109: Battery Charger Mini-Pam/L
Weight: 300 g 7.1.4 Spherical Micro Quantum Sensor US-SQS/WB Design: 3.7 mm diffusing Plexiglass sphere coupled to integrated PAR-sensor via 2 mm fiber, compact amplifier unit and special holder for mounting on sample cuvette; Connects to: PHYTO-PAM-II LIGHT SENSOR connector... -
Page 110: Transport Box Phyto-T
7.1.6 Accessory Stirring Device WATER-S Design: Miniature stirring motor in plastic housing with adapter to mount on top of the PHYTO-PAM-II cuvette; equipped with disposable perspex stirring paddle; self-contained unit featuring long-life 3 V Lithium Battery; potentiometer for adjustment of... -
Page 111: 8 Rechargeable Battery
CHAPTER 8 RECHARGEABLE BATTERY 8 Rechargeable battery The Phytoplankton Analyzer PHYTO-PAM-II is equipped with a rechargeable sealed-lead acid battery. The life time is 1-3 years and it depends on the specific application. A 10 °C rise of the temperature will decrease battery life by approx. -
Page 112: 9 References And Further Reading
CHAPTER 9 REFERENCES AND FURTHER READING 9 References and further reading Agati G, Cerovic ZG, Moya I (2000) The effect of decreasing temperature up to chilling values on the in vivo F685/F735 chlorophyll fluorescence ratio in Phaseolus vulgaris and Pisum sativum: the role of the Photosystem I contribution to the 735 nm fluorescence band, Photochem Photobiol 72: 75–84 ... - Page 113 CHAPTER 9 REFERENCES AND FURTHER READING fluorescence of intact leaves at room temperature. Biochim Biophys Acta 1556: 239–246 Genty B, Briantais J-M, Baker NR (1989) The relationship between the quantum yield of photosynthetic electron transport and quenching of chlorophyll fluorescence. Biochim Biophys Acta 990: 87–92 ...
- Page 114 PAM fluorometry and the Saturation Pulse method. PAM Application Notes 1: 27-35 (http://www.walz.com/e_journal/pdfs/PAN078007.pdf) Klughammer C, Schreiber U (2015) Apparent PS II absorption cross-section and estimation of mean PAR in optically thin and dense suspensions of Chlorella.
- Page 115 CHAPTER 9 REFERENCES AND FURTHER READING Logan BA, Adams III WW, Demmig-Adams B (2007) Avoiding common pitfalls of chlorophyll fluorescence analysis under field conditions. Funct Plant Biol 34, 853–859 Maxwell K, Johnson GN (2000) Chlorophyll fluorescence – a practical guide.
- Page 116 Chlorella investigated with a new type of multi- color PAM chlorophyll fluorometer. Photosynthesis Research 114: 165-177 Schreiber U, Klughammer C, Kolbowski J (2011) High-end chlorophyll fluorescence analysis with the MULTI-COLOR-PAM. I. Various light qualities and their applications. PAN (2011) 1: 1-19 http://www.walz.com/downloads/pan/PAN11001.pdf...
- Page 117 CHAPTER 9 REFERENCES AND FURTHER READING Schreiber U, Schliwa U, Bilger W (1986) Continuous recording of photochemical and non-photochemical chlorophyll fluorescence quenching with a new type of modulation fluorometer. Photosynth Res 10: 51–62 van Kooten O, Snel J (1990) The use of chlorophyll fluorescence nomenclature in plant stress physiology.
-
Page 118: 10 Index
CHAPTER 10 INDEX Index A E Actinic Light 3, 33, 46, 66, 76, 86, 98 Eilers and Peeters model 57 AL + Y 34 Elements for system operation 33 AL Time 38 Emission Spectra 7 alpha 57, 61 EP Model 57 Auto MF‐High 45 ETR 42 Auto‐Gain 37 57, 61, 63 Averaging 76 F B Far Red light 46 battery 10, 47, 102, 105 fast kinetic window 75 Battery Charger MINI‐PAM/L ... - Page 119 CHAPTER10 INDEX Measuring Light 33, 44, 62, 101 H measuring light intensity 45 help 86 N I N(F) 41 61 New Record 37, 52, 65, 96 Ik Value 57 New Report 48 indicator lamp 34 noise 10, 41, 76 info 86 NPQ Definition 25 J O join 86 O‐I1 75 Overload 37 K P Konz= ...
- Page 120 CHAPTER 10 INDEX Computer Requirements Record 65 103 record view 66 ST 34, 75 Ref6 files 69 Stirrer 46 Reference Excitation Spectra 21, 42, Stirring Device WATER‐S 9 66, 68, 69, 72, 74 T reference spectra generation 72 reference window 68 tooltips 86 rel ETR 87 Report 64 U report view 65 report window 64 US‐SQS/WB 9, 14, 103 S V Safety 1 ...
-
Page 121: 11 Warranty
Conditions 11.1 This warranty applies if the defects are called to the attention of Heinz Walz GmbH, Germany, in writing within two (2) years of the shipping date of the product. This warranty shall not apply to any defects or damage directly or indirectly caused by... - Page 122 The Warranty Registration form must be completed and returned to Heinz Walz GmbH, Germany. The product must be returned to Heinz Walz GmbH, Germany, within 30 days after Heinz Walz GmbH, Germany has received written notice of the defect.
Need help?
Do you have a question about the PHYTO-PAM-II and is the answer not in the manual?
Questions and answers