Table of Contents
Advertisement
Quick Links
Advertisement
Table of Contents

Related Manuals for Roche Accu-Chek Smart Pix


Summary of Contents for Roche Accu-Chek Smart Pix
- Page 1 User’s Manual D i a b e t e s M a n a g e m en t S y s t e m Software version 3.0...
- Page 2 If you have obtained the Accu-Chek Smart Pix software from a USB flash drive: The USB flash drive is the original medium used to provide the software, but it is not a removable medium for storing data you have created yourself. Avoid potential data loss (for example from damage to or loss of the USB flash drive) and always store all files locally on your computer or on a network server.
- Page 3 This function is not a substitute for hypoglycaemia training by your healthcare professional. Important note: You do not require an Internet connection if you wish to use the Accu-Chek Smart Pix device and the Accu-Chek Smart Pix software. All the pages and functions are stored in the device itself or in the software, where they can be called up.
- Page 4 Version note This User’s Manual is valid for the Accu-Chek Smart Pix software, version 3.0 in connection with an • Accu-Chek Smart Pix device (model 2), version 2.2.1 or higher, or • Accu-Chek Smart Pix device (model 1), version 3.05 or higher.
-
Page 5: Table Of Contents
Accu-Chek Smart Pix diabetes management system Contents Overview of the system ................................11 Overview of the device................................15 Overview of the status indicator signals of the system....................16 Software overview ..................................17 Buttons overview..................................18 Printed symbols ..................................20 Before you start using the system ..........................21... - Page 6 Using report elements in other applications........................83 4.10 Special functions..................................84 Searching for software updates for the Accu-Chek Smart Pix device and the Accu-Chek Smart Pix software ..........................85 Setting the date and time in the meter ..........................87 Additional special functions ..............................89...
- Page 7 Accu-Chek Smart Pix diabetes management system Contents Reports and records ..................................91 General information about the reports..........................91 Report elements ..................................91 Selecting and assigning preferred report elements ......................92 Analysed data ....................................93 Report styles ....................................94 Keys and additional information on reports ........................95 Overview of icons in reports..............................
- Page 8 Accu-Chek Smart Pix diabetes management system Contents CGM results ....................................141 Overview ......................................142 Trend ......................................144 Standard day ....................................145 Standard week ..................................154 Statistics ......................................154 Metabolic control ..................................159 Logbooks..................................... 160 Diary (record) ...................................161 Contents of the diary ................................162 Adjusting the diary view ................................163 Editing diary entries ................................165...
- Page 9 Accu-Chek Smart Pix diabetes management system Contents Preparing the devices ................................183 Accu-Chek Active blood glucose meter ......................... 187 Accu-Chek Aviva blood glucose meter Accu-Chek Aviva Nano blood glucose meter ......................189 Accu-Chek Aviva Combo blood glucose meter Accu-Chek Aviva Expert blood glucose meter ......................190 Accu-Chek Aviva Insight diabetes manager.........................
- Page 10 Disposal of the device ................................213 Cleaning the USB flash drive............................... 213 Disposal of the USB flash drive ............................214 Using a USB flash drive ................................. 214 Abbreviations..................................... 215 Accu-Chek Smart Pix software Terms of Use ....................217 Customer support ..................................221...
-
Page 11: Overview Of The System
Chapter 1, Overview of the system Overview of the system The Accu-Chek Smart Pix system is used for the easy and automatic analysis of blood glucose values, CGM results and therapy data from various Accu-Chek meters and insulin pumps. The analysis is provided on a computer in the form of a report consisting of various configurable report elements. - Page 12 Chapter 1, Overview of the system Using the Accu-Chek Smart Pix software with the Accu-Chek Smart Pix device (model 2) • Connect the Accu-Chek Smart Pix device (model 2) to the computer when you want to read data from a meter or an insulin pump.
- Page 13 Chapter 1, Overview of the system Using the Accu-Chek Smart Pix software (USB flash drive or download) • Connect the Accu-Chek Smart Pix device (model 1) to the computer when you want to read data from a meter or an insulin pump.
- Page 14 Chapter 1, Overview of the system The Accu-Chek Smart Pix software is a computer program and component of the Accu-Chek Smart Pix system. It contains the following functions: • Create (and edit) reports. • Archive reports with selected elements as a PDF file.
-
Page 15: Overview Of The Device
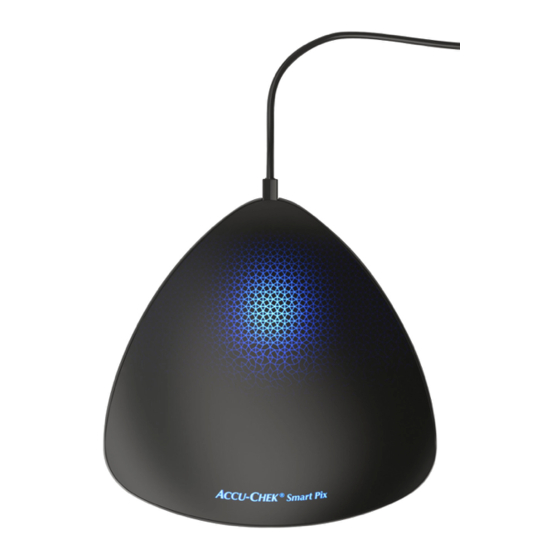
: This device enables connection to various Accu-Chek meters and insulin pumps with infrared or USB ports. At the same time, it contains all the files required for installing the Accu-Chek Smart Pix software. USB plug for connecting to the computer. -
Page 16: Overview Of The Status Indicator Signals Of The System
The Accu-Chek Smart Pix system indicates various operating states with the status indicators on top of the device. If all status indicators are off, the Accu-Chek Smart Pix device is not connected to a computer or the computer is not switched on. -
Page 17: Software Overview
Chapter 1, Overview of the system Software overview The Accu-Chek Smart Pix software consists of the following elements: Title bar of the program window, showing the program name and the buttons for minimising, maximising and closing the window. Navigation panel for selecting the displayed report... -
Page 18: Buttons Overview
Chapter 1, Overview of the system Buttons overview In the program window you will find the following buttons: Back button Returns to the report element that was displayed last. This button is only activated once you leave the displayed start screen to display another report element. - Page 19 PDF reader installed on the computer (for example, Adobe Reader).* Software settings button Use this button to adjust the settings for the Accu-Chek Smart Pix software. Device settings button Access to special functions such as the configuration of suitable devices...
-
Page 20: Printed Symbols
Consult instructions for use. The User’s Manual for the Accu-Chek Smart Pix diabetes management system can be opened by clicking on the Help button. A printed version of the User’s Manual for the Accu-Chek Smart Pix diabetes management Email: system can be requested by email from dia.smartpix@roche.com. -
Page 21: Before You Start Using The System
Chapter 2, Before you start using the system Before you start using the system You can use the Accu-Chek Smart Pix system (device and software) on any computer which meets the necessary system requirements. Any additional computer features required are listed below. -
Page 22: What You Require To Use The System
A suitable USB cable (USB, micro B to USB, type A), if you wish to read data from meters with a USB port. • An Accu-Chek Smart Pix device (model 1) if you wish to read data from meters with an infrared port. Note: This device is not available in all countries. - Page 23 Chapter 2, Before you start using the system The following requirements must be met to be able to use special functions: • Adobe Reader or a similar program must be installed to be able to display and print PDF files (PDF version 1.6/Acrobat 7 and higher).
-
Page 24: Copying Software To The Computer
Chapter 2, Before you start using the system Copying software to the computer The Accu-Chek Smart Pix software can be used locally on your computer or on a network server. To do this, copy the entire program folder to a suitable location on the selected hard disk. -
Page 25: Connecting The Device
Connecting the device To copy the software from the Accu-Chek Smart Pix device (model 2): Insert the USB plug of the Accu-Chek Smart Pix device into a free USB port on your computer. You can do this while your computer is either on or off. This connection provides the Accu-Chek Smart Pix device with power and it therefore does not need a battery or a power pack. - Page 26 If this has not been done automatically, open a window on your computer which displays the contents of the Accu-Chek Smart Pix device (as a disk), of the USB flash drive or of the extracted installation folder. You can do this from My Computer or Windows Explorer.
- Page 27 USB port. This driver installation is not required for the Accu-Chek Smart Pix device (model 2) because the drivers are pre-installed on the device. Administrator access rights are required for installing the USB driver software.
- Page 28 Chapter 2, Before you start using the system...
-
Page 29: Launching And Configuring The Software
Launching and configuring the software Launching the software To launch the Accu-Chek Smart Pix software, double-click either the program file Accu-Chek Smart Pix Software.exe or an existing shortcut (see chapter 2.2). The program launches with a program window which is still empty. -
Page 30: Configuring The Software
Chapter 3, Launching and configuring the software Configuring the software You can customise several areas of the Accu-Chek Smart Pix software to tailor it to your needs. These settings are independent of those which may have been applied to the Accu-Chek Smart Pix device (model 1). -
Page 31: General Settings
You can configure device data to be automatically read, saved or printed. Updates for the Accu-Chek Smart Pix system can also be downloaded automatically from the Internet. • Save options: Here you can select the location for saving records, as well as naming conventions and the location for saving PDF reports. -
Page 32: Selecting A Language
Chapter 3, Launching and configuring the software Selecting a language • Click the currently set language to open the selection list. • Click the language you want to select. -
Page 33: Time And Date Format
Chapter 3, Launching and configuring the software Time and date format • Select the time and date format to be used, for example, in the calendar or for displaying the point in time when the data was last read. • Select the non-work days. -
Page 34: Personal Settings
Chapter 3, Launching and configuring the software Personal settings • Enter up to three rows of personal data (for example, name and address of the medical institution). This text will then appear on all saved or printed reports. The number of characters per row must not exceed 50. -
Page 35: Automatic Features
Chapter 3, Launching and configuring the software Automatic features Automatic features help you simplify the following tasks: • Automatically import device data and (if applicable) add it to an existing record. • Automatically print device data. • Automatically save device data. •... - Page 36 To completely close the program or to restore it to the foreground, right-click the Accu-Chek Smart Pix icon in the information area (right-hand side of the Windows taskbar) and select Open or Quit.
- Page 37 Chapter 3, Launching and configuring the software Automatic import This feature ensures that data available in the Accu-Chek Smart Pix system is adopted directly and saved as a record. • Click the Settings button next to Automatic import. • In the following dialogue box, click the Activate automatic import checkbox.
- Page 38 Chapter 3, Launching and configuring the software Automatic print To use this feature, you need to select a printer available on the computer, as well as the reports to be printed. • Click the Settings button next to Automatic print. •...
- Page 39 Chapter 3, Launching and configuring the software Automatic save This feature automatically saves reports as PDF files and is independent of the save feature for records, which is activated using automatic import. • Click the Settings button next to Automatic save. •...
- Page 40 Chapter 3, Launching and configuring the software Automatic update When this function is activated, the Accu-Chek Smart Pix software automatically checks whether updates are available for the Accu-Chek Smart Pix system (software, device, User’s Manual) every time the program launches. Newer versions are automatically downloaded and installed.
- Page 41 Chapter 3, Launching and configuring the software As soon as a new version is available on the update server, the respective components are updated as described below: • The Accu-Chek Smart Pix software is updated the next time the program launches (after requesting confirmation). •...
-
Page 42: Save Options
Chapter 3, Launching and configuring the software Save options Here you select the folders where the newly created records and archived reports will be saved. The automatic features (described as of page 35) also use these folders for saving data. •... - Page 43 Chapter 3, Launching and configuring the software In addition, you can configure the naming conventions here that will be used for future reports that are archived (as PDF files). You can combine several components in this file name to help you identify and sort the files later. The File name of PDF reports dialogue box displays two columns with possible components for the file name.
-
Page 44: Settings For New Patients
Chapter 3, Launching and configuring the software Settings for new patients In the Settings for new patients window you will find configuration options for displaying reports. These settings are always used when you create a new record. • Time intervals: This setting defines the time intervals used to summarise test results in the long-term view of the Status report element. - Page 45 Chapter 3, Launching and configuring the software • Maximum basal rate: You can customise the graphical display of basal rates to high, medium and low average rates. • Carbohydrate unit: Select the desired Carbohydrate unit to be used for input and display. •...
- Page 46 Status report element. You can choose between: • Upload intervals (reading out device data using the Accu-Chek Smart Pix software, for example, as part of regular visits to the doctor). • Quarterly intervals •...
- Page 47 Chapter 3, Launching and configuring the software Time setup Select the default Time range you want a report to analyse and display. You can change this setting at any time in reports as they are being displayed to examine them in more detail or with respect to more long-term developments.
- Page 48 Chapter 3, Launching and configuring the software BG tests To gain meaningful results from statistical analyses, tests need to be conducted with a certain regularity (distributed over the course of the day) and recurrence. Select the minimum number of tests necessary to display a statistical analysis.
- Page 49 Chapter 3, Launching and configuring the software Maximum basal rate As the sizes of the individual basal rates can vary, it is possible to adjust the scale of the insulin dose in the basal rate chart to the desired range of values. Carbohydrate unit Select the carbohydrate unit to be used for displaying the corresponding amounts in various report elements.
- Page 50 Chapter 3, Launching and configuring the software BG unit Select the BG unit (mg/dL or mmol/L) to use for setting the limits for blood glucose. BG and CGM status The statements in the BG status or CGM status report element relate to the target values of the following parameters: •...
- Page 51 Chapter 3, Launching and configuring the software Here you enter the limits by means of which the three above mentioned parameters are to be analysed. This is displayed by means of coloured dots next to the respective input and display fields. Where applicable, the entire available setup area is also displayed (for example, 0 …...
- Page 52 Chapter 3, Launching and configuring the software • The Variability is calculated from the standard deviation (SD) or variance of the analysed results. The thresholds for the Variability can be defined as either relative SD (based on the mean blood glucose) or as absolute SD.
- Page 53 Chapter 3, Launching and configuring the software • The BG & CGM – target range refers to both blood glucose results and CGM results. For blood glucose results, the arithmetic mean of all test results (mean blood glucose) is considered. For CGM results, the central value of all CGM results (CGM median) is considered.
-
Page 54: Customised Settings For The Patient Record Currently Displayed
Chapter 3, Launching and configuring the software Customised settings for the patient record currently displayed This window, whose name depends on the currently opened record, contains setup options for customising the report. The setup options are identical to the Settings for new patients. -
Page 55: Adjusting Menu And Button Bar
Chapter 3, Launching and configuring the software Adjusting menu and button bar You can customise the button bar at the top of the program window according to your needs. Use this function, for example, to move rarely used buttons to the Device settings menu or move frequently used special functions to the button bar. - Page 56 Chapter 3, Launching and configuring the software To move an entry up or down in the list: • Select the entry you want to move in the column, then click the up or down arrow to move this entry to the desired position. •...
-
Page 57: Using The Software
Chapter 4, Using the software Using the software The Accu-Chek Smart Pix software provides you with the following options: • Display reports with graphical, tabular and statistical elements. • Maximise graphical report elements depending on the available screen area and examine them in detail. -
Page 58: Reading Data Manually
Chapter 4, Using the software Reading data manually If you configured the Accu-Chek Smart Pix software so that no automatic features will run, you need to trigger the reading of data manually. • Prepare the device (meter, diabetes manager or insulin pump) for transferring data. - Page 59 Chapter 4, Using the software If data has already been imported from the device and assigned to a record: • The Yes button allows you to confirm that the data is to be added to the existing and pre-selected record. •...
- Page 60 Chapter 4, Using the software The data is now imported from the Accu-Chek Smart Pix device and prepared for a report according to the defaults. If you had not decided at the time of import where to save or assign the data, you can do so now. To save the displayed record permanently, click the Save button.
- Page 61 Chapter 4, Using the software If patients are using more than one meter (for example, one at the workplace and one at home) and you want to read the data from all the devices for the same report, repeat the steps described beforehand for each device.
-
Page 62: Reading Data Automatically
Chapter 4, Using the software Reading data automatically If you configured the Accu-Chek Smart Pix software so that an Automatic import will be performed, it is not necessary for the program to run in the foreground. You can minimise or close the program window. -
Page 63: Managing Records
Chapter 4, Using the software Managing records Creating a new patient record You can create a new record at any time (irrespective of existing data), even during an import. To create a new record: • If there is no import running, click the Open patient list button. - Page 64 Chapter 4, Using the software To create the new record: • Enter the name and any further information you require. You can use any of the information entered here to search for the record at a later stage. • Click the OK button to create the record and close the dialogue box, or: •...
-
Page 65: Assigning An Existing Record
Chapter 4, Using the software Assigning an existing record If you have imported data that is to be assigned to a person with an already existing record (for example, for a new meter), proceed as described here: • Click the button. -
Page 66: Importing Records
Chapter 4, Using the software Importing records To add a DIA file which was received by email or restored from a data backup to your patient list: • Click the Import record… button in the Patient list window. • In the dialogue box that follows (if there is more than one file), select the desired DIA file and click Open. -
Page 67: Further Report And Record Management Features
Chapter 4, Using the software Further report and record management features Opening a record You can open saved records at any time. An opened record gives you access to all its reports and a tabular representation of its data (Diary). •... -
Page 68: Closing The Record And Report
Chapter 4, Using the software Closing the record and report To close an open record (and/or the currently displayed report): Click the icon next to the record ID or meter information. Note that unsaved data is only available until you close the program or the record, or import new data. -
Page 69: Editing Patient Records
Chapter 4, Using the software Editing patient records You can edit the master data of a patient record at a later time. • Click the Open patient list button. • Click the record you want to select. • In the Patient list window, click Edit patient records… •... -
Page 70: Deleting A Record
Chapter 4, Using the software Deleting a record You can delete a record at any time. The selected record will be deleted upon confirmation. Be sure that you no longer need the selected record. Regular data backups also help to avoid inadvertent data loss. -
Page 71: Activating The Interface To Accu-Chek Connect Online
Accu-Chek Connect app or by uploading the device data, can make the data directly available for analysis by the Accu-Chek Smart Pix software. In order to use this function, you need a user account for Accu-Chek Connect online. - Page 72 You can now invite all users in the patient list to enable their data for analysis. The data of all the patients who confirmed this invitation is also available in the Accu-Chek Smart Pix software through automatic synchronisation with Accu-Chek Connect online.
-
Page 73: Adjusting The Patient List Display
Chapter 4, Using the software Adjusting the patient list display You can toggle the contents displayed in the patient list as you wish and you can also rename the column headings and change the column order. • Right-click any column heading. •... - Page 74 Chapter 4, Using the software • Click a column heading and drag it to any position to change the display sequence of the columns. • Click any column heading to sort the table by this column. • Click the column heading according to which the patient list is to be sorted.
-
Page 75: Exporting Reports As Pdf Files
Chapter 4, Using the software Exporting reports as PDF files When you have read device data or opened a record, you can save the displayed report as a PDF file. • Click the button. • Select the Save current view option if you want to save only the report element currently displayed as a PDF file. - Page 76 Chapter 4, Using the software • Enter the desired file name in the corresponding input field. You can also keep the default file name (see Save options in chapter 3). The file will be given the name entered here along with the suffix “.pdf”. •...
-
Page 77: Printing Reports
Chapter 4, Using the software Printing reports When you have read device data or opened a record, you can print the displayed report with the Accu-Chek Smart Pix software’s print feature. • If you are printing a currently displayed report... - Page 78 Chapter 4, Using the software To print a report: • Click the button. • Select the Print current view option if you want to print only the report element currently displayed. • Select the Print... option if you want to print multiple report elements.
-
Page 79: Emailing Reports
See page 66 for information about reading such a record received by email. Independently of this, you can send reports previously exported as PDF files as email attachments (you do not need the Accu-Chek Smart Pix software for this). - Page 80 Chapter 4, Using the software To email a report: • Click the button. • Select the Send current view option if you want to send only the report element currently displayed. • Select the Email... option if you want to send multiple report elements.
- Page 81 Chapter 4, Using the software The selected report elements are now saved to a temporary PDF file (which will be deleted after the email is sent). If you decide not to send the report elements, click the Cancel button instead. Your computer’s default email program is then launched and an empty email is opened.
-
Page 82: Displaying Archived Reports (Pdf Files)
The exported PDF files are displayed using the PDF reader (for example, Adobe Reader) installed on your computer, not in the Accu-Chek Smart Pix software. This is why you can also forward these PDF files to someone not working with the Accu-Chek Smart Pix software for information purposes. -
Page 83: Using Report Elements In Other Applications
Chapter 4, Using the software Using report elements in other applications If you want to use charts or texts from the reports in other applications (for example, in a text program or a table), you can do so by copying them to the clipboard. •... -
Page 84: 4.10 Special Functions
Chapter 4, Using the software 4.10 Special functions The Accu-Chek Smart Pix software allows you to select the following special functions: • Performing updates for the Accu-Chek Smart Pix device • Manually triggering the search for software and device updates •... -
Page 85: Searching For Software Updates For The Accu-Chek Smart Pix Device And The Accu-Chek Smart Pix Software
Click the Help button. • Select the Software update... option. – If you want to search for updates on the Roche server, ensure that the computer is connected to the Internet. – If you want to install updates from a USB flash drive, insert the USB flash drive into the computer. - Page 86 Chapter 4, Using the software The search is performed in the background and you can use the Accu-Chek Smart Pix software without restriction. When a newer version is found, it is downloaded. Updating the respective components occurs as described below: •...
-
Page 87: Setting The Date And Time In The Meter
Setting the date and time in the meter For the majority of supported meters, you can set the date and time directly from the Accu-Chek Smart Pix software. You can correct this manually at any time or when you are... - Page 88 Chapter 4, Using the software Correcting the date and time semi-automatically When you are reading data from a meter, the Accu-Chek Smart Pix software automatically compares the time and date settings of the meter with those of the computer. If the device date and time cannot be set directly, you will be notified of the difference between the meter and the computer if there is one.
-
Page 89: Additional Special Functions
Chapter 4, Using the software Additional special functions The Device settings menu contains the following additional functions: • Clear meter memory: Delete the memory of a connected meter. • Configure meter (Accu-Chek Guide and Accu-Chek Instant): Connect one of these devices to set the target range to be used in that device;... - Page 90 The blood glucose results determined in this context are shown in a separate report element in the Accu-Chek Smart Pix software. The 3-day profile helps you create the most meaningful blood glucose results possible. For three days in a row, seven tests are performed per day at specified times.
-
Page 91: Reports And Records
Reports and records General information about the reports Report elements The Accu-Chek Smart Pix software creates single-page or multi-page reports for defined time ranges (for example, the last 2 or 4 weeks); the time range can be selected as needed. -
Page 92: Selecting And Assigning Preferred Report Elements
Chapter 5, Reports and records Selecting and assigning preferred report elements You can set up the Navigation panel of the software so that the preferred report elements are directly displayed in the desired sequence while rarely used report elements are hidden in the sub-menu (more...). -
Page 93: Analysed Data
Chapter 5, Reports and records Analysed data The Accu-Chek Smart Pix software checks the read data to create the reports. The following data is not included in the statistics: • Test results outside the selected time range • Test results saved without date and time •... -
Page 94: Report Styles
Chapter 5, Reports and records Report styles Some report elements can be displayed in different styles, which you can toggle directly when displaying the respective report element. You can find such toggle buttons in the following report elements: Toggle button Report element Toggle between... -
Page 95: Keys And Additional Information On Reports
Chapter 5, Reports and records Keys and additional information on reports At the bottom of the program window, you will find a general information and settings area which contains adjusted statistics, display options and keys, depending on the report element displayed. Click the corresponding tab on the left edge to display the associated area: tab contains statistical information •... -
Page 96: Overview Of Icons In Reports
Chapter 5, Reports and records Overview of icons in reports Detailed view Mean blood glucose Blood glucose value without any additional information. Values below the hypo limit are shown in red; values above the target range are shown in blue. Blood glucose value before and/or after meal. - Page 97 Chapter 5, Reports and records Diary Customised event, for example, test from an alternative site (Alternative Site Testing (AST)) Hypoglycaemia Carbohydrate amount Before meal After meal Before/during/after exercise Stress Illness Additional information Tests performed within a 3-day profile CGM results Mean glucose value Lowest glucose value (Minimum line) Hypo limit...
- Page 98 Chapter 5, Reports and records Insulin pump Icon Description Basal rate Average total basal insulin per day Basal rate profile Basal rate change Basal rate change (with name; Trend) Temporary increase in basal rate/End of temporary increase Temporary decrease in basal rate/End of temporary decrease Active basal rate profile (Statistics) Switch to a named basal rate profile (for example, “1”) Switch from a named basal rate profile (for example, “1”) to another named basal rate profile (for...
- Page 99 Chapter 5, Reports and records Insulin pump Standard bolus, represented in charts top down Quick bolus, represented in charts top down Extended bolus, represented in charts top down; the width of the bar shows the duration of the bolus delivery Multiwave bolus, represented in charts top down;...
- Page 100 Chapter 5, Reports and records Blood glucose results can contain additional information (events) which is not represented by icons. These events are displayed in the comments column of the diary view: • Snack • Bedtime • Fasting • Before exercise •...
-
Page 101: Interactive Features In The Report
Chapter 5, Reports and records Interactive features in the report The reports displaying on-screen contain many interactive features you can use to directly modify the representation. These features help you, for example, to see certain information in more detail or to hide interfering elements. Toggling panes Whenever you see this triangular icon in a report, you can... -
Page 102: Changing The Time Range
Chapter 5, Reports and records Changing the time range In the beginning, most reports show the time range set in the configuration, with the most current data at the end of the visible range. Aside from these, there are report elements that are in relation to points in time and time intervals (see page 105), as well as report elements that do not require separate chronological navigation as they are set up as... - Page 103 Chapter 5, Reports and records The interactive time axis allows you to quickly and easily navigate all available data thanks to a moveable time range. The highlighted frame shows the currently selected section on the time axis. • You can enlarge or reduce this frame at the left and right edges to adjust the displayed time range (by days, from 1 day to 12 weeks).
- Page 104 Chapter 5, Reports and records In addition, certain information is displayed on the time axis with the help of icons: Markers on the time axis A white marker point marks a time when data was read. A grey marker point marks a time when data was read and the meter date or time was corrected. A yellow marker point marks an entry in the logbook which is only comprised of a comment.
-
Page 105: Changing Time Intervals
Chapter 5, Reports and records Changing time intervals In some report elements, you find representations that are in relation to specific points in time and time intervals. While, for example, the Status report element evaluates all the information and values of the selected time range at once, the Long-term view summarises values in time intervals and presents these intervals next to each other for comparison. -
Page 106: Changing Chart Contents
Chapter 5, Reports and records Changing chart contents In graphical report elements you can toggle certain displayed objects and, in some cases, change parameters of the representation: • You can toggle each element which has a checkbox on the Display options tab (for example, test results or grid lines) by clicking the checkbox to select or deselect it. -
Page 107: Toggling The Display Between Bg And Cgm Results
Chapter 5, Reports and records Toggling the display between BG and CGM results If data from continuous glucose monitoring (continuous glucose monitoring = CGM) is present in addition to blood glucose results you have obtained with a meter (BG), it is possible to toggle the display between both data types. -
Page 108: Displaying Additional Information In Charts
Chapter 5, Reports and records Displaying additional information in charts The Trend, Standard day and Standard week report elements allow you to display additional information for every entry. • Move your mouse across the entry (blood glucose, insulin or carbohydrate amount, connecting line) you would like to have more information about. -
Page 109: Selecting Chart Contents
Chapter 5, Reports and records Selecting chart contents The Trend, Standard day, Standard week and Metabolic control report elements allow you to select certain elements (thus highlighting them) for examination in this report or other reports. • Simply clicking a connecting line or an entered test point marks the day’s tests belonging together. -
Page 110: Blood Glucose: Contents Of The Report
Chapter 5, Reports and records Blood glucose: contents of the report Overview In the Overview report element, you find two display options: • Status : A joint analysis of all values in the selected time range. • Long-term view : Divided into time intervals with separate analysis, displayed next to each other. - Page 111 Chapter 5, Reports and records The assessment of these three parameters occurs using a traffic light indicating “Keep it up!” (green), “Watch out!” (yellow) or “Stop!” (red). • If the values fall inside the specified range, this is indicated by the colour green. •...
- Page 112 Chapter 5, Reports and records Other panes In other panes you can find a summary of information from other report elements, such as Standard day, Statistics or Distribution. As with all other report elements, all results and statistics refer to the set time range. By clicking the icon in one of these panes, you go directly to the associated report element containing more detailed...
- Page 113 Chapter 5, Reports and records • If in the Distribution pane, detected low/high patterns are displayed, you can click the icon to call up detailed information on the detected patterns. The Overview report element only displays a detected pattern if the data is read from an Accu-Chek Guide meter with this function enabled.
- Page 114 Chapter 5, Reports and records Long-term view The Long-term view summarises values in time intervals and presents these intervals next to each other for comparison. This allows, for example, fundamental changes between visits to the doctor (Upload intervals) to be displayed at a glance.
-
Page 115: Trend
Chapter 5, Reports and records Trend In the Trend report element, you find two display options: • Detailed view : Displays all individual values in the selected time range. • Trend view : Displays the daily mean values next to each other. Detailed view : This report element shows the trend for several test results over the selected time range. - Page 116 Chapter 5, Reports and records For further guidance, you can see the set target range in the background of the chart (in the form of a green bar) and the hypo limit (in the form of a red line). Days that are non-work days (the default is set to weekends) are additionally marked with a grey bar on the horizontal axis.
- Page 117 Chapter 5, Reports and records The following information can be optionally displayed at the bottom of the chart: • Carbohydrate amounts (brown), if stored in the meter or entered in the record. To facilitate evaluation of the amounts, the bars are represented by small separate blocks.
- Page 118 Chapter 5, Reports and records Carbohydrates, insulin and basal rate can also be displayed in separate areas. To set this type of display: • Under Software settings , open the General settings tab. • Under Display options, select the option Graphical representation: Graphs one below the other (see page 33).
-
Page 119: Standard Day
Chapter 5, Reports and records Standard day In the Standard day report element, you find two display options: • Detailed view : Displays all individual values in the selected time range. • Trend view : Displays the mean values from 8 time blocks, displayed next to each other. - Page 120 Chapter 5, Reports and records Detailed view : All the blood glucose values are plotted at the relevant time of day according to the time when the test was performed. For your guidance, the blood glucose values (represented by various icons) are connected by a line, provided the corresponding tests are no more than 10 hours apart.
- Page 121 Chapter 5, Reports and records The following information can be optionally displayed at the bottom of the chart: • Carbohydrate amounts (brown), if stored in the meter or entered in the record. Basal rate (blue), if present from an insulin pump. •...
- Page 122 Chapter 5, Reports and records Trend view : All the blood glucose values are assigned to one of the eight time blocks according to the time when the test was performed. This creates eight areas displaying the mean blood glucose value (black diamond), standard deviation (blue bar) as well as the lowest and highest value.
-
Page 123: Standard Week
Chapter 5, Reports and records Standard week In the Standard week report element, you find two display options: • Detailed view : Displays all individual values in the selected time range. • Trend view : Displays the mean values from the 7 days of the week next to each other. - Page 124 Chapter 5, Reports and records Detailed view : All the blood glucose values are plotted on the chart according to the time when the test was performed and the respective day of the week. Results which are no more than 10 hours apart are connected by lines in chronological order for a better overview.
- Page 125 Chapter 5, Reports and records The following information can be optionally displayed at the bottom of the chart: • Carbohydrate amounts (brown), if stored in the meter or entered in the record. Basal rate (blue), if present from an insulin pump. •...
- Page 126 Chapter 5, Reports and records Trend view : All the blood glucose values are assigned by date to one of the seven days of the week. Accordingly, you will see seven blocks indicating the mean blood glucose value (black diamond), standard deviation (blue bar) and lowest or highest value of the respective day of the week.
-
Page 127: Metabolic Control
Chapter 5, Reports and records Metabolic control The mean blood glucose or mean CGM and the standard deviation (SD/variance of the values) are calculated for each day of the analysed time range. These two results together provide the coordinates for making an entry (per day) in the chart. - Page 128 Chapter 5, Reports and records Example: Mean blood glucose values below 150 mg/dL (or below 8.3 mmol/L) with a standard deviation of less than 50 mg/dL (or less than 2.8 mmol/L) are plotted in the bottom left quadrant. Its attributes are “stable-low”. If both values are above these limits, the entry is made in the top right-hand quadrant (“unstable-high”).
- Page 129 Chapter 5, Reports and records In addition to the graphical display, you will find statistical information about the values included in the report. For blood glucose values, these are: • Number of tests: Number of analysed blood glucose results in the selected time range. Tests per day: Average number of BG tests per day •...
-
Page 130: Statistics
Chapter 5, Reports and records Statistics In the Statistics report element, you find three display options: • General statistics : Displays all statistical information in the selected time range. • Meal-related statistics : Analyses all information in relation to meals. •... - Page 131 Chapter 5, Reports and records General statistics Contains general and statistical information about the values processed for the selected time range. Here you will find the following information: Time range • Time range considered in the report, with start and end date.
- Page 132 Chapter 5, Reports and records Report (Blood glucose) Number of tests: Number of analysed blood glucose • results in the selected time range. • Tests per day: Average number of BG tests per day for each day of the analysed time range. In addition, the value of only those days when a test was performed at least once is also displayed (in brackets).
- Page 133 Chapter 5, Reports and records Additional information This information is only displayed if required: • Results without date/time: Number of test results which were stored without date and time information. Results with warnings: Number of test results which • were stored with temperature warning, expiry note, etc.
- Page 134 Chapter 5, Reports and records Meal-related statistics Contain all relevant statistical information on the processed values, displayed in relation to the three mealtimes. Here you will find the following information: Total pane (Blood glucose) Tests: Number of analysed blood glucose results •...
- Page 135 Chapter 5, Reports and records Only meal-related values pane (Blood glucose) Tests: Number of analysed blood glucose results • where the specific meal-related information before/ after meal was saved together with the test result. • Mean blood glucose: The average of all test results obtained, which were saved with specific meal-related information.
- Page 136 The distribution of values above, within and below the target range and hypoglycaemic episodes. If the time blocks are defined in the meter, the information from the meter will be used. If they are not, the settings in the Accu-Chek Smart Pix software configuration are used.
-
Page 137: Device Settings
Chapter 5, Reports and records Device settings The Device settings report element is only created if a suitable meter transfers this information (for example, Accu-Chek Aviva Insight diabetes manager with Accu-Chek Insight insulin pump). Basal rate – Bolus The Basal rate – Bolus report element shows the (absolute and relative) recurrence with which, for example, a certain basal rate profile or bolus type was used. - Page 138 Chapter 5, Reports and records Bolus advice Here you will find the total number of boluses delivered in the selected period as well as the number and proportion of boluses determined with or without the bolus calculator. • Boluses taken over unchanged from the bolus calculator •...
-
Page 139: Basal Rates
Chapter 5, Reports and records Basal rates This report element displays the basal rates set in the insulin pump at the time of data transfer in order to facilitate comparison. The basal rate profile currently active in the insulin pump is marked with the icon and is selected by default (highlighted) when opening this report element. -
Page 140: Insulin Pump Lists
Chapter 5, Reports and records Insulin pump lists In the Insulin pump lists report element, you find three display options: • Bolus list : Tabular representation of all bolus deliveries. • Basal insulin : Tabular representation of the basal rate. •... -
Page 141: Cgm Results
Chapter 5, Reports and records CGM results The variants of the Status, Trend, Standard day and Standard week report elements as described below are only displayed in this way if CGM results are present for the selected time range. These CGM results are automatically displayed. -
Page 142: Overview
Chapter 5, Reports and records Overview The Overview report element contains a summarised assessment of read CGM results, amongst others, Standard day is displayed as combined CGM curves. This report element helps to quickly gain an overview and does not contain any detailed information about individual results. - Page 143 Chapter 5, Reports and records The assessment of these three parameters occurs using a traffic light indicating “Keep it up!” (green), “Watch out!” (yellow) or “Stop!” (red). • If the values fall inside the specified range, this is indicated by the colour green. •...
-
Page 144: Trend
Chapter 5, Reports and records Trend This report element shows the continuous trend of several test results over the selected time range. The values that can be displayed in this report element are: • CGM results • Bolus insulin • Carbohydrate amounts •... -
Page 145: Standard Day
Chapter 5, Reports and records Standard day In the Standard day report element, you find three display options: • Trend view in AGP format : Displays the CGM results as an Ambulatory Glucose Profile. • CGM curves combined : Displays the CGM results as single curves in a combined chart. - Page 146 Chapter 5, Reports and records Trend view in AGP format : All the CGM results are plotted at the relevant time of day according to the time when the result was obtained. Median, percentile, and minimum line are displayed. Boundaries between time blocks are represented by alternating vertical (white and grey) backgrounds.
- Page 147 Chapter 5, Reports and records If the value range displayed around the median is as thin as possible, it means that there is a low variance at the specified point in time. The wider the value range, the higher the variance of the CGM results at this point in time.
- Page 148 Chapter 5, Reports and records The following information can be displayed at the bottom edge and below the chart: • Carbohydrates (brown), if stored in the meter or entered in the record. Basal rate (blue), if present from an insulin pump. •...
- Page 149 Chapter 5, Reports and records CGM curves combined : All the CGM results are plotted at the relevant time of day according to the time when the results was obtained. Separate curves for each day are displayed in a combined chart. To facilitate recognition of recurring patterns, the CGM curves are examined according to their similarities and divided into groups.
- Page 150 Chapter 5, Reports and records The following information can be displayed at the bottom edge and below the chart: • Carbohydrates (brown), if stored in the meter or entered in the record. Basal rate (blue), if present from an insulin pump. •...
- Page 151 Chapter 5, Reports and records Display groups separately You can display each group separately to view only the CGM curves associated with that group. Each group is displayed as a thumbnail; below the thumbnail is the number of days associated with it. Click the desired thumbnail to display only the curves belonging to this group.
- Page 152 Chapter 5, Reports and records Zoom function The zoom function allows you to view more exact details in specific time blocks. Click the magnifying glass icon in the desired time block to zoom in. To return to the previous view, click the magnifying glass icon at the top of the chart again.
- Page 153 Chapter 5, Reports and records CGM curves individually : Separate curves for each day are displayed in separate charts. The colour of the lower chart limit indicates the association to a group. In addition, the following information is displayed at the right edge of each chart: •...
-
Page 154: Standard Week
Chapter 5, Reports and records Standard week This report element is also used to facilitate recognition of recurring patterns; here the reference point is the day of the week. It allows you to recognise changes in your metabolism which recur on specific days of the week (for example, on days when you do exercise). - Page 155 Chapter 5, Reports and records General statistics Contains general and statistical information about the values processed for the selected time range. Here you will find the following information: Device Device: Name of the smartphone (for the CGM • system) Serial number of smartphone •...
- Page 156 Chapter 5, Reports and records Report (CGM results) The report on CGM results contains the following statistical information: • Sensor coverage: Percentage of time in the selected time range during which the CGM sensor delivered results. • Calibrations per day: Average number of calibration tests per day, normally at least two per day.
- Page 157 Chapter 5, Reports and records Additional information This information is only displayed if required: • Results with warnings: Number of CGM results which were stored with temperature warning, expiry note, and so on. Meal-related statistics Contain all relevant statistical information on the processed CGM results, displayed in relation to the three meals of the day.
- Page 158 Chapter 5, Reports and records Aligned by lowest result pane The CGM results are analysed for each time block of a meal separately. The highest CGM result and the lowest CGM result before this in the respective time block are determined. The following statistics are determined from these values: Tests: Number of tests on days for which there is a •...
-
Page 159: Metabolic Control
Chapter 5, Reports and records Metabolic control The description of the graphical representation in this report element can be found on page 127. In addition to the graphical display, you will find statistical information about the values included in the report. For CGM results these are: Sensor coverage: Percentage of time in the selected •... -
Page 160: Logbooks
Chapter 5, Reports and records Logbooks In the Logbooks report element, you can find three display options: • : Chronological table including calibration, Diary BG, carbohydrate and insulin information, if available. • Logbook (BG only) : Chronological table divided into columns according to time blocks and these columns are subdivided into before/after meal columns. -
Page 161: Diary (Record)
Chapter 5, Reports and records Diary (record) The term “record” describes the personal data saved, which is read from devices primarily during imports. This data is the raw material used to create reports. You can view and edit this data as a report in the analysis view, or as a tabular Diary. When opening a saved record, the associated report will be created and displayed at the same time. -
Page 162: Contents Of The Diary
Chapter 5, Reports and records Contents of the diary The record displays as a tabular list of sorted blood glucose results, insulin pump data and further information. The table of values (sorted by date and time blocks) is created according to the date and time information of the blood glucose results and pump data. -
Page 163: Adjusting The Diary View
Chapter 5, Reports and records Adjusting the diary view You have the following options for customising the table to suit your personal requirements: Column hide option • Right-click the table header to open the context menu. • All the columns currently displayed (activated) are ticked. - Page 164 Chapter 5, Reports and records Selecting displayed values Right-click in the diary to select what type of values you want to be displayed: • BG values • BG control results • CGM calibration results • BG values without date and time The selection you make is ticked and all other values are hidden.
-
Page 165: Editing Diary Entries
Chapter 5, Reports and records Editing diary entries “Diary entry” always refers to a complete table row divided into various information sections (for exam- ple, Blood glucose or Comments). Each diary entry has at least a date and a time. You have the following options for editing diary entries: You can: •... - Page 166 Chapter 5, Reports and records Adding or deactivating diary entries On the right-hand side of every diary entry there are one or two small buttons with the following functions: • With the button you can add a row above the present row.
- Page 167 Chapter 5, Reports and records To deactivate a diary entry: • Click the button in the row you wish to deactivate. The row will now be displayed shaded in grey. This diary entry will no longer be included in reports and statistics.
- Page 168 Chapter 5, Reports and records Values (blood glucose, carbohydrates, insulin) in the diary The values in the respective columns are displayed with the following units: • Blood glucose The unit is the same as the unit set in the meter from which the data was read.
- Page 169 Chapter 5, Reports and records Entering and editing blood glucose values To enter a blood glucose value in a manually created diary entry: • In the desired entry, click the Blood glucose column. • When the input field is highlighted, you can enter the value.
- Page 170 Chapter 5, Reports and records To mark a blood glucose value with an event: • In the desired entry, click the section to the right of the blood glucose value. • From the menu now displayed select the desired event by clicking it once.
- Page 171 Chapter 5, Reports and records Entering and editing carbohydrates To enter a carbohydrate value in a diary entry created manually or read from a meter or insulin pump: • In the desired entry, click the Carbohydrates column. • When the input field is highlighted, you can enter the value.
- Page 172 Chapter 5, Reports and records Entering and editing insulin doses Insulin types 1, 2 and 3 are assigned as follows in the diary: If you use an insulin pump, the pump insulin is automatically entered as Insulin 1. If you do not use an insulin pump, you may, for example, assign Insulin 1 to the short-acting insulin you use;...
- Page 173 Chapter 5, Reports and records Adding, editing and deleting comments To add a comment to a diary entry: • In the Comments column, click the entry to which you wish to add the comment. • When the comments field is highlighted, you can enter the desired text.
- Page 174 Chapter 5, Reports and records To change an existing comment: • Double-click the comment you wish to change. The cursor now flashes in that text field. • Change the text as you wish. • Complete your text input by pressing the Enter key. To delete an existing comment: •...
-
Page 175: Logbook
Chapter 5, Reports and records Logbook The logbook creates a tabular overview of blood glucose results, carbohydrates and insulin doses. The table of values (vertically sorted by date and horizontally divided into time blocks) is created according to the mealtime flag and the date and time information of the blood glucose results. - Page 176 Chapter 5, Reports and records You can display detailed information for every entry. • Click an entry for which you would like to have more information. The details for this entry are displayed: • For blood glucose: date, time, test result, flag (before/ after meal, if applicable), comment.
-
Page 177: Daily Statistics
Chapter 5, Reports and records Daily statistics The Daily statistics table is set up chronologically with columns divided into blood glucose or CGM results, carbohydrates and insulin. The associated statistical values (mean values, numbers, and so on) are entered for each day. Blood glucose pane •... - Page 178 Chapter 5, Reports and records Carbohydrates pane Carbohydrates: Amount of carbohydrates consumed • on this day. Insulin pane Insulin: Total amount of insulin delivered (bolus and • basal). • Basal: Total amount of basal insulin delivered. • Bolus: Total amount of bolus insulin delivered. •...
-
Page 179: Bibliography For Reports
Chapter 5, Reports and records Bibliography for reports HBGI / LBGI Kovatchev BP, Cox DJ, Gonder-Frederick LA, Symmetrization of the blood glucose measurement scale and its Clarke WL (1997) applications. Diabetes Care, 20, 1655-1658 Kovatchev BP, Cox DJ, Gonder-Frederick LA, Assessment of Risk for Severe Hypoglycemia Among Adults Young-Hyman D, Schlundt D and Clarke WL (1998) with IDDM: Validation of the Low Blood Glucose Index. -
Page 180: Blood Glucose Target Range
Chapter 5, Reports and records Blood glucose target range American Diabetes Association and The Endocrine Hypoglycemia and Diabetes: Consensus Report. Society Workgroup Diabetes Care 36 (5): 1384-1395. AACE/ACE Diabetes Guidelines Clinical Practice Guidelines – 2015. Endocrine Practice 21 (Supplement 1) 8-9. American Diabetes Association Standards of Medical Care in Diabetes 2016, Diabetes Care 39 (Supplement 1): 39-46. -
Page 181: Ambulatory Glucose Profile
Chapter 5, Reports and records Ambulatory Glucose Profile Bergenstal RM, Ahmann AJ, Bailey T, et al. (2013) Recommendations for standardizing glucose reporting and analysis to optimize clinical decision making in diabetes: the ambulatory glucose profile. J Diabetes Sci Technol. 2013; 7 (2): 562-578. Matthaei S, Dealaiz RA, Bosi E, Evans M, Consensus recommendations for the use of Ambulatory Glucose Geelhoed-Duijvestijn, M J. - Page 182 Chapter 5, Reports and records...
-
Page 183: Preparing The Devices
Chapter 6, Preparing the devices Preparing the devices The Accu-Chek Smart Pix system can read and analyse data from the following blood glucose meters: Via USB port: • Accu-Chek Active (model GU, GB) • Accu-Chek Aviva Connect • Accu-Chek Aviva Insight •... - Page 184 Accu-Chek Smart Pix system: • Accu-Chek Insight • Accu-Chek Spirit • Accu-Chek Spirit Combo The Accu-Chek Smart Pix system can import CGM results from the following systems: • Accu-Chek Insight CGM system Note: Not all products are available in all countries.
- Page 185 Chapter 6, Preparing the devices In some cases, these devices require different preparation in order to be able to transfer data to the Accu-Chek Smart Pix system. On the following pages, you will find a description of the procedure for each device to analyse stored data successfully.
- Page 186 The computer is switched on and the operating system is running. • In the Accu-Chek Smart Pix software, you have clicked Read device or activated the automatic import. • The Accu-Chek Smart Pix device is ready for data transfer when the luminous surface pulsates slowly.
-
Page 187: Accu-Chek Active Blood Glucose Meter
• Place the device no more than 10 cm away from the infrared window on the Accu-Chek Smart Pix device. Both infrared windows must be facing one another. Switch the meter on by keeping the M button pressed •... - Page 188 • Connect the micro B plug of the USB cable to the meter. • If you are not using the Accu-Chek Smart Pix device (model 2): Connect the USB A plug to a USB port on your computer. • The meter connects to the computer. “PC” flashes on the display.
-
Page 189: Accu-Chek Aviva Blood Glucose Meter Accu-Chek Aviva Nano Blood Glucose Meter
• Place the device no more than 10 cm away from the infrared window on the Accu-Chek Smart Pix device. Both infrared windows must be facing one another. • Switch the meter on by keeping the buttons pressed simultaneously until two alternately flashing arrows appear on the display. -
Page 190: Accu-Chek Aviva Combo Blood Glucose Meter Accu-Chek Aviva Expert Blood Glucose Meter
• Place the device no more than 10 cm away from the infrared window on the Accu-Chek Smart Pix device. Both infrared windows must be facing one another. • In the main menu, select My Data and press... -
Page 191: Accu-Chek Aviva Insight Diabetes Manager
Connect the micro B plug of the USB cable to the meter. 9:29 am 10 Feb 2011 • If you are not using the Accu-Chek Smart Pix device Communication (model 2): Connect the USB A plug to a USB port on Connect to PC Connection Options... -
Page 192: Accu-Chek Compact Blood Glucose Meter
• Place the device no more than 10 cm away from the infrared window on the Accu-Chek Smart Pix device. Both infrared windows must be facing one another. Switch the meter on by pressing the SET and MEMO •... -
Page 193: Accu-Chek Compact Plus Blood Glucose Meter
• Place the device no more than 10 cm away from the infrared window on the Accu-Chek Smart Pix device. Both infrared windows must be facing one another. Switch the meter on by pressing the S and M buttons •... -
Page 194: Accu-Chek Go Blood Glucose Meter
• Place the device no more than 10 cm away from the infrared window on the Accu-Chek Smart Pix device. Both infrared windows must be facing one another. Switch the meter on by keeping the M button pressed •... -
Page 195: Accu-Chek Guide Blood Glucose Meter
• Connect the micro B plug of the USB cable to the meter. • If you are not using the Accu-Chek Smart Pix device (model 2): Connect the USB A plug to a USB port on your computer. • The meter turns on and connects to the computer. -
Page 196: Accu-Chek Instant Blood Glucose Meter Accu-Chek Instant S Blood Glucose Meter
• Connect the micro B plug of the USB cable to the meter. • If you are not using the Accu-Chek Smart Pix device (model 2): Connect the USB A plug to a USB port on your computer. • The meter connects to the computer. “PC” flashes on the display. -
Page 197: 6.10 Accu-Chek Mobile Blood Glucose Meter
In order to read data from these devices, proceed as follows: • Place the device no more than 10 cm away from the infrared window on the Accu-Chek Smart Pix device. Both infrared windows must be facing one another. • Keep the buttons pressed until the meter turns on. - Page 198 Connect the micro B plug of the USB cable to the Data transfer meter. Connecting • If you are not using the Accu-Chek Smart Pix device (model 2): Connect the USB A plug to a USB port on Data transfer your computer. Transferring data •...
-
Page 199: Accu-Chek Performa Blood Glucose Meter Accu-Chek Performa Nano Blood Glucose Meter
• Place the device no more than 10 cm away from the infrared window on the Accu-Chek Smart Pix device. Both infrared windows must be facing one another. • Switch the meter on by keeping the buttons pressed simultaneously until two alternately flashing arrows appear on the display. -
Page 200: 6.12 Accu-Chek Performa Combo Blood Glucose Meter
• Place the device no more than 10 cm away from the infrared window on the Accu-Chek Smart Pix device. Both infrared windows must be facing one another. • In the main menu, select My Data and press... -
Page 201: 6.13 Accu-Chek Performa Insight Diabetes Manager
Connect the micro B plug of the USB cable to the meter. 9:29 am 10 Feb 2011 • If you are not using the Accu-Chek Smart Pix device Communication (model 2): Connect the USB A plug to a USB port on Connect to PC Connection Options... -
Page 202: 6.14 Accu-Chek Insight Insulin Pump
Chapter 6, Preparing the devices 6.14 Accu-Chek Insight insulin pump Communication with an Accu-Chek Insight insulin pump takes place exclusively via the Accu-Chek Aviva Insight diabetes manager or the Accu-Chek Performa Insight diabetes manager. The Bluetooth connection of these devices which are used together normally takes place during power up. -
Page 203: 6.15 Accu-Chek Spirit Insulin Pump
• Place the device no more than 10 cm away from the infrared window on the Accu-Chek Smart Pix device. Both infrared windows must be facing one another. Make sure that your insulin pump is in STOP mode. -
Page 204: 6.16 Accu-Chek Spirit Combo Insulin Pump
• Place the device no more than 10 cm away from the infrared window on the Accu-Chek Smart Pix device. Both infrared windows must be facing one another. Make sure that your insulin pump is in STOP mode. -
Page 205: 6.17 Note On Time Settings For The Accu-Chek Insulin Pumps
(i.e. the programmed period of time has not yet elapsed). In this case, the Accu-Chek Smart Pix system may not be able to analyse the stored insulin pump data. Therefore, only change the time set in your insulin pump if it is in STOP mode. - Page 206 If you are using your insulin pump together with a blood glucose meter and want to analyse the data of both devices using the Accu-Chek Smart Pix system, always change the time for all devices at once. This ensures that the informa- tion represented in the reports is assigned correctly.
-
Page 207: 6.18 Accu-Chek Insight Cgm System
• Connect the USB A plug to a USB port on your computer. • Start the data transfer in the Accu-Chek Smart Pix software using the Read device button. • When data transfer has been completed, you can remove the USB cable. - Page 208 Chapter 6, Preparing the devices...
-
Page 209: Error Signals And Troubleshooting
Chapter 7, Error signals and troubleshooting Error signals and troubleshooting Sometimes situations can occur in which a report is not created or printed, or other problems arise. We would like to provide you with several solutions below for most conceiva- ble situations in which a problem might occur. -
Page 210: Errors Without Error Signals
Chapter 7, Error signals and troubleshooting Errors without error signals The Accu-Chek Smart Pix system fails to appear on the PC as a drive: • Check whether your PC or operating system meets the system requirements for the Accu-Chek Smart Pix system (see page 2). -
Page 211: Error Signals On The Device
• If the error signal continues, you can unplug the Accu-Chek Smart Pix device and plug it back in again. Any Microsoft Windows error message about removing the disk is of no further consequence. - Page 212 In the event of error messages associated with data transfer, it is not the Accu-Chek Smart Pix system which is faulty, there is interference with the data transfer between the devices. In individual cases, this may be due to the meter or...
-
Page 213: Appendix
Chapter 8, Appendix Appendix Cleaning the device Unplug the Accu-Chek Smart Pix device before cleaning it. Use cloths slightly moistened with cleaning agent and make sure no liquid gets inside the device. Clinical staff: Observe the regulations applicable at your institution concerning protection against infection. -
Page 214: Disposal Of The Usb Flash Drive
Using a USB flash drive Important note: Do not remove the USB flash drive containing the Accu-Chek Smart Pix software while data is being exchanged. Doing so could cause irreparable damage to files. The USB flash drive itself could be damaged, rendering it unusable. -
Page 215: Abbreviations
Chapter 8, Appendix Abbreviations Ambulatory Glucose Profile Alternative site testing Blood glucose Continuous glucose monitoring HBGI High blood glucose index Result above the measuring range (indicated on the meter as HI) Hypo Hypoglycaemia Interquartile range LBGI Low blood glucose index Result below the measuring range (indicated on the meter as LO) Standard deviation Temporary basal rate... - Page 216 Chapter 8, Appendix...
-
Page 217: Accu-Chek Smart Pix Software Terms Of Use
Chapter 9, Accu-Chek Smart Pix software Terms of Use Accu-Chek Smart Pix software Terms of Use The use of the Accu-Chek Smart Pix software is subject to the following provisions (“Terms of Use”). Data Protection, Privacy and Data Backup Roche Diabetes Care GmbH, Sandhofer Strasse 116, 68305 Mannheim, Germany (“Roche”) does not have any access to... - Page 218 Accu Chek Smart Pix software are the property of Roche and its licensors. Roche retains all rights not expressly granted herein. Limitation of Liability Irrespective of the cause of action, Roche’s liability shall be...
- Page 219 Chapter 9, Accu-Chek Smart Pix software Terms of Use Miscellaneous These Terms shall be governed by the laws of Germany; the application of the UN Convention on Contracts for the International Sale of Goods and private international law is excluded.
- Page 220 Chapter 9, Accu-Chek Smart Pix software Terms of Use...
-
Page 221: 10 Customer Support
Chapter 10, Customer support 10 Customer support Importado y distribuido por: Argentina Roche Diabetes Care Argentina S.A. (República Argentina) Otto Krause 4650 – Dock 25 – Tortuguitas Pdo. de Malvinas Argentinas – Pcia. de Bs.As. Centro de servicio y atención al cliente: 0800-333-6081 o 0800-333-6365 www.accu-chek.com.ar... - Page 222 Chapter 10, Customer support Centro de Atención al Cliente: 800-000-3422 Costa Rica www.accu-chek.com (Costa Rica) Služba podrške za korisnike: Croatia Besplatna telefonska linija: 0800 60 00 60 (Hrvatska) Informace na bezplatné lince 800 111 800 Czech Republic www.accu-chek.cz (Česká republika) Accu-Chek Kundeservice: Denmark Tlf.
- Page 223 ()מדינת ישראל Tel. 04-6175390 www.dyndiabetes.co.il Servizio Assistenza: Italy Numero Verde 800 822 189 (Italia) www.accu-chek.it Roche Kazakhstan LLP Kazakhstan 77, Kunaev street, 15 floor (Republic of Kazakhstan) BC “Parkview office Tower” 050000, Almaty Klientu atbalsta un apkalpošanas centrs: Latvia Bezmaksas informatīvais tālrunis 80008886 (Latvija) www.accu-chek.lv...
- Page 224 Chapter 10, Customer support Centro de Atención al Cliente: 800-3422 Panama www.accu-chek.com (Panamá) Centro de Atención al Cliente: Peru 0800 00 388 y/o 618 8777 (Perú) www.accu-chek.com.pe Obsługa klienta: Poland Telefon: +48 22 481 55 55 (Polska) www.accu-chek.pl Infolinia na terenie Polski: 801 080 104* * Opłata za połączenie jest zgodna z planem taryfikacyjnym danego operatora Linha de Assistência a Clientes 800 200 265 (dias úteis: 8h30 –...
- Page 225 Chapter 10, Customer support Roche Diabetes Care South Africa (Pty) Ltd South Africa Hertford Office Park, Building E (South Africa) No 90 Bekker Street, Vorna Valley 1686 South Africa Accu-Chek Customer Care Centre: 080-DIABETES (Dial 080-34-22-38-37) www.diabetes.co.za South Korea 고객 지원 및 서비스 센터...
- Page 226 Telefon: +90 212 306 06 06 Müşteri Danışma Hattı: 0800 211 36 36 (ücretsiz) 0850 211 36 36 www.rochediagnostics.com.tr ÜRETİCİ FİRMA Roche Diabetes Care GmbH Sandhofer Strasse 116 68305 Mannheim, Germany www.accu-chek.com İTHALATÇI FİRMA Roche Diagnostics Turkey A.Ş. Esentepe Mahallesi Kırgülü Sokak No: 4 34394 Şişli, İstanbul...
- Page 227 Chapter 10, Customer support Importado y Distribuido por: Venezuela Productos Roche S.A. (Venezuela) Torre la Castellana Av. Principal de la Castellana con calle José Ángel Lamas, oficina nivel PH La Castellana, Caracas 1060. Línea Gratuita: 0800gliCmia (0800-4542642) RIF: J-00044058-1...
- Page 228 ACCU-CHEK AVIVA EXPERT, ACCU-CHEK AVIVA NANO, ACCU-CHEK AVIVA INSIGHT, ACCU-CHEK GO, ACCU-CHEK GUIDE, ACCU-CHEK INSIGHT, ACCU-CHEK INSTANT, ACCU-CHEK MOBILE, ACCU-CHEK NANO, ACCU-CHEK PERFORMA, ACCU-CHEK SPIRIT, ACCU-CHEK SPIRIT COMBO, ACCU-CHEK SMART PIX, COMBO, PERFORMA COMBO, PERFORMA CONNECT, PERFORMA INSIGHT and PERFORMA NANO are trademarks of Roche.
Need help?
Do you have a question about the Accu-Chek Smart Pix and is the answer not in the manual?
Questions and answers