
Related Manuals for Accedian EtherNID EE

Summary of Contents for Accedian EtherNID EE
- Page 1 EtherNID™ Administrator’s Guide for the EtherNID™ EE EtherNID™ GE MetroNID™ TE MetroNID™ TE-R MetroNID™ TE-S...
- Page 2 Fax: (514) 331-2210 Toll free: 1-866-685-8181 Accedian Networks Inc. may use or distribute whatever information you supply in any way it believes appropriate without incurring any obligations to you. Copyright © 2005-2009 Accedian Networks Inc. All rights reserved, including those to reproduce this publication or...
-
Page 3: Table Of Contents
Contents 1 INTRODUCTION ..........................9 Introducing the EtherNID..................................9 Features and benefits....................................10 Applications ......................................10 Application scenario ....................................11 About this scenario: .....................................11 2 HARDWARE INSTALLATION ......................12 Hardware overview....................................12 Front panel ......................................13 Ethernet ports.......................................13 SFP ports......................................13 Port functionality ....................................13 Status lights......................................16 Rear panel ......................................16 Port/Connectors ....................................16 Status light ......................................17 Buttons.........................................17... - Page 4 Creating additional accounts................................28 DNS settings......................................29 Use DHCP results ....................................29 Set DNS manually ....................................29 Configuring interfaces ...................................30 Creating or editing an interface................................30 Interface settings ....................................31 Beacon settings ....................................33 Auto interface settings ..................................34 Discovery settings....................................34 Advertisement settings..................................35 Discovery inventory.....................................36 Routes........................................37 Adding a route .....................................37 Route parameters ....................................38 Syslog options ......................................39 Syslog parameters ....................................39...
- Page 5 Session configuration .....................................63 Session parameters....................................63 Session RADIUS.....................................65 RADIUS parameters ....................................65 Show CPU usage ....................................67 CPU usage parameters ..................................67 Management bridge ....................................68 Configuration procedure ..................................68 4 PORT CONFIGURATION........................70 Port list and port status ..................................70 Port configuration and status................................74 Port options ......................................74 Fault propagation ....................................75 Configuring port settings ..................................76 Port parameters ....................................78...
- Page 6 Layer-2 Protocol Tunneling ..................................99 Adding a new L2PT Rule .................................. 101 L2PT rule settings....................................101 Traffic policies and monitoring ................................104 Configuring a traffic policy................................105 Policy settings ....................................105 Traffic filters ......................................110 Viewing L2 filters ....................................110 Configuring an L2 filter ..................................110 L2 filter parameters....................................
- Page 7 Viewing RFC-2544 Generator ................................146 Configuring RFC-2544 Generator ..............................147 RFC-2544 monitor ....................................151 Viewing RFC-2544 Monitor................................151 Detailed view of RFC-2544 Monitor ..............................151 RFC-2544 testsuite ....................................154 Viewing RFC-2544 Testsuites ................................154 Detailed view of RFC-2544 Testsuites .............................. 155 RFC-2544 reports ....................................
- Page 8 Alarms........................................199 1 APPENDIX B - MIB SUPPORT .....................203 Public MIBs ......................................203 Private MIBs ......................................205...
-
Page 9: Introduction
All of this while optimizing end-to-end Network Performance and keeping capital expenses at a minimum. Accedian's EtherNID Demarcation Point offers a solution to address these challenges by implementing standards-based Ethernet OAM and loop-back capabilities as part of the industry's first Line-Powered Ethernet NID (patent pending). -
Page 10: Features And Benefits
1: Introduction Features and benefits • Ethernet OAM & loop-back — Increases visibility, management and easier maintenance. • Fail-safe Bypass — No impact on the MTBF of the E-Line • Fast-Thru ™ Architecture — Minimizes Packet Jitter and Latency, (important for Video & VoIP) •... -
Page 11: Application Scenario
1: Introduction Application scenario The following scenario illustrates how the EtherNID can be used to provide a remotely manageable customer premises demarcation point for the delivery of Ethernet services. About this scenario: • Remote Management station is a computer that is used to remotely manage the EtherNID and to setup loopbacks. -
Page 12: Hardware Installation
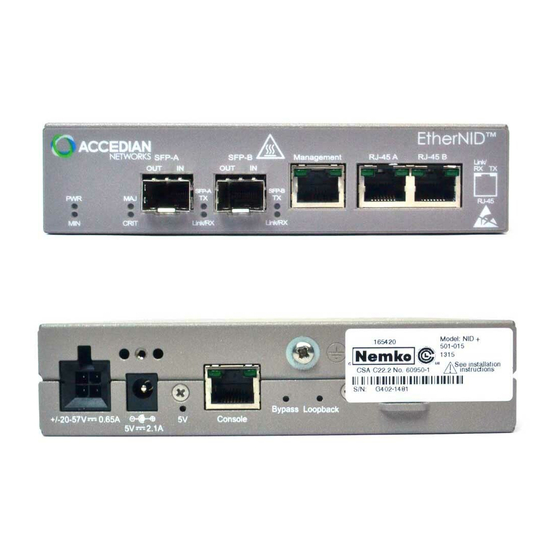
2: Hardware Installation 2 Hardware Installation Hardware overview Front panel - EtherNID EE Front panel - EtherNID GE Front panel - MetroNID TE-S Front panel - MetroNID TE / TE-R Rear panel - All units... -
Page 13: Front Panel
2: Hardware Installation Front panel The front panel features different ports and status lights depending on the model. Ethernet ports All Ethernet ports are 10/100/1000BaseT or 10/100BaseT Ethernet, depending on the model, supporting auto-negotiation, auto-MDIX and have RJ-45 connectors. Each port has two indicator lights as follows: Light Solid Flashing... - Page 14 The following describes the factory default configuration settings for all ports. Use the management web interface to change these settings as required by your installation. EtherNID EE • Management: For connection of a local management station. By default, this port is set to the static IP address 192.168.1.254/24 and connection is made by using an SSL or SSH Client.
- Page 15 2: Hardware Installation EtherNID GE / MetroNID TE / TE-R • SFP-A: By default, this port is configured for connection to the client network. Configuration can be changed using the management web interface. • SFP-B: By default this port is configured for traffic monitoring. •...
-
Page 16: Status Lights
2: Hardware Installation Status lights • PWR (green): On when power is applied. • LPBK (yellow): On when the loopback function is enabled. Flashes when traffic is being looped-back. • MIN (yellow): On when a minor alarm condition is present. •... -
Page 17: Status Light
2: Hardware Installation RJ-45 Connector DB-9 Connector Pins # Signals Pins # Signals Not connected Not connected Tx Data Rx Data Ground Ground Ground Ground Rx Data Tx Data Not connected Not connected To establish a connection with the CLI interface on the EMGIR4 from your computer, use a terminal emulation program with the following settings: Protocol: Serial Port: COM1 to 8... -
Page 18: Mounting Options
2: Hardware Installation Mounting options Several different mounting options are available as described in this section. Wall mounting Optional brackets and screws are available for mounting the EtherNID on a wall. Attach the brackets as follows: When mounting the EtherNID on a wall, ensure that: •... -
Page 19: Rack Mounting
2: Hardware Installation Rack mounting To install the EtherNID in a standard 19” rack, attach the optional 1U rack mount bracket as shown. An optional 1U bracket is available that can hold two units. Grounding the EtherNID Connect the EtherNID to a ground point on the rack as follows: 1. -
Page 20: Ethershelf
2: Hardware Installation EtherSHELF The EtherSHELF, an optional 12 unit, 4U shelf is available for large-scale installations. To mount an EtherNID in the EtherSHELF, L-shaped brackets must be attached to the left and right side of the unit. Grounding the EtherSHELF Connect the EtherSHELF to a ground point on the rack as follows: 1. -
Page 21: Dimensions
2: Hardware Installation 5. Use a small wrench to tighten the bolts around the two grounding screws to secure the two-hole grounding lug to the back of the EtherSHELF 6. Connect the other end of the wire to a grounding point on the rack. Dimensions The EtherSHELF is a 4U chassis for 19 inch racks with available side extenders for 23 inch racks. -
Page 22: Powering The Ethernid
2: Hardware Installation Powering the EtherNID The EtherNID can be powered using one of the following options: DC power adapter Connect the supplied power adapter to the 5V/2A DC connector on the rear of the unit. Once installed, attach the strain relief to the center, threaded hole located above the power input with the supplied screw and washer: 48V DC from the 12 unit EtherSHELF You can power EtherNIDs mounted in the EtherSHELF using the shelf’s built-in 48 V DC power connector. -
Page 23: 24V Or 48V Dc From The Terminal Block Adapter
2: Hardware Installation 24V or 48V DC from the Terminal Block Adapter In a 1U rack mount bracket installation, it is sometimes preferable to use 24 or 48V DC power through directly secured wires as opposed to the DC power adapter. The Terminal Block Adapter fastens to the back of the EtherNID to provide such an installation. - Page 24 2: Hardware Installation Isolated +/- 48V Return A and B Isolated +/- 24V Return A and B The power source (+/-40 to +/-57 V DC) must be limited by a 0.5A/48V fast acting fuse or equivalent. There should be one fuse per power feed.
-
Page 25: Restarting
2: Hardware Installation Restarting To restart the EtherNID: 1. Press and hold the Bypass button. 2. Press and release the Loopback button. The unit will restart. 3. Release the Bypass button. If required, the EtherNID can also be restarted using the command line interface. See Chapter 12 for details. Resetting to factory defaults To reset the EtherNID to factory default settings: 1. -
Page 26: Management & Configuration
3: Management & Configuration 3 Management & Configuration About the management web interface The web-based management web interface provides secure access, via an SSL client, to all EtherNID control, management, and monitoring functions. The management station is the computer that you use to connect to the management web interface. To act as a management station, a computer must: •... -
Page 27: Managing Accounts
3: Management & Configuration Managing accounts Administrator accounts are managed on the Session > Users page. Changing the default administrator password 1. Open the Session > Users page and click admin in the list. 2. Specify the new password, confirm it. 3. -
Page 28: Creating Additional Accounts
3: Management & Configuration Creating additional accounts 1. Open the Session > Users page and click Add. 2. In the new user setting box, specify the new user name and other details. 3. Click Apply. -
Page 29: Dns Settings
3: Management & Configuration DNS settings To define DNS options, open the System > DNS page. You can either choose to use the DNS settings obtained via DHCP on a specific port, or manually set DNS settings. Use DHCP results Set DNS manually In either case, you can define the host name for the EtherNID. -
Page 30: Configuring Interfaces
3: Management & Configuration Configuring interfaces The EtherNID lets you define multiple logical interfaces for management purposes that can be active on different ports. This includes defining bridges and VLANs. To see a list of all logical interfaces. Open the System > Interface page. By default, three interfaces are defined: •... -
Page 31: Interface Settings
3: Management & Configuration Different fields will appear depending on the selections you make for Interface type. 3. Define interface parameters as required by your setup and then click Apply. Interface settings NOTE: It is valid to set the IP address for an interface to 0.0.0.0 when the interface is not required to be an IP interface. For example, when the interface is used for OAM or test set interaction. - Page 32 3: Management & Configuration On port(s) Select the port the interface will be active on. In the case of a bridge, select multiple ports by holding down the control key when you click on port names in the list. VLAN ID (Only available when Interface type is set to VLAN or VLANinVLAN.) Specify the VLAN ID (Management VLAN) to assign to the interface.
-
Page 33: Beacon Settings
3: Management & Configuration Beacon settings State Enable or disable the transmission of beacon frames on the interface. This is disabled by default. Beacon rate Used to select at which time interval the beacon frames will be sent. Domain ID The domain ID that will be used in the discovery process. -
Page 34: Auto Interface Settings
3: Management & Configuration One shot beacon When the Send button is pressed, the system will send a single beacon frame with the information that has previously been committed. If changes to the beacon settings have been done without pressing the Apply button, they will not be effective in the beacon frame. -
Page 35: Advertisement Settings
Advertisement format The frame format to use when sending information frames. Only proprietary Accedian ACP format is supported for now. Use rate from beacon When enabled, the advertisement transmission rate will match the rate that is configured in the beacon settings. -
Page 36: Discovery Inventory
3: Management & Configuration Discovery inventory Enable inventory tracking Use this option to enable the gathering of discovery inventory. This will display a table of all units that have advertisement enabled to send an information frame on the network. You can use the hyperlink in the Remote NID IP column to connect to the web server of a remote unit. -
Page 37: Routes
3: Management & Configuration Routes Select System > Interface to open the routes pages, which shows all active routes on the EtherNID. Initially, no routes are defined. Adding a route To add a system route, do the following: 1. Open the System > Routes page. 2. -
Page 38: Route Parameters
3: Management & Configuration Route parameters Name Specify the name to assign to the route. Type Select a route type: • Network • Host Interface Select the interface to which the route is associated. Note: This field is optional if a matching active route is already associated to the interface. -
Page 39: Syslog Options
3: Management & Configuration Syslog options To define syslog options, open the System > Syslog page. The syslog page displays all syslog entries with the most recent entry at the top. Syslog information can be sent to a remote server by setting the options in the Remote Syslog Configuration box. Configure these options as required and then click Apply. -
Page 40: Remote Syslog Configuration
3: Management & Configuration Remote syslog configuration Remote syslog enable Enables the sending of messages to a remote syslog server. Host Specify the IP address or domain name of the remote syslog server. -
Page 41: Setting The System Date And Time
3: Management & Configuration Setting the system date and time To set the system date and time, do the following: 1. Open the System > Configuration > Time page. 2. Specify the current date and time and click Apply or to automatically update the system date and time using the Network Time protocol, select the NTP enable option. -
Page 42: Date And Time Settings
3: Management & Configuration Date and time settings NTP enable Enable this option to set the system time automatically by polling an NTP server. Select a server from the list or add your own. NTP server enable Enable this option to start the NTP server service. High resolution sync Enable this option to use high resolution hardware synchronization. -
Page 43: Timezone And Daylight Saving
3: Management & Configuration Timezone and Daylight saving For a list of time zones and daylight saving time rules, please refer to: http://www.worldtimezone.com/. UTC offset Offset from Coordinated Universal Time. North America would have negative values while Eastern Europe would have positive values. -
Page 44: Snmp Settings
3: Management & Configuration SNMP settings To configure SNMP options, do the following: 1. Open the System > SNMP page. 2. Define SNMP parameters as required by your setup and then click Apply. -
Page 45: Snmp Parameters
3: Management & Configuration SNMP parameters Enable Agent Select this checkbox to enable the SNMP agent. Use host name as system name Select this checkbox to use host's name as system-name. SNMP system name Specify a name to identify the unit. By convention, this is the node's fully-qualified domain name. Contact information Specify contact information for the unit. -
Page 46: Snmp Trap Receivers
3: Management & Configuration SNMP trap receivers To configure SNMP trap options, do the following: 1. Open the System > SNMP > Traps page. -
Page 47: Snmp Trap Receivers Parameters
3: Management & Configuration SNMP trap receivers parameters Type Type of SNMP Trap receivers. SNMPv1 / SNMPv2c ID number of the trap receiver. State If Enabled the unit will send SNMPv1 or SNMPv2c traps to a specified notification receiver. UDP port The UDP port that the unit will use to send traps to the notification receiver. -
Page 48: Snmp Trap Configuration Parameters
3: Management & Configuration SNMP trap configuration parameters Enable trap Enable this option to have the unit send SNMPv1 or SNMPv2c traps to a specified notification receiver. Notification receiver Specify the IP address or host name of the device that will receive SNMP traps (and/or inform notifications). The unit sends a Cold Start trap when it starts up. -
Page 49: History Buckets
3: Management & Configuration History buckets To configure local history bucketing, do the following: 1. Open the System > History page. 2. Define the history parameters as required and then click Apply. Local Configuration Enable history This will start the creation of history files being stored in RAM. These will then be accessible through SNMP. Enable filing This will enable the history files to be stored locally instead of storing this information in the RAM. -
Page 50: Remote Retrieval Of History Buckets
3: Management & Configuration Remote retrieval of history buckets NOTE: The Remote retrieval feature is only available on the MetroNID TE/TE-R/TE-S models. To configure remote retrieval of history buckets, do the following: 1. Open the System > History page on the remote NIDs. 2. -
Page 51: Scheduling And File Transfer Configuration
3: Management & Configuration Scheduling and file transfer configuration NOTE: The remote retrieval is only available on the MetroNID TE / TE-R /TE-S models. Enable remote scheduling Enable the history buckets to be retrieved from a list of remote devices, and report files to be generated. This feature is dependant on the filing check boxes in the Local configuration sections of the remote devices. - Page 52 3: Management & Configuration Local scheduled hours The history buckets will be generated by the local device according to the Scheduled hours selected (Hold CTRL key to select more than one time). Finer granularity is possible using the Scheduled minutes and Schedule offset fields. Local scheduled minutes This allows the local scheduling to be set to trigger every 15 minutes, either on the hourly boundary or on the 00:15, 00:30 and 00:45 boundaries.
- Page 53 3: Management & Configuration Period mode This controls which periods are included in the generated reports. Three modes of operation are available. Note that this setting affects both local and remote history buckets. All available periods: All the periods that are available on the devices are used to generate the reports, up to a fixed maximum number of periods.
-
Page 54: Certificate Management
3: Management & Configuration Certificate management This section allows managing imported SSL certificates. Common name For a certificate authority (CA) it shows the name of the organization that emitted the certificate. For a server, it should show the Fully Qualified Domain name of the service that will be using the certificate (only the web server at this time). -
Page 55: Ping And Traceroute
3: Management & Configuration Ping and Traceroute This section allows the use of the ping and traceroute commands. Open the System > Maintenance > System Tools page. IP address Specify the IP address to PING Timeout Number of PING messages to send (maximum count is 10). IP address Specify the IP address to TRACEROUTE Hops... -
Page 56: General System Settings
3: Management & Configuration General system settings To change the general settings of the unit do the following: Open the System > Configuration > Mode page. Current operation mode In the case where a product supports more than one operation mode, this field displays the currently active mode. Next operation mode You can select the next operation mode to apply to this board after the next reboot. -
Page 57: Aggregator Operation Modes
3: Management & Configuration Aggregator operation modes NOTE: Aggregator modes are only available on MetroNID TE and TE-S models. From the System > Configuration > Mode page, selecting the next operation mode will result in a warning that the Next operation mode will be active after reboot. - Page 58 3: Management & Configuration Aggregator 2x1 When in Aggregator4x1 mode, all four Client port’s traffic (4x100Mbps) will be forwarded out the Network port (1Gbps). When in Aggregator2x1 mode, both Client port’s traffic (2x1Gbps) will be forwarded out the Network port (1Gbps) with equal priority.
-
Page 59: Session Management
3: Management & Configuration Session management To configure session management options, do the following: 1. Open the Session > Management page. 2. Define session management parameters as required by your setup and then click Apply. Management parameters Writelock session The management web interface supports multiple concurrent users, therefore to maintain the integrity of the configuration settings, only one user at a time has the ability to make changes. - Page 60 3: Management & Configuration Uptime Indicates how long the session has been active. Writelock Indicates which session has the ability to make configuration changes. Terminate Select one or more sessions and then click the Terminate button to force a log out.
-
Page 61: Firmware Upgrade
3: Management & Configuration Firmware upgrade To upgrade the EtherNID firmware, do the following: 1. Open the System > Maintenance > Firmware page. 2. Specify the location and name of the new firmware file or click Browse and select it. 3. -
Page 62: System Control
3: Management & Configuration Export a configuration as follows: 1. Enter a filename for the configuration file in the text box. 2. Click Export. Export a Vision EMS PPT file as follows: 1. Enter a filename for the PPT configuration file in the text box. The PPT file will be exported as a compressed ZIP file. 2. -
Page 63: Session Configuration
3: Management & Configuration Session configuration To configure session options, do the following: 1. Open the System > Session > Configuration page. 2. Define session parameters as required by your setup and then click Apply. Session parameters Max CLI sessions Specify the maximum number of CLI sessions that are supported at the same time. - Page 64 3: Management & Configuration Authentication Order Authentication method to use in order of availability. Refer to RADIUS configuration page for server configuration instructions. This parameter is described in the RADIUS section below on page 35.
-
Page 65: Session Radius
3: Management & Configuration Session RADIUS To configure RADIUS authentication, do the following: 1. Open the Session > RADIUS page. 2. Define RADIUS parameters as required by your setup and then click Apply. RADIUS parameters Authentication method Authentication method to use. This can be one of the following methods: •... - Page 66 3: Management & Configuration Server-1 / Server-2 Host RADIUS server host-name or IPV4 address. Port RADIUS server UDP port to connect to. Secret Shared secret for this RADIUS server. Radius server configuration When RADIUS authentication is enabled, the unit supports Authentication and Authorization as configured on the RADIUS server.
-
Page 67: Show Cpu Usage
3: Management & Configuration Show CPU usage Indicates the CPU usage average over a period of time. Open the Show > CPU usage page. CPU usage parameters Current The CPU usage over the last second. 15 seconds average The CPU usage average integrated from the last completed period of 15 seconds. 30 seconds average The CPU usage average integrated from the last completed period of 30 seconds. -
Page 68: Management Bridge
3: Management & Configuration Management bridge This section describes how to set up a bridged management port using the command line interface. A minimum of two EtherNIDs are required for this setup. An out-of-band EtherNID management port will be used to manage the other EtherNIDs, in-band through a bridged interface. - Page 69 3: Management & Configuration 6. Delete any existing interfaces with the following commands: interface delete Management interface delete Network 7. The Network port of EtherNID #1 will be used for the in-band management. Configure the Network port with the following command: interface add net1-10 type vlan vlan1-id 10 port Network address 192.168.1.253 netmask 255.255.255.0 8.
-
Page 70: Port Configuration
To view a list of all ports and their status, open the Port > Configuration page. • You will see the following page on an EtherNID EE: • You will see the following page on an EtherNID GE or MetroNID TE / TE-R / TE-S:... - Page 71 4: Port configuration...
- Page 72 4: Port configuration • You will see the following page on a MetroNID TE / TE-S when in Aggregator4x1 mode: NOTE: On a TE-S the ports will be SFP-A, SFP-B, SFP-C, SFP-D...
- Page 73 4: Port configuration • You will see the following page on a MetroNID TE / TE-S when in Aggregator2x1 mode: NOTE: On a TE-S the ports will be SFP-A, SFP-B, SFP-C, SFP-D...
-
Page 74: Port Configuration And Status
4: Port configuration Port configuration and status Status Indicates the status of the port. • Green: The port is up and running. • Blue: The port is enabled and a signal is detected. • Red: The port is enabled but the physical link is down and no signal is detected. •... -
Page 75: Fault Propagation
4: Port configuration These four options are available on the MetroNID TE-S: • SFP-A with SFP-B • SFP-A with SFP-D • SFP-C with SFP-B • SFP-C with SFP-D If you change the setting and then click Apply, all the associations between connectors and ports will be reflected in the Port configuration and status table. -
Page 76: Configuring Port Settings
4: Port configuration Configuring port settings To configure port settings, do the following: 1. Open the Port > Configuration page. 2. Click the name of the port that you want to configure. The port configuration page will open. If you are configuring a copper port it will be similar to the following page:... - Page 77 4: Port configuration If you are configuring an SFP fiber port it will be similar to the following page: The Network port will give you the option of setting up Link or LACP status Protection: 3. Define port parameters as required by your setup and then click Apply.
-
Page 78: Port Parameters
4: Port configuration Port parameters Enable Select this check box to enable the port. Name Specify a name to identify the port. By default, ports are named as follows: Management, Client, Network, Monitor-1 and Monitor-2. Alias This is an 'alias' name for the port as specified by a network manager. Port MTU Specify the maximum transmission unit. - Page 79 4: Port configuration Working connector Selects the working connector for the specified port. The connector choice allows the user to perform a switchover operation. Revertive (Link status Mode only) If enabled, the traffic is switched back to the main connector after the Revert period has expired. Revert period Specifies the time, in seconds, that we must continuously detect a signal on the main connector.
- Page 80 4: Port configuration Flow control Specify if pause frames are processed locally, transparently passed through or disabled. When enabled and auto-negotiation is also enabled, the exact behavior depends on auto-negotiation results. Current status Reports the following for Ethernet ports: • Current link speed and duplex type when Auto-negotiation enable is selected.
-
Page 81: Port Statistics
4: Port configuration Port statistics To view port statistics, do the following: 1. Open the Port > Statistics page. 2. Click the name of a port to view detailed statistics. For example, if you click the Client port name on an EtherNID GE or MetroNID TE / TE-R /TE-S you will see a page similar to the following:... -
Page 82: Phy Auto-Negotiation Configuration
4: Port configuration PHY auto-negotiation configuration To configure PHY auto-negotiation settings, do the following: 1. Open the Port > PHY page. - Page 83 4: Port configuration 2. Click the name of a port that you want to configure. For example, if you click the Client port name you will see the following page. 3. Define PHY parameters as required by your setup and then click Apply. NOTE: Advertised parameters are checked and parameters that are not configurable are grayed-out based on the capabilities of the port.
-
Page 84: Phy Parameters
4: Port configuration PHY parameters Advertisement configuration Sets the abilities that are advertised to the link partner. Supported options include: • 10Mbps Half • 100Mbps Half • 1Gbps Half • 10Mbps Full • 100Mbps Full • 1Gbps Full • Pause Symmetric •... -
Page 85: Sfp Information
4: Port configuration SFP information (Supported only on the EtherNID GE / MetroNID TE / TE-R / TE-S) To view SFP information, do the following: 1. Open the Port > SFP page. 2. Click the name of the port for which you want to view detailed statistics. Refer to the following sections for more information. -
Page 86: Monitoring Information
4: Port configuration Wave Length Indicates the nominal transmitter output wavelength at room temperature in nm. Part number Indicates the vendor part number or product name. This is a 16-byte field that contains ASCII characters padded on the right with ASCII spaces (20h). Serial number Indicates the vendor serial number for the transceiver. -
Page 87: Sfp Thresholds
4: Port configuration Transmit power Measured coupled TX output power. Accuracy is vendor specific but must be better than 3dB over specified operating temperature and voltage. Data is assumed to be based on measurement of a laser monitor photodiode current. Data is not valid when the transmitter is disabled. -
Page 88: Vcc
4: Port configuration High warning High Warning transceiver temperature. Low warning Low Warning transceiver temperature. High alarm High Alarm transceiver supply voltage. Low alarm Low Alarm transceiver supply voltage. High warning High Warning transceiver supply voltage. Low warning Low Warning transceiver supply voltage. Laser bias current High alarm High Alarm TX bias current in micro-Amps. -
Page 89: Rx Power
4: Port configuration High warning High Warning TX output power in dBm (~ -40 to +8.2 dBm). Low warning Low Warning TX output power in dBm (~ -40 to +8.2 dBm). Rx power High alarm High Alarm Rx input power in dBm (~ -40 to +8.2 dBm). Low alarm Low Alarm Rx input power in dBm (~ -40 to +8.2 dBm). -
Page 90: Sfp Memory And Monitor Memory
4: Port configuration SFP memory and monitor memory SFP memory The SFP serial ID provides access to sophisticated identification information that describes the transceivers capabilities, standard interfaces, manufacturer, and other information. Refer to INF-8074 for detailed descriptions of the individual data fields. -
Page 91: Cable Verification
4: Port configuration Cable verification The EtherNID uses Time Domain Reflectometry (TDR) to determine the quality of cables, connectors, and terminations. Some of the possible problems that the EtherNID can diagnose are: opens, shorts, cable impedance mismatch, bad connectors, and termination mismatch. Testing a cable To perform a cable test, do the following: 1. - Page 92 4: Port configuration When completed, test status will be one of the following: GOOD: Normal cable. SHORT: Indicates that the positive and the negative lines of the same cable pair are touching: Possible causes include: Cable wire may be touching the wire closet patch panel. Cable may be worn or broken allowing the positive and negative lines to touch.
-
Page 93: Monitoring & Filtering
5: Monitoring & Filtering 5 Monitoring & Filtering Service mapping The EtherNID can perform EVC mapping (which is essentially a VLAN push), CoS mapping and Bandwidth Policing mapping. These options can be used together or separately. Prior to creating CoS profiles and/or Bandwidth regulator sets, appropriate filters and bandwidth regulators will need to be created. -
Page 94: Configuring A Cos Profile
5: Monitoring & Filtering IP precedence DSCP Reference count The reference count is the number of policies that are currently using this CoS profile. Configuring a CoS Profile Once a Cos profile is created, it can be applied to policies for traffic classification. To configure a CoS profile, do the following: 1. -
Page 95: Cos Profile Parameters
5: Monitoring & Filtering CoS Profile parameters Name Name of the CoS profile. Type Indicates the type of CoS profile. Possible values are: IP precedence DSCP Decode DEI This field is only valid for PCP CoS profiles. If this field is set, the pre-marking color is decoded from the DEI bit (Drop Eligible Indication). -
Page 96: Assigning A Cos Profile To A Policy
5: Monitoring & Filtering Assigning a CoS profile to a policy Once a CoS profile has been configured you can assign it to a policy. See Traffic policies and monitoring on page 104. Viewing Bandwidth regulator sets To view a list of configured Bandwidth regulator sets, open the Traffic > Mapping page. Index Bandwidth regulator set's unique identifier. -
Page 97: Configuring A Bandwidth Regulator Set
5: Monitoring & Filtering Configuring a Bandwidth regulator set Once a Bandwidth regulator set is created, it can be applied to policies for traffic classification. To configure a Bandwidth regulator set, do the following: 1. Open the Traffic > Mapping page. 2. -
Page 98: Assigning A Bandwidth Regulator Set To A Policy
5: Monitoring & Filtering Reference count (only visible on existing sets) The reference count is the number of policies that are currently using this Bandwidth regulator set. Regulator set This table has three columns and N rows, where N depends on the type of the regulator set. If the type is PCP or IP precedence then N=8. -
Page 99: Layer-2 Protocol Tunneling
5: Monitoring & Filtering Layer-2 Protocol Tunneling The Layer-2 Protocol Tunneling feature allows the customer's layer-2 control protocol (L2CP) frames to be transparently transported across an EVC without interfering with the carrier/operator network and equipment. The protocol tunneling operates by replacing the protocol's specific destination MAC address with a multicast address that is transparently transported by the transit equipment, and reinserting the original destination MAC when the traffic reaches the destination equipment. - Page 100 5: Monitoring & Filtering EVC Mapping This allows the forwarding rules to perform VLAN tagging on the forwarded frames. Possible values are: None: frames matching the specific rule are forwarded unmodified. Push: frames matching the specific rule are forwarded with an extra VLAN tag determined by the VLAN ID field and their Ethernet type is set to the value specified by the VLAN ethertype field.
-
Page 101: Adding A New L2Pt Rule
5: Monitoring & Filtering Adding a new L2PT Rule To add or edit an L2PT rule, do the following: 1. Open the Traffic > L2PT page. 2. Click the Add button to add a new rule or click on the rule name to edit an existing rule. L2PT rule settings Enable L2PT rule Allows a rule to be enabled or disabled without being deleted. - Page 102 5: Monitoring & Filtering • The Accedian replacement: 01:15:AD:CC:xx:yy MAC is used. Because this replacement MAC has variable elements, it can be used on multiple rules as the variable elements allow a match to a specific rule when a tunneled frame ingresses the network port. These variable elements are set as such: xx: the unique ID specified in the configuration (see below).
- Page 103 5: Monitoring & Filtering VLAN1 ethertype Allows selecting the ethertype of the first tag inserted in the tunneled frame. This is available only when the Tunneling operation mode is selected. VLAN2 ethertype Allows selecting the ethertype of the second tag inserted in the tunneled frame (for Q-in-Q). This is available only when the Tunneling operation mode is selected.
-
Page 104: Traffic Policies And Monitoring
5: Monitoring & Filtering Traffic policies and monitoring To view a list of all traffic policies and their settings, open the Traffic > Policies page. This page shows the access policy rules that are enabled for a specific port. For example, if the Network port is selected then this is the list of policy rules that are enabled or disabled for the Network port. -
Page 105: Configuring A Traffic Policy
5: Monitoring & Filtering Configuring a traffic policy To configure a traffic policy, do the following: 1. Open the Traffic > Policies page. 2. Click the policy entry that you want to configure. 3. Configure policy settings and click Apply. Policy settings Enable policy Select this check box to activate the policy. - Page 106 5: Monitoring & Filtering L2 filter / IPv4 filter The list shows all available filters. To define a new filter, open the Port > L2 Filters/IPv4 Filters page. By default, a catchAll filter is defined. This enables you to monitor all traffic on a port. Action Select the action that will be applied to traffic that matches the filter.
- Page 107 5: Monitoring & Filtering Parameter First choice Second choice BWR set Optional PCP Direct If this option is selected, the first and second choices are ignored. The PCP bits are forced to the default green or yellow values based on the result of the bandwidth regulator or the pre-marking color. It should be noted that the pre-marking color red is ignored if the default bandwidth regulator is not enabled.
- Page 108 5: Monitoring & Filtering Parameter First choice Second choice Type VLANinVLAN VLAN, IP precedence, VLAN DSCP IP precedence, DSCP IP precedence, DSCP VLAN, VLANinVLAN CoS profile Ignored Ignored BWR set BWR set BWR set Encapsulation Pop This option can be used to perform traffic regulation based on PCP / IP precedence /DSCP values before removing the VLAN tag.
- Page 109 5: Monitoring & Filtering Bandwidth regulator Choose a default bandwidth regulator that will be associated with the traffic matched by this policy. To define a bandwidth regulator see the Bandwidth policing section. CFI/PCP The default CFI and PCP values to be applied if the Encapsulation is Push. This would only be applied if the traffic does not match the first and second choices.
-
Page 110: Traffic Filters
5: Monitoring & Filtering Traffic filters To develop specific access policies and to make traffic monitoring more efficient and effective, custom (layer 2 or IPv4) filters can be applied to the traffic before it is presented on the monitor ports. This reduces overhead and enables access policies and monitoring to be targeted at specific types of traffic only. -
Page 111: L2 Filter Parameters
5: Monitoring & Filtering 3. Configure filter parameters and click Apply. L2 filter parameters L2 filter name Specify a name to uniquely identify the filter. Ethernet header settings The following characteristics can be defined. MAC destination / mask Specify the destination MAC address and mask. Specify the address as six pairs of hexadecimal digits separated by colons (xx:xx:xx:xx:xx:xx). - Page 112 5: Monitoring & Filtering "VLAN" and "VLAN in VLAN" settings You can specify several VLAN fields for the first VLAN (VLAN 1) as well as the second level VLAN (VLAN 2). NOTE: If a check box is not checked, then the value is ignored. Ethertype Specify the VLAN Ethernet Type.
-
Page 113: Viewing Ipv4 Filters
5: Monitoring & Filtering Viewing IPv4 filters To view a list of active IPV4 traffic filters, open the Traffic > IPV4 Filters page. By default, commonly used filters are defined. The following information is presented for each filter: Filter name: Unique name assigned to the filter. IP source: Indicates the source address assigned to the filter. -
Page 114: Configuring An Ipv4 Filter
5: Monitoring & Filtering Configuring an IPv4 filter To configure an IPV4 filter, do the following: 1. Open the Traffic > IPV4 Filters page. By default, commonly used filters are defined. 2. Click Add to create a new file, or click the filter name to edit and existing one. 3. - Page 115 5: Monitoring & Filtering IPv4 destination / mask Specify the destination address and mask. Only the bits specified by the mask are used. The other bits are ignored. Specify the time-to-live value to match. DSCP The DiffServ Code Points (DSCP) value may be selected from a list of predefined values or a decimal value between 0 and 63 may be defined.
- Page 116 5: Monitoring & Filtering CFI/DEI Specify the Canonical Format Indicator or the Drop Eligibility Indicator. This should always be set to zero for connection to Ethernet switches. CFI is used for compatibility reasons between Ethernet type networks and Token Ring type networks. If a frame received at an Ethernet port has a CFI set to 1, then that frame should not be forwarded "as is"...
-
Page 117: Bandwidth Policing
5: Monitoring & Filtering Bandwidth policing Traffic regulators enable you to limit the flow of traffic for a specific policy. A total of 15 traffic regulators can be defined. To view a list of all defined regulators, open the Traffic > Regulators page. Initially this page is empty as no regulators are defined by default. -
Page 118: Configuring A Regulator
5: Monitoring & Filtering Configuring a regulator To configure a traffic regulator, do the following: 1. Open the Traffic > Regulators page. 2. Click Add to define a new regulator.: 3. Configure settings and click Apply. Regulator settings Traffic regulator name Specify a name to uniquely identify the regulator. -
Page 119: Assigning A Regulator To A Policy
5: Monitoring & Filtering Excess Burst Size Specify the maximum burst size for traffic declared yellow by the traffic regulator. Range: 2 to 62 kBytes NOTE: Burst size must be greater than the port MTU. Color mode Specifies how the initial color of traffic should be attributed. •... -
Page 120: Alarms
Enable LED reporting: Reports alarms by activating the appropriate EtherNID LED corresponding to the severity of the alarm. • Enable syslog reporting: Reports alarms by creating syslog entries. • Enable SNMP reporting: Reports alarms via SNMP traps from Accedian’s private MIB. • Enable 802.3AH reporting: Reports alarms via 802.3AH organization specific OAMPDUs. Thresholds •... -
Page 121: Alarm Configuration
6: Alarms Alarm configuration The Alarm > Configuration page lists all defined alarms. -
Page 122: Customizing An Alarm
6: Alarms For a description of each field see Customizing an alarm on page 122. Customizing an alarm To customize an alarm, click its Number. - Page 123 6: Alarms Alarm number Unique number that identifies this alarm. Assigned by the EtherNID. The alarm number is composed of 3 fields, the module number, the instance number and the error number. The alarm number looks like this A.BBB.CC and is express in decimal. A: Module number (1-999).
- Page 124 6: Alarms • Critical: A service-affecting condition has occurred that requires immediate corrective action. Service affecting Specify if the alarm will be displayed as service affecting or non-service affecting. Description Textual description of the alarm.
-
Page 125: Alarm Status
6: Alarms Alarm status The Alarm > Status page presents a summary of all alarms. For a description of each field see Customizing an alarm on page 122. To view detailed information on an alarm click its Number. For example:... -
Page 126: Chassis Alarms
6: Alarms Chassis alarms The Alarm > Chassis page presents chassis-related status, alarms, and alarm settings. Power supply status Indicates the status of the various power sources. • A green light indicates that the power source is connected and is operating normally. •... -
Page 127: Operations, Administration & Maintenance
7: Operations, Administration & Maintenance Operations, Administration & Maintenance OAM configuration To view a list of all OAM instances and their settings, open the OAM > Configuration page. The following information is presented for each instance: • Name: The instance name as defined in the configuration page. Click this name to configure the instance. •... -
Page 128: Configuring An Oam Instance
7: Operations, Administration & Maintenance Configuring an OAM instance To configure an OAM instance, do the following: 1. Open the OAM > Configuration page. 2. Click Add to add a new OAM instance. 3. Configure OAM instance settings and click Apply. OAM instance parameters OAM instance name Specify a name to identify the OAM instance. - Page 129 7: Operations, Administration & Maintenance Enable OAM protocol Enable the passive or active OAM 802.3AH protocol for this OAM instance. An active instance will immediately start to send information OAMPDUs associated with the discovery process. Active Mode / Passive Mode Select the mode of operation for the OAM instance.
- Page 130 7: Operations, Administration & Maintenance Errored Frame Seconds Summary Event (EFSSE) Threshold and window Specify the threshold setting that defines the number of frame errors that must be detected in a given period to trigger the transmission of an event. An errored frame second is a one second period in which at least one frame was bad.
-
Page 131: Loopbacks
7: Operations, Administration & Maintenance Loopbacks The EtherNID supports in-service loopbacks on either the client or network ports. To view a list of all loopbacks and their settings, open the OAM > Loopback page. The following information is presented for each loopback: •... -
Page 132: Adding A Loopback
7: Operations, Administration & Maintenance Adding a loopback To add a loopback, do the following: 1. Only one loopback is supported per OAM instance. Therefore, before you can add a new loopback, you must first add an OAM instance on the OAM > Configuration page. 2. - Page 133 7: Operations, Administration & Maintenance Type • Iometrix L1: Iometrix cNode level 1. Loopback all packets that have a destination address equal to 00:30:79:FF:FF:FF • Exfo L2: Loopback all packets that have a source MAC OUI equal to 00:03:01 • Exfo L3: Loopback all UDP echo service packets.
- Page 134 7: Operations, Administration & Maintenance Accept VLAN loop commands: When enabled, VLAN loopback commands will be accepted. This option is only valid for untagged OAM instances. Tagged OAM instances only accept loopback commands from a specific VLAN. NOTE: This option is not affected by the setting of Loopback enable.
-
Page 135: Oam Events
7: Operations, Administration & Maintenance OAM events The OAM > Event page, lists a summary of all the events exchanged on an OAM connection. The following information is presented for each event: • Name: The name of the OAM instance. •... -
Page 136: Transmitted And Received Event Notifications
7: Operations, Administration & Maintenance Transmitted and Received event notifications OAM Local Error Symbol Period Event A sequence of six integers corresponding to the respective fields in the most recently transmitted Errored Symbol Period Event TLV in an Event Notification OAMPDU. This sequence is updated when a request service primitive is generated within the OAM sublayer with an OAMPDU Code field value equal to the Event Notification code and Event TLV Type field equal to the Errored Symbol Period Event value. - Page 137 7: Operations, Administration & Maintenance OAM Local Error Frame Event A sequence of six integers corresponding to the respective fields in the most recently transmitted Errored Frame Event TLV in an Event Notification OAMPDU. This sequence is updated when a request service primitive is generated within the OAM sublayer with an OAMPDU Code field value equal to the Event Notification code and Event TLV Type field equal to the Errored Frame Event value.
-
Page 138: Oam Status
7: Operations, Administration & Maintenance OAM status The OAM > Status page presents a summary of the status of each OAM instance. The following information is presented for each instance: • Name: OAM instance name. • Discovery: Identifies the current state of the OAM Discovery function. The enumerations match the states within the Discovery state diagram (see Figure 57-5 of IEEE802.3). -
Page 139: Detailed Status Information
7: Operations, Administration & Maintenance •The sixth bit corresponds to the Remote Evaluating bit in the Flags field. •The seventh bit corresponds to the Remote Stable bit in the Flags field. • Local revision: The value of the Revision field in the Local Information TLV of the most recently transmitted Information OAMPDU. -
Page 140: Remote
7: Operations, Administration & Maintenance • A slow protocols subtype value equal to the subtype reserved for OAM • The OAMPDU code equal to the Information code • The frame contains a Local Information TLV Remote Info TLV revision The value of the Revision field in the Remote Information TLV of the most recently received Information OAMPDU. Parser state / Mux state A string of three bits corresponding to the State field of the most recently received Information OAMPDU. -
Page 141: Oam Statistics
7: Operations, Administration & Maintenance OAM statistics The OAM > Statistics page, presents a summary of the statistics for each OAM instance. The following information is presented for each instance: • Name: OAM instance name. • Rcv OAMPDU: Number of OAMPDUs received by this instance. Include all types: info, var request, var response, loopback etc. -
Page 142: Oam Detailed Statistics Information
7: Operations, Administration & Maintenance OAM detailed statistics information Name The name of the OAM instance. Receive Unsupported codes A count of OAMPDUs received that contain an OAM code that is not supported by the device. This counter is incremented on reception of a valid frame with: •... - Page 143 7: Operations, Administration & Maintenance Duplicate event A count of the OAMPDUs received that contain the Event Notification code. This counter is incremented on reception of a valid frame, with: • DestinationField equal to the reserved multicast address for slow protocols. •...
- Page 144 7: Operations, Administration & Maintenance Organization specific A count of OAMPDUs received that contain the Organization Specific code. This counter is incremented on reception of a valid frame, with: • DestinationField equal to the reserved multicast address for slow protocols. •...
- Page 145 7: Operations, Administration & Maintenance Generalized nonresettable counter. This counter has a maximum increment rate of slow protocol frames (No more than 10 frames shall be transmitted in any one-second period). Loopback control A count of OAMPDUs passed to the OAM subordinate sublayer for transmission that contains the Loopback Control code. This counter is incremented when a request service primitive is generated within the OAM sublayer with an OAM code indicating a Loopback Control OAMPDU.
-
Page 146: Rfc-2544
8: RFC-2544 : Error! Reference source not found. 8 RFC-2544 RFC-2544 Generator NOTE: The RFC-2544 feature is only available on the EtherNID GE and MetroNID TE / TE-R / TE-S models. Viewing RFC-2544 Generator To view the RFC-2544 generator configuration, open the RFC-2544 > Generator > Configuration page. To edit any existing settings, click the flow profile setting. -
Page 147: Configuring Rfc-2544 Generator
8: RFC-2544 Configuring RFC-2544 Generator To edit the RFC-2544 Packet header settings, select First header packet settings show details button of the flow to be edited. Type Layer-2 or Layer-3. Layer-2 settings Port name Name configured for the port on which to send the flow(s). MAC destination This is the peer MAC address. - Page 148 8: RFC-2544 Enable VLAN 1 header This is to encapsulate all packets with 1 VLAN header. VLAN 1 ID First VLAN ID. When enabled, all test packets are encapsulated into the specified VLAN ID. VLAN 1 Ethernet type First VLAN Ethernet type. Applies only when VLAN 1 header is enabled. VLAN 1 Priority First VLAN priority bits.
- Page 149 8: RFC-2544 To edit the RFC-2544 Flows , select flow settings show details button of the flow to be edited. Flow type The type of flow testing being done. Either In-service (sharing a traffic regulator with client traffic) or Out-of-service (using the full link bandwidth).
- Page 150 8: RFC-2544 Payload pattern Select between fixed-data, incremental or random patterns in the payload part of the transmitted frames. For the random configuration you need to select one of the supported patterns. Duration type Choose between the following duration types: •...
-
Page 151: Rfc-2544 Monitor
8: RFC-2544 RFC-2544 monitor NOTE: The RFC-2544 feature is only available on the EtherNID GE and MetroNID TE / TE-R / TE-S models. Viewing RFC-2544 Monitor To view the RFC-2544 monitors, open the RFC-2544 > Monitor page. Name Unique name assign to the monitor. State State of the monitor. - Page 152 8: RFC-2544 Monitor results Name Unique name assign to the monitor. State State of the monitor. (Enabled or Disabled) Receive statistics Received packets Total packets received by the associated inspector. Received bytes Total bytes received by the associated inspector. Rate Data rate in Mbps.
- Page 153 8: RFC-2544 One-way delay Instantaneous One-way instantaneous delay value in microseconds. Minimum Minimum delay in microseconds. Maximum Maximum delay in microseconds. Average Average delay in microseconds One-way delay variation Instantaneous One-way instantaneous delay variation value in microseconds. Minimum Minimum delay variation in microseconds. Maximum Maximum delay variation in microseconds.
-
Page 154: Rfc-2544 Testsuite
8: RFC-2544 RFC-2544 testsuite NOTE: The RFC-2544 testsuite feature is only available on the MetroNID TE / TE-R / TE-S models. Viewing RFC-2544 testsuites To view the RFC-2544 testsuites, open the RFC-2544 > Testsuite page. Once defined, the Testsuite can be run to determine the conformance of a network section or a specific device. To add a new testsuite, click the Add button. -
Page 155: Detailed View Of Rfc-2544 Testsuites
8: RFC-2544 Detailed view of RFC-2544 Testsuites To view the detailed view of RFC-2544 testsuites, click on the testsuite name from the testsuite configuration list. Suite configuration Suite name Unique name assigned to the testsuite. Suite description Description configured to identify the testsuite and its characteristics. Jumbo frame size This defines what size is considered jumbo frames. - Page 156 8: RFC-2544 Peer settings Information relative to the remote peer and the test packet contents. VLAN protocol IDs are set to 0x8100 for 802.1Q network when VLAN is chosen. Test packets are Y.1731 LBM and the MEG (ME Group) level is configurable. Type Layer-2 or Layer-3.
- Page 157 Size parameters let the user choose which frame sizes are to be tested. By default, the 10000 byte frame size (Jumbo frame) is unselected as it was not a frame size defined by the RFC-2544 standard, but which Accedian supports nevertheless.
- Page 158 8: RFC-2544 Mbps and 980 Mbps (for a Step size of 20 Mbps). Both tests must yield no frame loss to be successful, or a lower rate will then be tested. Trial duration The Trial duration is the duration for which the test will be run. Step size The Step size defines the granularity of the range.
-
Page 159: Rfc-2544 Reports
8: RFC-2544 RFC-2544 reports NOTE: The RFC-2544 reports feature is only available on the MetroNID TE / TE-R / TE-S models. Starting an RFC-2544 Testsuite To start an RFC-2544 testsuite, click on the Start new testsuite button in the RFC-2544 > Reports page. Configure the report then click the Run button to start the testsuite. -
Page 160: Viewing Rfc-2544 Reports
8: RFC-2544 Special note Information relative to the report not included in the previous fields. Viewing RFC-2544 Reports To view the RFC-2544 reports, open the RFC-2544 > Reports page and click on the name of the report to view. Testsuite Report Name Unique name assigned to the report. - Page 161 8: RFC-2544 Report contents Once a test suite has finished running, the bottom of the report will look similar to the below screen shot. The entire report is displayed below.
-
Page 162: Performance Assurance Agent
9: Performance Assurance Agent 9 Performance Assurance Agent PAA configuration The EtherNID Performance Assurance Agent™ can be used measure the jitter, latency and packet loss of a given network. Two EtherNIDs with matching settings will communicate with each other to collect data. The PAA can be configured in a point-to-point or point-to-multi-point fashion, either allowing a single PAA instance to exchange data with another PAA instance or enabling it to communicate with several PAA instances simultaneously. -
Page 163: Configuring A Probe
9: Performance Assurance Agent Associating: Enabled looking for peer. Associated: Enabled peer found. Running: Running one time measurement. Idle: Idle after one time measurement completed. Locked IS: Locked traffic in service. Locked OOS: Locked traffic out of service. Destination: For layer-2 probes this is the peer’s MAC address. For UDP probe this is the peer’s IPV4 address. Sampling period: Interval at which PAA issues PAA measurement packets. - Page 164 9: Performance Assurance Agent 3. Configure parameters and click Apply.
-
Page 165: Paa Parameters
9: Performance Assurance Agent PAA parameters General Name Name of the PAA probe. Type Indicates the type of probe. Possible values are Layer-2 or udp. Operation mode Indicates if a probe generates (Source) or collects (Sink) measurement packets or does both (Bi-Dir). Packet size Size of PAA sample packets. - Page 166 9: Performance Assurance Agent VLAN 2 ID Second VLAN ID. When enabled, layer-2 PAA packets are encapsulated into a second VLAN. Applies only when VLAN 1 ID is enabled. VLAN 1 Priority First VLAN priority bits. Applies only when VLAN 1 ID is enabled. VLAN 2 Priority Second VLAN priority bits.
- Page 167 9: Performance Assurance Agent Continuity check threshold Continuity check threshold. Number of consecutive sampling periods without receiving peer packets before declaring loss of continuity. One-way Reference period One-way reference period. This value needs to be at least 10 times the value of the sampling period. Maximum delay Maximum one-way average delay.
- Page 168 9: Performance Assurance Agent Maximum delay variation Maximum two-way delay variation allowed. Delay variation threshold Two-way delay variation threshold in samples. Average delay variation threshold Two-way average delay variation threshold.
-
Page 169: Igmp
9: Performance Assurance Agent IGMP One-way join period Purpose Indicates that IGMP join and leave delay measurements shall be performed and the period during which one-way and packet loss samples shall be collected. This value should represent how long to collect measurements before issuing an IGMP leave for each period. - Page 170 9: Performance Assurance Agent Minimum: 1 Maximum: (One-way join period / Sampling period) Join average delay threshold Purpose Define the maximum join average delay. Validity UDP sink probe configured with a multicast destination address. Values (in milliseconds) Minimum: 100ms Maximum: One-way join period Maximum leave delay Purpose Defines the maximum leave delay objective.
-
Page 171: Paa Status
9: Performance Assurance Agent PAA status To view the status of all PAA probes, open the PAA > Status page. The following information is presented for each probe. Index: A unique identifier assigned to the probe. Probe name: Unique name assigned to the probe. Click the name to view detailed status information. State: Indicates the probe's current state. -
Page 172: Detailed Paa Status
9: Performance Assurance Agent Detailed PAA status Clicking a probe name on the PAA > Status page presents more detailed information on a probe. This page provides the status details for a specific PAA probe. Probe Name Probe's name as defined in the configuration page. Click this name for more details. Index Probe's unique identifier. - Page 173 9: Performance Assurance Agent • Two-way Average Delay • Two-way Delay Variation • Two-way Average Delay Variation NOTE: One-way delay measurements require time synchronization, via NTP, on units at each probe end.
-
Page 174: Paa Results
9: Performance Assurance Agent PAA results To view the results of all PAA probes, open the PAA > Results page. This page provides a summary of the results of PAA probes. Index Probe's unique identifier. Probe Name Probe's name as defined in the configuration page. Click this name for more details. State Indicates the probe's current state. -
Page 175: Detailed Paa Results
9: Performance Assurance Agent Detailed PAA results Clicking a probe name on the PAA > results page presents more detailed information. Current results for probe: Unique name assigned to the probe. Index: A unique identifier assigned to the probe. State: Indicates the probe's current state. Possible values are:... - Page 176 9: Performance Assurance Agent • Disabled: This probe is disabled. To enable it, click the probe name and then select the Enable PAA probe checkbox. • Associating: Probe is looking for peer. • Associated: Peer was found. • Running: Running one time measurement. •...
-
Page 177: 10 Traffic Shaper
10: Traffic Shaper 10 Traffic Shaper Traffic shaper configuration NOTE: Traffic shaper is only available on the MetroNID TE / TE-S models. This is the main tab used for traffic shaping, configuration and monitoring functions. Traffic shaper menu • Port: This option allows the user to configure the global traffic shaping parameters for the outgoing port . •... - Page 178 10: Traffic Shaper • Q-length: Size in KBytes of the shaper's queue. • CIR: The shaping rate of green packets in Kbps (average output rate of the shaper). • CBS: The shaping burst of green packets in Bytes (maximum output burst of the shaper). •...
- Page 179 10: Traffic Shaper BLUE performs queue management based on link utilization. It maintains a marking probability pm to either mark or drop the packets. If the queue is continually dropping the packets , pm is incremented by a factor /1. If the queue is empty or link is idle, pm is decremented by a factor /2.
- Page 180 10: Traffic Shaper Here is an example of a policy: Here is an example of a policy: By enabling this policy we are taking traffic being received on the client port with VLAN 100 and directing it to shaper-1 before it is sent out the Network port. On the screen capture below notice the Map information, PCP 1 will be directed to shaper-1.
-
Page 181: Traffic Shaper Statistics
10: Traffic Shaper Traffic shaper statistics • PCP-Precolor: This is the list of all PCPs and their precolor that are currently mapped to this shaper instance. • Forward no delay: Total number of packets/bytes and rate forwarded by this shaper without any delay. •... -
Page 182: 11 Cfm
11: CFM 11 CFM CFM continuity fault management To view a list of all CFM instances and their settings, open the CFM > Stack tab. CFM stack: • Stack: Central location to view all the CFM information. • Port: This object represents the Bridge Port or aggregated port on which MEPs might be configured. •... -
Page 183: Cfm Configuration
11: CFM CFM configuration To configure CFM, do the following: 1. Open the CFM > MD page 2. Click Add to add a new MD configuration if required or you may use one of the preconfigured defaults. 3. Configure CFM instance name and settings and click Apply. 4. - Page 184 11: CFM The new MA/MEG configuration window. MD: There are eight pseudo MDs defined by default, one for each level, that are named "Y.1731 level 0" to "Y.1731 level 7". These MDs exist only to simplify the integration of Y.1731's MEGs with the CFM MIB which requires MDs.
- Page 185 11: CFM 6. Open the CFM > MEP > Configuration page Index: Unique index assigned to each Maintenance association End Point. MEPID: Maintenance association End Point Identifier (MEPID). An integer, unique to each MA, identifying a specific MEP. Active: Indicates the administrative state of the MEP. True indicates that the MEP is to function normally, and false indicates that it is to cease functioning.
- Page 186 11: CFM 7. Click Add to add a new MEP (Maintenance association End Point). MEP index: Unique index assigned to each Maintenance association End Point. MD index: Unique index assigned to each Maintenance Domain. MD name: The domain of the maintenance association (or MEG). MA/MAG index: The unique index of the maintenance association (or MEG).
- Page 187 11: CFM CCM sequence number: Enable or disable CCM sequence number. When enabled, a MEP transmits CCMs with a sequence number that increases by one for each CCM. When disabled, a MEP transmits CCMs with a sequence number set to zero. Note: A peer MEP should have sequence number enabled to allow a local MEP to perform CCM based packet loss measurements.
- Page 188 11: CFM 8. Open the CFM > LTM and click on the MEPID, then click Start to start the link trace. • MEP index: Unique index assigned to each Maintenance association End Point. • MEPID: Maintenance association End Point Identifier. •...
- Page 189 11: CFM 9. Open the CFM > LBM and click on the MEPID, then click Start to start the link trace. • MEP index: Unique index assigned to each Maintenance association End Point. • MEPID: Maintenance association End Point Identifier. •...
- Page 190 11: CFM • Latest start time: Indicates the time the latest loopback request was initiated for that MEP. • Latest end time: Indicates the time the latest loopback request has completed or was stopped for that MEP. • Nbr LBM requested: Indicates the number of LBM requested for the latest loopback request. •...
- Page 191 11: CFM 10. Open the CFM > DMM > Configuration and select add...
- Page 192 11: CFM 11. Open the CFM > DMM > Configuration and select add DMM: Delay Measurement Message, used to measure delay and variation. Enter the values and thresholds as required and apply.
- Page 193 11: CFM 12. Open the CFM > Packet loss > Configuration and select add. 13. Simply enable the Packet loss module and apply...
-
Page 194: Cfm Statistics
11: CFM CFM statistics CFM MEP Statistics Index: Unique index assigned to each Maintenance association End Point. MEPID: Maintenance association End Point Identifier. CCM sent: Number of Connectivity Check Messages sent by this MEP. CCM received: Number of Connectivity Check Messages received by this MEP. RDI sent: Number of Connectivity Check Messages sent by this MEP with RDI bit set. - Page 195 11: CFM Priority: Priority value to be used in VLAN tags, if present, in the transmitted frame. Results Code definitions: OAD: One-way Average Delay OADV: One-way Average Delay Variation TAD: Two-way Average Delay TADV: Two-way Average Delay Variation CFM packet loss results Index: Unique index of the Packet loss measurement.
-
Page 196: Command Line Interface
12: Command Line Interface 12 Command Line Interface Command summary Note: For a list of all CLI command descriptions, use the help command in the CLI. The CLI provides the following commands. Ethernet port commands cable-test: Perform time domain reflectometry diagnostics. fault-propagation: Manage the link fault propagation between ports. - Page 197 12: Command Line Interface motd: Manage the MOTD of the unit. mtr: Manage management traffic regulation settings. ntp: Manage the network time client and server functions. permission-group: Manage the user privilege profiles. radius: Manage RADIUS authentication methods. route: Manage the IP routes and gateways. session: Manage the session settings or active sessions.
-
Page 198: Command Syntax
12: Command Line Interface Command syntax To see the syntax conventions used for all help commands, type syntax to display the following information: Description: Display CLI syntax explanations. Syntax: syntax Syntax metacharacters - Matches one in the set - Optionally matches one in the set - Repeat 0 or more times - Repeat 1 or more times - Matches one in the range... -
Page 199: 13 Appendix A - Alarms
13: Appendix A - Alarms 13 Appendix A - Alarms Alarms NOTE: Once an alarm has been raised (depending on the description of the alarm), the alarm will only be cleared once the fault has been corrected and the alarm threshold off soaking period has expired. The following alarms are supported: Port module for link down and others related alarms. - Page 200 13: Appendix A - Alarms 2.001.16 -> SFP-A transmit power low warning 2.001.17 -> SFP-A receive power high alarm 2.001.18 -> SFP-A receive power low alarm 2.001.19 -> SFP-A receive power high warning 2.001.20 -> SFP-A receive power low warning 2.001.21 ->...
- Page 201 13: Appendix A - Alarms EtherNID Performance Assurance Agent ™ alarms. Note: These alarms are dynamically created based on the PAA probes configured. xxx : PAA instance number <probe-name> : PAA probe name 3.xxx.01 -> <probe-name> PAA_CC_ALERT 3.xxx.02 -> <probe-name> PAA_PL_ALERT 3.xxx.05 ->...
- Page 202 13: Appendix A - Alarms SOAM module for CC, Packet Loss and other related alarms. Note: These alarms are dynamically created based on the MEPs configured. xxx : MEPID number 4.xxx.01 -> RDI on down MEP 4.xxx.02 -> MAC status on down MEP 4.xxx.03 ->...
-
Page 203: Appendix B - Mib Support
14: Appendix B – MIB Support 14 Appendix B - MIB Support Public MIBs The following public MIBs are supported: RFC-1213-MIB system group interface group snmp group NOTE: Some groups have been removed for security reasons of the standard MIB-II. IF-MIB ifXTable EtherLike-MIB... - Page 204 14: Appendix B – MIB Support IEEE8021-CFM dot1agCfmStackTable dot1agCfmMdTable dot1agCfmMaNetTable dot1agCfmMaCompTable dot1agCfmMaMepListTable dot1agCfmMepTable dot1agCfmMepDbTable dot1agCfmMdTableNextIndex...
-
Page 205: Private Mibs
The following private Accedian MIBs expose EtherNID configuration and status information. ACCEDIAN-SMI.mib This MIB contains all the information related to Accedian private tree and principal branches. ACD-ALARM-MIB.mib This MIB contains the general setting of the alarm manager and the tables for alarm configuration and status. - Page 206 14: Appendix B – MIB Support ACD-SFP-MIB.mib This MIB contains all the information related to the SFP present in the NID. ACD-SMAP-MIB.mib This MIB contains all the information related to the Service Mapping configuration in the NID. Alarms format The alarm format is defined in the ACD-ALARM-MIB.mib file. The alarms are in SNMPv2 format and include the following fields.
Need help?
Do you have a question about the EtherNID EE and is the answer not in the manual?
Questions and answers