
Related Manuals for biochrom NanoVue Plus


Summary of Contents for biochrom NanoVue Plus
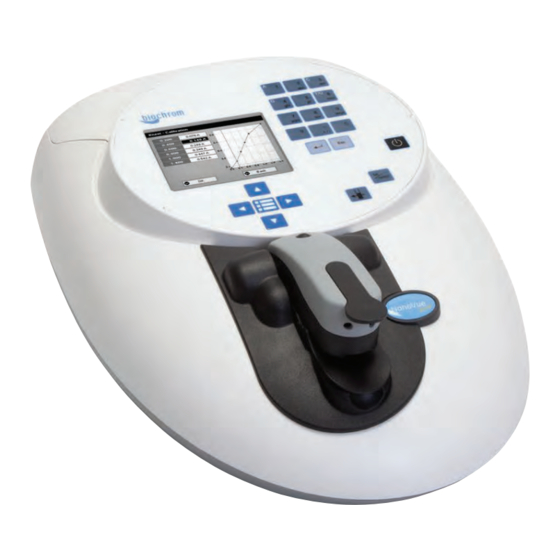
- Page 1 NanoVue Plus ™ Product User Manual Biochrom US Telephone: 1-508-893-8999 84 October Hill Rd Toll Free: 1-800-272-2775 Holliston, MA Fax: 1-508-429-5732 01746-1388 support@hbiosci.com www.biochromspectros.com...
-
Page 2: Table Of Contents
7.6. About 1.2. Safety 7.7. Pathlength Check & Calibration 7.8. Games 2. INTRODUCTION 8. ACCESSORIES 2.1. Your NanoVue Plus 8.1. Printer installation 2.2. File system 8.2. Bluetooth accessory installation 2.3. Data export 8.3. Fitting SD memory card accessory 8.4. After sales support 2.4. -
Page 3: Installation
Note that the instrument prevents operation if the head is raised or the Xenon flash does no reach the detection system. WARNING High voltages exist inside the NanoVue Plus instruments. Repair and maintenance should only be carried out by individuals trained specifically to WARNING work on these instruments. - Page 4 If the instrument is used in a manner not specified or in environmental conditions not appropriate for safe operation, the protection provided may be impaired and instrument warranty withdrawn. There are no user-serviceable parts inside this instrument. 5061-049 REV 1.4...
-
Page 5: Introduction
0.025 A using a pathlength of 0.5 mm, the normalized Absorbance shown will be 0.500 A. NanoVue Plus is therefore ideally suited to the life scientist where sample is limited and speed and convenience of analysis is key. -
Page 6: File System
Some users may find it convenient to “print through” the PC directly to a printer already attached to it. The software to enable this option will be found on the CD provided. Datrys Computer control software is also available for NanoVue Plus as an optional extra. 5061-049 REV 1.4... -
Page 7: Sample Treatment
2.4. Sample treatment NanoVue Plus uses a unique sampling head which enables users to accurately measure the optical characteristics of samples volumes as low as 0.5 µl. The sample is applied to a horizontal plate having a hydrophobic surface, the sampling head is lowered into position and the reading taken. -
Page 8: Auto-Read
2.6. Auto-Read NanoVue Plus senses when the sampling head has been lowered, so Auto-Read can be used to automatically make a measurement when this happens, obviating the need to press any keys. The instrument assumes that the first reading after starting any application will be a reference scan and that subsequent readings will be sample scans. -
Page 9: Keypad And Display
2.8. Keypad and display The back-lit liquid crystal display is very easy to navigate around using the alphanumeric entry and arrow keys on the hard-wearing, spill-proof membrane keypad. Alphanumeric (Janus) Confirm selection one Warm Grey 1 EC pqrs wxyz one Cool Grey 8 EC Display Escape/Cancel + / -... -
Page 10: Software Style
Options Sub Menu (select using keypad numbers) View Parameters for the experiment. Print the results. 3, 4, 5, 6 Described in the relevant application. Define the Sample Number you wish to start from. Save the parameters as a method to a defined folder name with a defined method name. -
Page 11: Operation And Maintenance
3. OPERATION AND MAINTENANCE 3.1. Sample application guide Step 1 Lift the sampling head to the vertical position and using a low-volume (0–10 µl) pipette take up approximately 2 µl of sample. A reliable pipette and matching high quality tips are strongly recommended. When removing a very small aliquot from a larger volume, ensure that the sample is truly representative. -
Page 12: Sample Plate Replacement
Step 4 If a program has been selected and the Auto-Read function is set to On (see section 2.6), the sample reading process will begin automatically – a reference scan will be taken first, followed by the measurement scan. If the Auto-Read function is set to Off, use the 0A/100%T and buttons to take the reference and measurement scans respectively. -
Page 13: Cleaning And General Maintenance
Figure: 8a Figure: 8b 3.3. Cleaning and general maintenance Before cleaning the case of the instrument, switch off the instrument and disconnect the power cord. Clean all external surfaces using a soft damp cloth. A mild liquid detergent may be used to remove stubborn marks. -
Page 14: Life Science
4. LIFE SCIENCE 4.1. File system The Life Science Screen is organized into six sub-folders as shown below: Folder Keypad Number Application Function Concentration and purity check for DNA samples Concentration and purity check for RNA samples Oligo Concentration and purity check for Oligonucleotide samples Tm Calculation DNA melting point calculator Cy Dye... - Page 15 • NanoVue Plus will default to factors 50 for double stranded DNA, 40 for RNA and 33 for single stranded DNA and Oligonucleotides. It also allows manual compensation for dilution - aided by a dilution calculator. • Nucleic acids extracted from cells are accompanied by protein and extensive purification is required to remove the protein impurity. The 260/280 nm Absorbance ratio gives an indication of purity, however it is only an indication and not a definitive assessment.
-
Page 16: Dna Measurement
Typical spectral scan of a Nucleic Acid:- Note: • The Absorbance maximum near 260 nm and Absorbance minimum near 230 nm. • The flat peak near 260 nm and steep slope at 280 nm. • There is very little Absorbance at 320 nm. 4.2.2. DNA measurement The procedure is as follows: Step 1 Press 1 to select DNA mode. Step 2 Select Pathlength using the left and right arrows. Options are 0.5 mm, 0.2 mm or Automatic. -
Page 17: Rna Measurement
to return to the Life Science Screen. Results Screen Step 8 Pipette on the reference sample and lower the sampling head. If Auto-Read is off, press the 0A/100%T key. This will be used for all subsequent samples until changed. If QA is switched on the sample will need to be replaced and the 0A/100% T key pressed again. - Page 18 Step 4 Select whether the Background Correction at 320 nm is to be used or not with the left and right arrows. Press the down arrow. Step 5 Select the Units of measurement using the left and right arrows. Options: µg/ml, ng/µl, µg/µl.
-
Page 19: Oligonucleotide Measurement
4.2.4. Oligonucleotide measurement The procedure is as follows: Step 1 Press 3 to select Oligo mode. Step 2 Select Pathlength using the left and right arrows. Options are 0.5 mm, 0.2 mm or Automatic. Press the down arrow. Step 3 (Dilution Factor known) Enter the Dilution Factor using the keypad numbers (range 1.00 to 9999). -
Page 20: T Calculation
and displays the results. The ratio of the Absorbance values at wavelengths 1 and 2 are calculated. The Concentration is based on the Absorbance at wavelength 1. Repeat step 9 for all samples. Press to return to the Life Science Screen. Press ... - Page 21 Calculated factor and MW are defined below [salt] is the buffer molarity plus total molarity of salts in the hybridization solution (moles/l) Weights for ∆S are indexed by adjacent paired bases. A similar equation applies to weights for ∆H, again indexed by adjacent bases. Note that bivalent salts may need normalizing using a multiplying factor of 100 because of their greater binding power.
- Page 22 Calculated factor: this is just the calculated molecular weight divided by the theoretical Absorbance. The procedure is as follows: Step 1 Press 4 to enter the Tm Calculation Parameters Screen. Step 2 Select the Base Type: DNA or RNA. Press the down arrow. Step 3 Select whether the sample is Phosphorylated or not (Yes or No). Press the down arrow.
-
Page 23: Cydye Measurement
Results Screen Step 12 Pipette on the reference sample and lower the sampling head. If Auto-Read is off, press the 0A/100%T key. This will be used for all subsequent samples until changed. If QA is switched on the sample will need to be replaced and the 0A/100% T key pressed again. - Page 24 Dye Incorporation = DyeQuantity / DNAQuantity Dye FOI = DyeQuantity * (324.5 / DNAQuantity) Step 1 Press 5 to enter the Cy Dye Parameter Screen from the Life Sciences screen. Step 2 Either select the Dye Name of the dye being used by using the left and right arrows, or select “Custom”...
- Page 25 Step 11 Enter the Dilution Factor (if applicable) Step 12 (Dilution Factor known) Enter the Dilution Factor using the keypad numbers (range 1.00 to 9999). Use the C button to backspace and clear the last digit entered. Step 13 (calculate Dilution Factor) ...
-
Page 26: Proteins
Protein conc. = (Factor 1 * Abs280) - (Factor 2 * Abs260) • This equation can be applied to other proteins if the corresponding factors are known. NanoVue Plus can determine protein concentration at 280 nm and uses the above equation as default. The factors can be changed and the use of Background Correction at 320 nm is optional. - Page 27 750 nm; this is usually BSA. • Detailed protocols are supplied with these assay kits, and must be closely followed to ensure accurate results are obtained. The small sample size required with NanoVue Plus may allow modification of the manufacturer’s protocols and considerable economies may be made at the user’s discretion. • To use a zero concentration standard, include it in the number of standards to be entered and enter 0.00 for concentration;...
-
Page 28: Protein Uv
Use of Background Correction • Background Correction at a wavelength well apart from the protein peak is used to compensate for the effects of background Absorbance. The procedure can adjust for the effects of turbidity, stray particulates and high-Absorbance buffer solutions. • NanoVue Plus uses Background Correction at 320 nm. It is particularly recommended since very small samples are particularly susceptible to stray particulates. The Background function toggles On and Off with either left/right arrows from the relevant page. - Page 29 Step 8 Press OK to enter the Results Screen Cancel to return to the Protein Screen. Results Screen Step 9 Pipette on the reference sample and lower the sampling head. If Auto-Read is off, press the 0A/100%T key. This will be used for all subsequent samples until changed.
-
Page 30: Protein A280
4.3.3. Protein A280 Step 1 Press 2 to select Protein A280. Step 2 Select the Mode. Options are Christian Warburg, BSA, IgG, Lysozyme, Molar extinction, Mass extinction, E 1%. Step 3 Select Pathlength using the left and right arrows. Options are 0.5 mm, 0.2 mm or Automatic. -
Page 31: Bca
Step 10 Clean the top and bottom plates, pipette on the sample and lower the sampling head. If Auto-Read is off, press . This measures at both 260 and 280 nm wavelengths and displays the Protein concentration as the Result. Repeat step 10 for all samples. - Page 32 Step 7 Select the Calibration Mode, either Standards (measure prepared standards), Manual (keypad data entry, go to step 9), or New Standards (means new standards are measured each time the method is used). Step 8 (only if Standards is selected) Select the number of Replicates using the left and right arrows.
- Page 33 Step 12 (Standards selected) Press Replicates to display the replicate entry boxes. Use C to clear previously stored results before measuring. Clean the top and bottom plates, pipette on the replicate standard and lower the sampling head. If Auto-Read is off, press to measure the standard and store the result.
-
Page 34: Bradford
9. Auto-Print – toggles Auto-Print on/off. Exit Options by pressing , or wait. 4.3.5. Bradford The procedure is as follows: Step 1 Press 4 to select Bradford method. Step 2 The Wavelength for this method is fixed at 595 nm. Step 3 Enter the number of Standards (1–9) to be used in the curve using the keypad numbers or left and right arrows. - Page 35 Press Back to return to the Parameters Screen. Calibration Screen (Replicates off) This shows the calibration values and allows standards to be measured or entered using the keypad numbers (if calibration mode is manual). Step 11 (Standards selected) It is recommended that 4 µl is used for Bradford assays to maximize the accuracy of results.
-
Page 36: Lowry
0.001 to 9999). Use C to backspace and clear the last digit entered and the up and down arrows to move between boxes. Pressing the down arrow from the last standard will bring up the OK box. Press OK to accept the calibration and go to the Results Screen (see below) Press Back to return to the Standards Screen. - Page 37 ppm, ppb, conc or none. These units can also be edited once OK is pressed. This screen also allows the number of displayed decimal points (DP) to be selected, from 0 to 2. Note that the result will always be fixed to 5 significant figures regardless of how many decimal points are selected (so 98768.2 will display as 98768 even with 1 decimal point selected).
- Page 38 Step 13 (Standards/Manual selected) When all standards are measured the OK box appears. Press OK to accept the calibration and go to the Results Screen (see below), OR Press Back to cancel selections and return to the Standards Screen. Calibration Screen (Replicates on) This shows the calibration values and allows standards to be measured.
-
Page 39: Biuret
Options (select using keypad numbers) 1. Return to Parameters Screen (step 1 above). 2. Print result via selected method. 3. Toggle Graph on/off. Displays the calibration graph, cursors give values for last measured sample. 7. Sample Number – add a prefix to the sample number and reset the incrementing number to the desired value. - Page 40 Press Next to enter the Standards Screen Press Cancel to cancel selections and return to the Protein Screen. Standards Screen Step 9 (Standards/Manual selected) Enter the concentration values by using the keypad numbers and the up and down arrows to move between the different standard boxes (range 0.001 to 9999). C button backspaces and clears the last digit entered.
- Page 41 Step 13 (Standards/Manual selected) Press OK to accept the calibration and go to the Results Screen (see below) OR Press Back to return to the Standards Screen. Calibration (Manual entry) Shows previously entered calibration values and allows values to be entered via the keypad.
-
Page 42: Applications
5. APPLICATIONS 5.1. File system SUMMARY: Function Keypad Description Number Absorbance or %T (transmission) at a single user defined wavelength. Concentration measurement at a single wavelength based on a factor entered or calculated from a single standard. Wavelength scan between two user defined wavelengths. - Page 43 Step 4 To enter the Results Screen with the selected parameters press OK Cancel the selections and return to the Applications Screen by pressing Cancel Step 5 Pipette on the reference sample and lower the sampling head. If Auto-Read is off, press the 0A/100%T key.
-
Page 44: Concentration
5.3. Concentration This makes concentration measurements on samples, by measuring the amount of light that has passed through a sample relative to a reference (this can be air). Concentration is obtained by multiplying the measured Absorbance at a specific wavelength by a factor. Note that the system does not nomalize the result to a 10 mm pathlength so the factor may need to be modified accordingly if brought over from another system. - Page 45 The concentration of the sample is displayed. Results shown as ---- indicate the concentration is out of range. Repeat step 7 for all samples. Press to return to the Applications Folder. Press to display available Options which are described below. Step 8 (if using Standard mode) Pipette on the reference sample and lower the sampling head.
-
Page 46: Wavescan
5.4. Wavescan An absorption spectrum can be obtained from NanoVue Plus, enabling simple identification of peak height and position. Note that the values reported are NOT nomalized to a 10 mm pathlength, so if comparison is being made to other systems the appropriate factor should be used to convert them (×... - Page 47 Options (select using keypad numbers) 1. Return to Parameters Screen (step 1 above). 2. Print result via selected method. 3. Toggle between Absorbance and %T mode. 4. Displays Peak Detection Parameter Screen. See description below. 5. Manually adds a peak position to the peak table in the results screen at the position set by the cursor.
-
Page 48: Kinetics
Graph Scale (shortcut button 6) This enables the user to set up a defined graph by defining the limits in either or both of the x and y axes. Zoom Mode: This sets up the operation of the Zoom keys (up and down arrows). “x & y axes” expands the display around the cursor measurement point, whilst the other options select the Absorbance or wavelength axes respectively. - Page 49 Step 4 (Interval) Enter the Interval time in seconds between measurements using the left and right arrows. Options are: 1, 5, 10, 20, 30 or 60 seconds. Press the down arrow. Step 5 Press Next to go to the next Parameters Screen Press Cancel to return to the Applications Screen.
-
Page 50: Standard Curve
The construction of a multi-point calibration curve from standards of known concentration to quantify unknown samples is a fundamental use of a spectrophotometer. NanoVue Plus has the advantage of being able to store this curve as a method, using up to 9 standards. If History is switched on (see Preferences) the unit will retain the previously used curve values. - Page 51 This screen also allows the number of displayed decimal points (DP) to be selected, from 0 to 2. Note that the result will always be fixed to 5 significant figures regardless of how many decimal points are selected (so 98768.2 will display as 98768 even with 1 decimal point selected).
- Page 52 Step 12 Press OK to accept the calibration and go to the Results Screen (see below) Press Back to return to the Standards Screen. Calibration Screen (Replicates on) This shows the calibration values and allows standards to be measured. Step 10 Pipette on the reference sample and lower the sampling head.
-
Page 53: Multiple Wavelength
Options (select using keypad numbers) 1. Return to Parameters Screen (step 1 above). 2. Print result via selected method. 3. Toggle Graph on/off. Displays calibration graph, cursors give values for last measured sample. 7. Sample Number – add a prefix to the sample number and reset the incrementing number to the desired value. -
Page 54: Absorbance Ratio
Results A scan plot covering the range of wavelengths selected (with cursors at the relevant wavelengths) and a table of values is displayed. Press to return to the Applications Screen. Press to display available Options which are described below. 1. - Page 55 Press the options key: Enter the Volume of the sample (range 0.01 to 9999), using the keypad numbers. Press the down arrow. Enter the volume of Diluent (range 0.01-9999) using the keypad numbers. Press OK to calculate the dilution factor and return to the Parameters Screen or press Cancel, to cancel selections.
-
Page 56: Favourites And Methods
Go to the relevant folder, by selecting either option 3: Favourites or option 4: Methods from the opening NanoVue Plus Screen. Select the method you wish to lock/unlock or delete by pressing the relevant keypad number and then press the key. -
Page 57: Utilities
7. UTILITIES Press 5 to enter the utilities folder. Summary Function Keypad number Description Set correct date and time Select preferred language and number format Printer/output options Select screen layout (themes) and history Adjust screen contrast & brightness Shows serial number and software version Pathlength Calibration Spectro Blocks and Sudoku 7.1. -
Page 58: Printer
7.3. Printer Sets up printing options. The procedure is as follows: Select whether Auto-Print is on or off using the left and right arrows. When Auto- Print is on, the results are automatically printed after a measurement is taken. When it is off, printing has to be initiated manually. This can also be set using the ... -
Page 59: Pathlength Check & Calibration
7.7. Pathlength Check & Calibration It is recommended that the pathlength is calibrated either at a frequency determined by the standard operating procedure of the user’s laboratory, if the instrument is moved to another location, or if the sample plates are changed. In line with general good laboratory practice, it is recommended that a calibration check is performed every so often to provide continued confidence that the instrument is within calibration, for example, once every 6 months. - Page 60 0A/100%T key. Figure X NanoVue Plus will take a reference at both 0.2 and 0.5 mm pathlengths, so this Calibration Fluid takes a few seconds longer than usual in order to get the best quality answer.
- Page 61 Press to return to the Utilities Screen. Error Messages In exceptional circumstances the Pathlength calibration routine may fail, there are two ways this can occur: 1) Pathlength are outside specified range (see error message right) If this happens, see troubleshooting Section 9 to adjust the pathlengths 2) The standard deviation for the 10 measurements is >1.5% If this happens repeat steps 7.7 clearing any previous results If the instrument has a Printer fitted, a hard copy of the calibration results can be obtained automatically upon exiting the application...
-
Page 62: Games
7.8. Games 1: Spectro Blocks Classic block dropping game. Follow the instructions! Press Cancel to return to the Utilities Screen without storing the settings. 2: Sudoku Can be set up as Computer Mode (50 preset games) or User Mode (enter your own pattern). -
Page 63: Accessories
8. ACCESSORIES INSTALLATION The user can install either a printer, SD card accessory or a Bluetooth module. 8.1. Printer installation Step 1. Figure: 12 Remove the power cable and turn the instrument over onto a soft surface, taking care not to damage the sampling head. - Page 64 Figure: 15 Step 4. Lower the printer onto the locating bosses. Figure: 16 Step 5. Replace the top cover plate, invert the instrument and replace the cap head screws. Figure: 17 Step 6. Switch the instrument on and go to utilities/instrument/preferences and select the Built-in printer.
-
Page 65: Bluetooth Accessory Installation
8.2. Bluetooth accessory Installation Figure: 18 Step 1. Figure: 18 Step 1. Remove the power cable and turn the As for section 8.1, remove the power instrument over onto a soft surface, cable and turn the instrument over taking care not to damage the sampling onto a soft surface, taking care not to head. - Page 66 Figure: 20 Step 5. Load the rear cover into the two slots provided, note the large flage faces upwards. Figure: 21 Step 6. Re-fit the top plate. Step 7. Invert the instrument carefully and replace the cap head screws. Step 8. Switch the instrument on and go to the preferences page under utilities/ instrument and select the Bluetooth...
-
Page 67: Fitting Sd Memory Card Accessory
8.3. Fitting SD memory card accessory Step 1. Remove the power cable from the instrument. Turn the instrument over and place onto a soft surface, for example a folded up towel, taking particular care not to damage the sampling head . Release the outermost cap head screws using the Allen key provided. - Page 68 Methods are stored on the card in a directory named \Instrument Type\Methods (instrument type will be NanoVue Plus); this directory structure is evident when the SD card is inserted into a PC. To save a method to the SD memory card, the instructions for the relevant application from the instrument user manual must be followed.
- Page 69 Saving data to SD memory card Data from all applications on your instrument can be stored onto the SD memory card. To enable data to be stored on the card, the SD memory card must be selected as the output device: •...
-
Page 70: After Sales Support
8.4. After sales support For all technical support and advice on NanoVue Plus please contact your supplier. www.biochromspectros.com or email at support@hbiosci.com Support agreements that help you to fulfil the demands of regulatory guidelines concerning GLP/GMP are available. • Calibration, certification •... -
Page 71: Troubleshooting
As with the calibration check in section 7.7, the first step is to measure two reference samples. Open the NanoVue Plus sampling head and pipette 5 µl of distilled water onto the correct position on the sample plate. Close the sampling head, clear all previous readings using the cursors and “C”... -
Page 72: Error Messages
Note: take a new reference measurement after every one or two turns of the pins. This is because physically changing the pathlength alters the optical pathlength of the lightpath and the reference must be taken at the same pathlength as the sample for accurate results. - Page 73 What is it? What should you do? Calibration problem (UV) on reference Is the xenon source firing when you press ? Can you hear it buzz at start-up? channel Is the power supply securely connected to the instrument? Turn off the instrument, disconnect and reconnect the power supply and then turn on the instrument.
-
Page 74: Fault Analysis
Absorbance of the sample. Q. How accurate is NanoVue Plus? A. Typically within 2%. Q. What sort of reproducibility should be produced with NanoVue Plus? A. Typically +/- 0.005 A at low concentrations and for higher concentrations, standard deviations are typically < 2%. - Page 75 A. Most common laboratory solvents, including dilute acids, may be used but they should be immediately wiped off the sample plate after measuring. The NanoVue Plus sample plate has been tested with methanol, isopropanol (2-propanol), and acetone. However, these solvents may affect the accuracy of the measurement due to their volatility &...
- Page 76 & available to go to 1100 nm. Q. Does NanoVue Plus require a computer to operate? A. No, NanoVue Plus operates as a stand alone instrument, although it can be connected to a PC through the USB port to enable connection to a remote printer, LAN or electronic data archive.
-
Page 77: Specification And Warranty
Warranty • • Biochrom guarantees that the product supplied has been thoroughly tested to ensure that it meets its published specification. The warranty included in the conditions of supply is valid for 2 years only if the product has been used according to the instructions supplied.
Need help?
Do you have a question about the NanoVue Plus and is the answer not in the manual?
Questions and answers