
Related Manuals for Sensortech Systems ST-3300 Series


Summary of Contents for Sensortech Systems ST-3300 Series
- Page 1 ST-3300 Smart RF Sensor Technical Manual 2221 E. Celsius Avenue, Unit B Oxnard, California USA 93030 Tel (805) 981-3735 Fax (805) 981-3738 info@Sensortech.com www.Sensortech.com...
- Page 2 ST-3300 Smart RF Sensor Technical Manual Sensortech Systems, Inc. is disclosing this material to you solely for use to operate hardware devices and software we manufacture. You may not reproduce, distribute, republish, download, display, post, or transmit the documentation in any form or by any means including, but not limited to, electronic, mechanical, photocopying, recording, or otherwise, without the prior written consent of Sensortech Systems.
-
Page 3: Preface
Sensor. New and experienced users will benefit from the detailed technical information and operating instructions for Sensortech hardware and software options and accessories. In this manual, the ST-3300 Series Smart RF Sensors are also referred to by the general term “Gauge”. Hardware Revisions and Software Versions covered by this manual: ST-3300 Series Hardware Revision: A (and above) ST-3300 Series Firmware Version: 0.04 (and above) -
Page 4: Table Of Contents
Measure Configuration Screen ........................30 Product Configuration Screen ......................... 34 I/O Configuration Screen ..........................35 Calibration Screen ............................36 Offset Mode ..............................37 Offset Calibration Procedure ........................... 38 Linear Mode ..............................38 © Sensortech Systems, Inc. 2016 Screen 4 of 60... - Page 5 I/O Unit Terminal Board Layout ........................48 I/O Unit Terminal Board Signals ........................49 Sensor Status and Error Messages ........................50 ST-3300 Sensor RS-485 Communications Interface Specification ................51 ST-3300 MODBUS-RTU Serial Communications Interface................51 © Sensortech Systems, Inc. 2016 Screen 5 of 60...
-
Page 6: Introduction
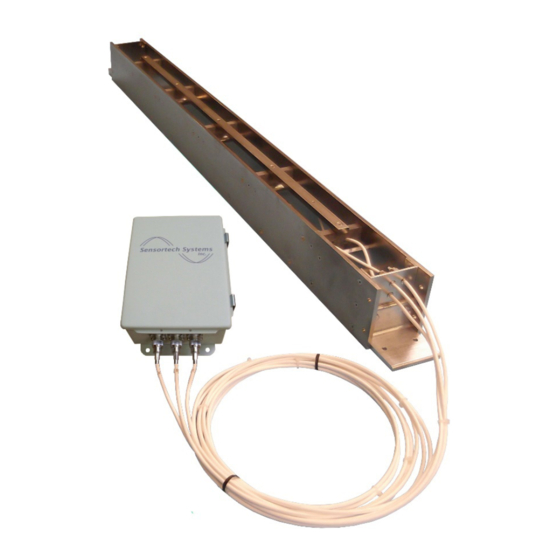
System Overview The ST-3300 Series Sensor is a complete measurement and interface system where all signal processing and control functions are self-contained. It features multiple interface protocols including one isolated 4-20mA output, an RS-485 serial communication port, a Digital Input and a Product Temperature Input. Optional communications protocols include OI-6000 Operator Interface, Ethernet TCP/IP, DeviceNet, PROFIBUS, PROFINET and EtherNet/IP as well as digital inputs and outputs for external sample gating and control. - Page 7 ST-3300 Smart RF Sensor Technical Manual Figure 1: Example of In-Kiln Open Frame Planar Sensor System Figure 2: Example of Out-of-Kiln Open Frame Planar Sensor System © Sensortech Systems, Inc. 2016 Screen 7 of 60...
-
Page 8: Sensor Electronics
Figure 3 shows a block diagram of the Sensor electronics. Measurement is made by switching between one of three RF channels: C A , C H , C L and Sensortech Systems developed and patented a specific method of dielectric determination using radio frequency. This is known as the resonant frequency technique. - Page 9 C coefficient = offset calibration coefficient for Product selected (ZERO) STD = Standardization Factor (calculated) = calculated raw dielectric value Pre-Zero = calculated raw dielectric value with empty Sensor – air only from Pre-Zero Calibration © Sensortech Systems, Inc. 2016 Screen 9 of 60...
- Page 10 Status LED next to the button lights up to indicate a Zero calibration has been performed. The user then places a Standardization Plate over the Sensor and presses the Standardize button. The Status LED next to the button lights up to indicate a Standardize calibration has been performed. © Sensortech Systems, Inc. 2016 Screen 10 of 60...
-
Page 11: Resonant Frequency Dielectric Measurement
Sensortech Systems developed and patented a specific method of dielectric determination using radio frequency. This is known as the resonant frequency technique. - Page 12 Electrically, the Sensor Antenna, is simply a capacitor. The electrical analogy of the gypsum product is itself a capacitance with parallel resistance. The resistance or conductance represents the ionic conductance or dielectric loss in the board. © Sensortech Systems, Inc. 2016 Screen 12 of 60...
- Page 13 (L). This network has a unique resonant frequency at which inductive reactance cancels capacitive reactance and network impedance is at a maximum. Impedance at resonance is actually resistance ( © Sensortech Systems, Inc. 2016 Screen 13 of 60...
- Page 14 ST-3300 Smart RF Sensor Technical Manual Figure 11: Electrical Schematic Example of a Resonant Circuit Figure 12: Frequency, Phase and Impedance relationships of Resonant Network © Sensortech Systems, Inc. 2016 Screen 14 of 60...
- Page 15 In order to correct for this, the product mass, weight or density must be taken into consideration. © Sensortech Systems, Inc. 2016 Screen 15 of 60...
-
Page 16: Open Frame Planar Sensor Antenna Measurement
To determine Kw, a constant moisture product of varying mass is presented to Sensor. A graph of log (Sensor response) vs. log (mass) must be plotted. Kw is given by the slope of this line (see Figure 14). © Sensortech Systems, Inc. 2016 Screen 16 of 60... - Page 17 Compensated Sensor = product dielectric * (distance + Kd) 2 If moisture and density are uncontrolled such as raw material measurement, it is better to control or constrain the distance variation rather than try to compensate for it. © Sensortech Systems, Inc. 2016 Screen 17 of 60...
- Page 18 M c = M u (D + 0.14) 2 The offset coefficient Kd (.14) is determined by trial and error to obtain flattest response. Distance Figure 15: Plot of Sensor Measurement vs. Product Distance © Sensortech Systems, Inc. 2016 Screen 18 of 60...
-
Page 19: Sensor Antenna Design
Sensortech Systems, Inc. has over a period of years, developed many unique electrode designs including: parallel plate, planar, cylindrical (pipeline), probe and co-axial types. The most widely used style is the planar type shown in figure 2. -
Page 20: Theory Of Operation
This isn't always correct, but it is a major simplification, and it is suitable for many materials. When the electric field is removed the atom returns to its original state. © Sensortech Systems, Inc. 2016 Screen 20 of 60... -
Page 21: Moisture Determination By Dielectric Measurement
Temperature effect on solids is typically small, but on liquids can be significant. The internal temperature of a gypsum board after 1st zone drying should be very constant around 100°C, provided the board is not over-dried. Temperature compensation is therefore not required for gypsum board applications. © Sensortech Systems, Inc. 2016 Screen 21 of 60... -
Page 22: St-3300 Configuration Software
20mA outputs or the user may use the Modbus digital interface for continuous monitoring on the user PLC/Controller. An Operator Interface unit or process controller may also be connected to the Sensor digital interface for Sensor configuration, calibration and monitoring measurements. © Sensortech Systems, Inc. 2016 Screen 22 of 60... -
Page 23: Connecting To The Sensor Using The Rs-485 Interface
Data Bits Parity None None Flow Control None None Host PC PLC/Controller RS-485 ST-3300 I/O Unit Figure 19: Digital RS-485 Serial Interface Connection See the APPENDIX for wiring and connector information. © Sensortech Systems, Inc. 2016 Screen 23 of 60... -
Page 24: St-3300 Configuration Program Operation
Press the red "Connect" button at the lower left. When a Sensor is connected, the “Connect” button will change color from red to green and the information fields to the right of the "Connect" button will display the data read from the connected Sensor. © Sensortech Systems, Inc. 2016 Screen 24 of 60... -
Page 25: Main Screen - Sensor Connected
The Main Screen above is shown after a Sensor is connected to the host PC/Controller, the user has logged in using the factory default password and a moisture measurement has started. © Sensortech Systems, Inc. 2016 Screen 25 of 60... - Page 26 18. Current Product: Displays the Product name of the currently active product configuration. Lower status display bar is updated with current Sensor and measurement status. See Table 2 for Sensor status and error messages. © Sensortech Systems, Inc. 2016 Screen 26 of 60...
-
Page 27: Setup Screen
5. Auto Connect Mode checkbox: When selected, will automatically connect to Ethernet TCP/IP devices connected to the Ethernet port such as an Operator Interface unit. 6. Data Folder: specifies the pathname where all gauge data will be stored. © Sensortech Systems, Inc. 2016 Screen 27 of 60... -
Page 28: Diagnostics Screen
Sample Period and Sensor Antenna design. Dr: calculated Raw Dielectric value. The Dr value should be approx. 1 with no product on the Sensor. © Sensortech Systems, Inc. 2016 Screen 28 of 60... - Page 29 Freq Lock Mode: Pull down menu for selecting Normal mode of operation or to lock the measurement to a single channel for Sensor (Fs), Low Reference (Fl) and High Reference (Fh). Normal mode should be selected for process measurements. © Sensortech Systems, Inc. 2016 Screen 29 of 60...
-
Page 30: Measure Configuration Screen
1. Measure Method: drop-down menu selects the measurement mode of the Sensor. A Sensor can be configured to operate in one of 5 different measurement modes as described in Table 1. © Sensortech Systems, Inc. 2016 Screen 30 of 60... - Page 31 7. Sample Period (msec): The Sensor circuitry can be configured to sample every 5, 10, 20, 50 or 100 milliseconds (5ms = 200 samples/sec.). The Sensor is capable of handling this sampling rate, but in many applications a slower rate is desirable. © Sensortech Systems, Inc. 2016 Screen 31 of 60...
- Page 32 Damping Filter Size is 500. Thus at Sample Period=10mS, Median Filter Size=1, Mean Filter Size=1, Sensor Measurements per cycle=98 and Damping Filter Size=500 would equate to 8.33 seconds of averaging. Only integer values may be entered between 1 and 500. © Sensortech Systems, Inc. 2016 Screen 32 of 60...
- Page 33 Sensor will perform the measurement correctly and in the mode desired. The “Get” button loads information from the Sensor and the “Send” button writes to the Sensor. © Sensortech Systems, Inc. 2016 Screen 33 of 60...
-
Page 34: Product Configuration Screen
3. Coefficient C: user programmable positive or negative value that defines the measurement offset. 4. Product Name: user defined name composed of alphanumeric characters. The “Get” button loads information from the Sensor and the “Send” button writes to the Sensor. © Sensortech Systems, Inc. 2016 Screen 34 of 60... -
Page 35: I/O Configuration Screen
4. Levels Corresponding to 4-20mA: port 1 20mA: moisture value corresponding to a 20mA output. 5. Digital Output 1: not used. 6. Digital Output 2: not used. The “Get” button loads information from the Sensor and the “Send” button writes to the Sensor © Sensortech Systems, Inc. 2016 Screen 35 of 60... -
Page 36: Calibration Screen
7. Store Sample: This button stores the average value obtained during the sample period into the data table. 8. Create Sample: This is used for manual entry of values in the Gauge and corresponding Lab field. © Sensortech Systems, Inc. 2016 Screen 36 of 60... -
Page 37: Offset Mode
In most cases, the Sensor has been statically calibrated in our factory for your application. Once the Sensor has been installed on-line, a single sample comparison with the measurement value will determine if an offset is necessary. © Sensortech Systems, Inc. 2016 Screen 37 of 60... -
Page 38: Offset Calibration Procedure
10. Press the ‘Recalculate Coefficients’ button. The ‘Gauge’ values and the ‘Lab’ values will be used to recalculate the coefficient values to find the best fit. The new ‘Gauge’ coefficient values appear in the ‘Recalculated’ fields. © Sensortech Systems, Inc. 2016 Screen 38 of 60... - Page 39 If not, uncheck the disable checkbox. If disabling a data point significantly improves correlation, that data point may be permanently removed by highlighting the row in the table and pressing the ‘Delete Sample’ button. © Sensortech Systems, Inc. 2016 Screen 39 of 60...
-
Page 40: Suggestions For Taking Product Samples
Use the most accurate testing method available. An oven dry test with a 100g sample is generally more accurate than a lamp dry test with a 10g sample. Note: The calibration can only be as accurate as the sampling method. © Sensortech Systems, Inc. 2016 Screen 40 of 60... -
Page 41: Maintenance Screen
3. Current Value: current moisture measurement with B coefficient = 1 and C coefficient = 0. 4. Dz: stored Pre-Zero dielectric value from last Pre-Zero Calibration. 5. Standardization Target 0-100: stored dielectric reference value. 6. Standardization Factor: stored Standardization Factor value from last Standardize Calibration. © Sensortech Systems, Inc. 2016 Screen 41 of 60... -
Page 42: Pre-Zero Calibration
Sensor and the Status LED next to the button lights up to indicate a Pre-Zero calibration has been performed. The Status LED next to the ZERO button lights up to indicate a Standardize calibration has been performed. © Sensortech Systems, Inc. 2016 Screen 42 of 60... -
Page 43: Standardize Calibration
The user places a Standardization Plate over the Sensor and the user opens the lid of the enclosure and presses the Standardize button. The Status LED next to the button lights up to indicate a Standardize calibration has been performed. © Sensortech Systems, Inc. 2016 Screen 43 of 60... -
Page 44: Pre-Zero Calibration Procedure - Using The Configuration Program
3. Check the M12 cables are undamaged, connected and securely tightened on the Sensor Electronics Unit and the I/O Unit. Where possible open the enclosures to check for debris or moisture. © Sensortech Systems, Inc. 2016 Screen 44 of 60... -
Page 45: Pre-Zero Calibration Procedure - Using The I/O Unit Push-Buttons
3. Check the M12 cables are undamaged, connected and securely tightened on the Sensor Electronics Unit and the I/O Unit. Where possible open the enclosures to check for debris or moisture. © Sensortech Systems, Inc. 2016 Screen 45 of 60... -
Page 46: Appendix
M12 x 4 Pin Connector Signal Name Signal Description PROD_TEMP_IN Product Temperature measurement positive input (configurable for 4-20mA or 0-1VDC input) Ground +15V Ground +15VDC +15VDC power output @ 0.1A No connect © Sensortech Systems, Inc. 2016 Screen 46 of 60... -
Page 47: I/O Unit External Connectors
External LED Status Indicator Input (0-3.3V output @ 0.02A) ZERO Open Collector Output for Pre-Zero Calibration (0V output = perform Pre-Zero Calibration) DIG_IN- External Gate Control Negative Digital Feedthru Ground System Ground +15VDC +15VDC Power Input No connect © Sensortech Systems, Inc. 2016 Screen 47 of 60... -
Page 48: I/O Unit Terminal Board Layout
ST-3300 Smart RF Sensor Technical Manual I/O Unit Terminal Board Layout Figure 32: I/O Unit Terminal Board Layout Figure 33:. © Sensortech Systems, Inc. 2016 Screen 48 of 60... -
Page 49: I/O Unit Terminal Board Signals
Users RS-485 Bus A TxD- Users PLC/Controller RS-485 TxD- Safety Ground Safety Ground Safety Ground (90-250VAC 50-60Hz) Line / Hot Line / Hot Line / Hot (90-250VAC 50-60Hz) Neutral Neutral Neutral (90-250VAC 50-60Hz) © Sensortech Systems, Inc. 2016 Screen 49 of 60... -
Page 50: Sensor Status And Error Messages
In Timed Sample mode. Purging last sample from sample cup. In Signal Gated sample mode. Holding last sample measurement until signal gate Connected – NO_GATE level goes high or measurement threshold is exceeded. © Sensortech Systems, Inc. 2016 Screen 50 of 60... -
Page 51: St-3300 Sensor Rs-485 Communications Interface Specification
ST-3300 Smart RF Sensor Technical Manual ST-3300 Sensor RS-485 Communications Interface Specification Sensortech Systems, Inc. is disclosing this manual to you solely for use to operate with Sensortech hardware devices. You may not reproduce, distribute, republish, download, display, post, or... - Page 52 (MSB) position. The LSB is extracted and examined. If the LSB is a 1, the register is XOR’d with a preset, fixed value. If the LSB was a 0, no XOR takes place. This process is repeated until eight shifts have been © Sensortech Systems, Inc. 2016 Screen 52 of 60...
- Page 53 The final contents of the CRC register is the CRC value. When the CRC is placed into the message, its upper and lower bytes must be swapped as described in chapter 9-1 “Modbus Protocol” (CRC). © Sensortech Systems, Inc. 2016 Screen 53 of 60...
- Page 54 Note: This function performs the swapping of the high/low CRC bytes internally. Therefore the CRC value returned from the function can be directly placed into the message for transmission. The function returns the CRC as a type UINT16, and takes two arguments: © Sensortech Systems, Inc. 2016 Screen 54 of 60...
- Page 55 0xFF, 0x3F, 0x3E, 0xFE, 0xFA, 0x3A, 0x3B, 0xFB, 0x39, 0xF9, 0xF8, 0x38, 0x28, 0xE8, 0xE9, 0x29, 0xEB, 0x2B, 0x2A, 0xEA, 0xEE, 0x2E, 0x2F, 0xEF, 0x2D, 0xED, 0xEC, 0x2C, 0xE4, 0x24, 0x25, 0xE5, 0x27, 0xE7, 0xE6, 0x26, © Sensortech Systems, Inc. 2016 Screen 55 of 60...
- Page 56 Bit 4 Set = Board Temperature Alarm Bit 5 Set = Reference Frequency Error Bit 6 Set = Bad Zero Bit 7 Set = Bad Standardization Bits 8-31 reserved for future use © Sensortech Systems, Inc. 2016 Screen 56 of 60...
- Page 57 Bit 5 Set = Reference Frequency Error Bit 6 Set = Bad Zero Bit 7 Set = Bad Standardization Bits 8-31 reserved for future use Future Use - unsigned 32 bit integer (4 bytes) © Sensortech Systems, Inc. 2016 Screen 57 of 60...
- Page 58 5- Auto Reference Sample Period – 16 bit integer (2 bytes) Milliseconds: 5, 10(default), 20, 50, 100 Sensor Measurements– 16 bit integer (2 bytes) Sensor measurements per cycle 1-500, default: 98 © Sensortech Systems, Inc. 2016 Screen 58 of 60...
- Page 59 Port2 4-20mA Select - 16 bit integer (2 bytes) 0 = Moisture 1 = Product Temperature Port1 4mA Level – IEEE float (4 bytes) 0-100 Port1 20mA Level – IEEE float (4 bytes) 0-100 © Sensortech Systems, Inc. 2016 Screen 59 of 60...
-
Page 60: Sensortech Systems, Inc. 2016 Screen 4 Of
Coefficient B (span) - IEEE float (4 bytes) Coefficient C– (zero) - IEEE float (4 bytes) Alarm Limit 1 - IEEE float (4 bytes) Alarm Limit 2– IEEE float (4 bytes) Product Code Description – character string (100bytes) © Sensortech Systems, Inc. 2016 Screen 60 of 60...
Need help?
Do you have a question about the ST-3300 Series and is the answer not in the manual?
Questions and answers