Table of Contents
Advertisement
Tel: (01943) 602001- WWW.ISSLTD.CO.UK - Fax: (01943) 816796
i
ThermoView Ti30
User's Manual
Systems & Services
July 1, 2003
Version 1.0
PO Box 1
Ilkley
West Yorkshire
Phone: 01943 602001
Phone: 01943 602001
i
Website: www.issltd.co.uk
n
nstrumentation
LS29 8EU
Fax: 01943 816796
Fax: 01943 816796
Email: sales@issltd.co.uk
Ltd
i
Advertisement
Table of Contents

Summary of Contents for RayTek ThermoView Ti30
- Page 1 ThermoView Ti30 Tel: (01943) 602001- WWW.ISSLTD.CO.UK - Fax: (01943) 816796 Systems & Services User’s Manual July 1, 2003 Version 1.0 PO Box 1 Ilkley West Yorkshire Phone: 01943 602001 Phone: 01943 602001 Fax: 01943 816796 Fax: 01943 816796 Website: www.issltd.co.uk Email: sales@issltd.co.uk...
-
Page 2: Table Of Contents
CONTENTS Introduction... 7 Quick Specifications Table ... 8 Chapter 1 Unpacking Your New Imager ... 9 First, the Batteries ... 10 Charging the Rechargeable Battery Pack ... 12 Normal Charge Cycle ... 12 Chapter 2 Getting Started... 14 Attaching the Wrist Strap... 14 Turning the Unit On... - Page 3 Looking at Your Downloaded Images... 38 Chapter 4 Obtaining the Best Image ... 41 The Importance of Focusing ... 41 Selecting the Color Palette... 42 Selecting the Measurement Mode... 42 Gain and Level Thumbwheels ... 45 Chapter 5 Qualitative and Quantitative Temperature Measurements 46 Distance to Target (Spot) Ratio ...
- Page 4 Appendix B – Infrared Theory Q&A... 71 Glossary ... 75 July 1, 2003 - 4 - Version 1.0 Tel: (01943) 602001- WWW.ISSLTD.CO.UK - Fax: (01943) 816796...
-
Page 5: Warranty Information
Warranty Information Raytek warrants this product to be free from defects in material and workmanship under normal use and service for a period of one year from date of purchase, except as hereinafter provided. -
Page 6: Customer Service Contact Information
Customer Service Contact Information Instrumentation Systems & Services Ltd P.O. Box 1 ILKLEY West Yorks LS29 9QE UK July 1, 2003 - 6 - Version 1.0 Tel: (01943) 602001- WWW.ISSLTD.CO.UK - Fax: (01943) 816796... -
Page 7: Introduction
We are confident the ThermoView Ti30 imager is both an easy-to-use, yet powerful, thermal imaging tool on the market today. We know you will find it a valuable and indispensable tool for your workplace and for your professional growth. -
Page 8: Quick Specifications Table
Quick Specifications Table Thermal Measurement Range Accuracy Repeatability NETD Temperature Indication Resolution Spectral Range Target Sighting Optical Resolution Minimum Diameter Measurement Spot Image Frame Rate Field of view (FOV) Instantaneous Field of view (IFOV) Focus Temperature Scale Palettes Measurement Modes Laser On/Off Gain Control Level Control... -
Page 9: Chapter 1 Unpacking Your New Imager
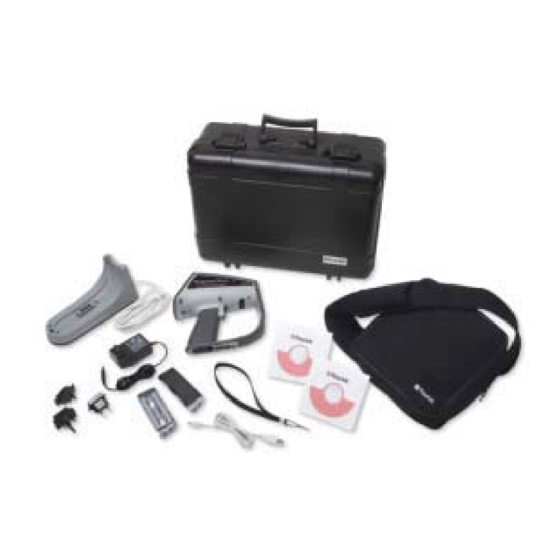
Begin by opening the shipping box. Be sure to save the box and shipping materials in the event you need to ship the imager. In the shipping box, you will find a hard carrying case, containing the following items: 1 ThermoView Ti30 Imager 1 ThermoView Imager Docking Station 1 Universal power supply and plug... -
Page 10: First, The Batteries
First, the Batteries The battery compartment is located in the handle of the unit. The unit is shipped with an empty battery pack for non-rechargeable batteries installed in the battery compartment. Remove the empty battery pack from the battery compartment. The battery pack can be removed by sliding the lock tab towards the trigger. - Page 11 At this point, you have two options: insert six new AA batteries into the empty non- rechargeable batteries pack or replace it with the supplied rechargeable battery pack. You will notice the difference between the two battery packs as shown in Figure 2 below: Non-rechargeable battery pack Rechargeable battery pack (batteries not included)
-
Page 12: Charging The Rechargeable Battery Pack
Charging the Rechargeable Battery Pack Connect the docking station to a power outlet using the supplied universal power adapter. Be sure to use the plug adapter that fits your local electrical standards. Connect the power jack of the power adaptor to the DC power inlet located on the docking station. - Page 13 A charge cycle takes a rechargeable battery pack from whatever level of charge it presently has and brings it to a fully charged condition. The charger will not over-charge a battery pack no matter how many times the button is pushed. Restart / Sync button Figure 4.
-
Page 14: Chapter 2 Getting Started
Chapter 2 Getting Started Your ThermoView imager has settings and capabilities that let you customize its operation for the task at hand. The following section describes each setting on the imager. Attaching the Wrist Strap Your ThermoView imager comes with a wrist strap, which can be attached by clipping the metal part of the strap to the small metal bar at the base of the imager (see Figure 5 below). -
Page 15: Turning The Unit On
Turning the Unit On Power is switched on or off by opening or closing the lens door. Sliding down the lens door turns the imager on (see Figure 6 below). Slide the door up to turn off the imager. Figure 6. Powering the ThermoView Imager On and Off The unit is self-protected against excessive levels of infrared radiation and it will Note: cause the unit to automatically shut down. - Page 16 Unit Serial Number Date and Time (configured by the user through the software) Tag name is the name of the user-defined folder from which data was uploaded through the software. Useful tag names are department names or area associated with the unit. This space is blank until configured by the user. Station is the name of the networked computer associated with a specific unit.
- Page 17 Temperature scale Location name LCD backlight icon Figure 8. Normal Mode Take time to experiment with the imager and become familiar with how the thermal image is updated on the display as you aim the imager at different targets with different thermal patterns.
-
Page 18: Settings And Controls
Settings and Controls Keypad Three buttons located below the LCD screen allow you to select operation modes and change parameter values. These buttons are the MODE button, the Up button, and the Down button. The Up and Down buttons are used mostly to increment and decrement parameter values. - Page 19 Push buttons (toggle) Thumbwheels Figure 10. ThermoView Imager Settings Switches (icons not shown) The illustration below shows the top view of the switch bay without the door. There is an icon printed near each switch and near each switch position indicating the function of each switch and switch position.
-
Page 20: Laser On/Off Toggle Button
Laser ON/OFF LCD backlight selection Palette selection Level adjustment Figure 11. ThermoView Imager Settings Switches Laser On/Off Toggle Button Laser On/Off toggle button switches the laser on and off. By default, the guiding laser beam is off. Depending on the situa beam. - Page 21 Figure 12. Laser Aperture and Optical Channel The laser is only a sighting aid. It is not required to take measurements. The laser is Note: not coaxial with the infrared channel, thus the laser dot is offset from the center of the thermal image.
-
Page 22: Centigrade/Fahrenheit Toggle Button
Centigrade/Fahrenheit Toggle Button Centigrade/Fahrenheit button toggles the displayed temperature data in either Centigrade or Fahrenheit temperature scales. The factory default is Centigrade. LCD Backlight Illumination Switch LCD Backlight Illumination switch provides three backlight illumination levels as shown below. Full brightness is recommended for indoor use; use Medium brightness to save battery life, and set backlight Off for outdoor applications. -
Page 23: Gain And Level Thumbwheels
There are three measurement mode positions associated with this switch: Automatic Semi Automatic Manual Automatic mode the ThermoView imager automatically adjusts the image to show the lowest temperature value present in the thermal scene (MIN) and the highest temperature value in the scene (MAX). Semi-Automatic mode the ThermoView imager keeps calculating the MIN limit (lowest temperature value on the thermal scene) automatically. -
Page 24: Trigger
Focus Wheel Figure 14. Location of the Focus Wheel See The Importance of Focusing on page 41 for more details. Trigger Actuating the trigger freezes an image prior to storage. While in a regular measurement mode, pull the trigger momentarily, release it, and the thermal image on the display will be frozen so you can evaluate it for storage. -
Page 25: Man Machine Interface Flow Charts
Man Machine Interface Flow Charts Main Loop July 1, 2003 - 25 - Version 1.0 Tel: (01943) 602001- WWW.ISSLTD.CO.UK - Fax: (01943) 816796... -
Page 26: Image Recording Procedure
Image Recording Procedure Emissivity Adjustment Procedure July 1, 2003 - 26 - Version 1.0 Tel: (01943) 602001- WWW.ISSLTD.CO.UK - Fax: (01943) 816796... -
Page 27: Reflected Temperature Compensation Adjustment Procedure
Reflected Temperature Compensation Adjustment Procedure Recall Images Procedure July 1, 2003 - 27 - Version 1.0 Tel: (01943) 602001- WWW.ISSLTD.CO.UK - Fax: (01943) 816796... -
Page 28: Quick Image Fix Procedure
Quick Image Fix Procedure Array Recalibration Procedure Recording an Image Recording images with the ThermoView imager is simple. Repeat the steps below and record as many images you want until you get familiar with the process. First, note the number of the current image location. At this point, if you have not stored any images, the location number should be set at 1 (default) and the location descriptor will be blank. -
Page 29: Retrieving An Image
To erase an image, just store a new image over the one you wish to delete. To do Note: this, go to Recall Images Procedure, press Down button once to decrement the location, press Mode button or trigger to get back to measurement mode, and pull trigger again to save a new image. -
Page 30: Chapter 3 Downloading And Looking At Images
Product registration is very important since it allows you to get free software updates from Raytek and helps us provide you with the fastest and most efficient technical support. -
Page 31: Connecting The Docking Station To Your Computer
Connecting the Docking Station to Your Computer The docking station provides a solid and convenient base for the ThermoView imager. The docking station keeps the ThermoView imager available and connected to the computer or workstation. In addition, it keeps the batteries charged and ready to go. The docking station connects to your computer through its USB port. - Page 32 Figure 18. Connecting the USB Connector to the USB Port Dock the imager in the docking station. The first time you place the imager in its docking station and press the SYNC button with the docking station connected, your computer's operating system will detect new hardware and locate the correct communication driver.
- Page 33 Figure 20. InsideIR Main Screen at Program Launch If you wish to view the sample images now, click the plus sign to the right of the Samples folder to open it. Then double-click on the session name (My collection, in our example below).
-
Page 34: Downloading Images
Downloading Images You are now ready to download the images you recorded in your ThermoView Ti30 imager. Locate the SYNC button in the docking station. Press the SYNC button once to begin the download process. SYNC button Figure 22. The SYNC button... -
Page 35: Saving Images
Figure 23. Download Data Screen You can browse through the images by clicking and dragging the horizontal and vertical scroll bars. You cannot delete individual images. You must decide whether to save the entire collection or not. Click Save Data to save it. By clicking Cancel, the data is not saved to the disk. The following window appears when images are saved, signaling a successful operation: Click on OK. -
Page 36: Setting The Imager Clock
Setting the Imager Clock It is very important to set the Imager Clock in your ThermoView Ti30 imager because it records a time / date stamp with each stored image. This is important for meaningful reports and trending. - Page 37 The following window appears: 2. Click the Date arrow to see the calendar. The following window appears: Click on the side arrow buttons to change the current year / month Click to select the day of the month. The following windows appears: July 1, 2003 Tel: (01943) 602001- WWW.ISSLTD.CO.UK - Fax: (01943) 816796 - 37 -...
-
Page 38: Field Usb Port
In the event you need to download your images to a computer without the docking station, you may use the USB cable included with your ThermoView Ti30. Connect the cable to the Field USB port, under the display. (See Figure 25) Once the cable is connected, follow all steps previously described. - Page 39 Figure 26. Viewing Thumbnail Images You can view a larger version of a single image by clicking on the thumbnail of the image you wish to view. When viewing a single image, you may move to the next or the previous image by clicking on the Previous Image or Next Image button on the left side of the screen (see Figure 27 below).
- Page 40 Figure 27. Viewing a Single Image July 1, 2003 - 40 - Version 1.0 Tel: (01943) 602001- WWW.ISSLTD.CO.UK - Fax: (01943) 816796...
-
Page 41: Chapter 4 Obtaining The Best Image
Chapter 4 Obtaining the Best Image The Importance of Focusing The focusing ability of the imager is similar to the one found on regular photographic cameras, and it is defined as the ability to adjust the optical system to capture the highest amount of infrared energy from the target, thus allowing the sharpest thermal image of the target to be displayed. -
Page 42: Selecting The Color Palette
There are three measurement mode positions associated with this switch: Automatic Automatic mode the ThermoView Ti30 imager automatically adjusts the image to show the lowest temperature value present in the thermal scene (MIN) and the highest July 1, 2003 Tel: (01943) 602001- WWW.ISSLTD.CO.UK - Fax: (01943) 816796... - Page 43 temperature value in the scene (MAX). The MIN and MAX values are displayed at the beginning and at the end of color scale. This mode does not require any other adjustment (other than properly focusing the unit). Automatic mode is recommended every time the user first starts looking at a given target since the temperature limits are unknown.
- Page 44 Graphically, it would look like this: In summary: you need to adjust Level to get close to temperature level you are interested in and then adjust Gain to get you more or less resolution as needed around the desired level. Always begin by selecting the Automatic mode.
-
Page 45: Gain And Level Thumbwheels
Manual mode the user can adjust Gain and Level manually. Use this measurement mode when you need more freedom to define Level and Gain values. This mode provides the flexibility to bring both MIN and MAX values to the desired cut-off levels and to adjust the temperature interval to a minimum, thus maximizing color resolution. -
Page 46: Chapter 5 Qualitative And Quantitative Temperature Measurements
Chapter 5 Qualitative and Quantitative Temperature Measurements Most of the time thermal imager users are measuring apparent temperatures that are inextricably linked to qualitative inspections. Qualitative inspections focus on temperature differences as opposed to actual temperatures. The reason is that temperature differences are sufficient to indicate most abnormalities in electrical and mechanical equipments. -
Page 47: D:s Ratio: D / S = 90
D:S ratio: D / S = 90 The number “90” means that at a distance D equal to 1 meter the unit will measure a circle of diameter S equal to 1.1cm (1meter divided by 90); at distance D equal to 2 meters it will measure a circle with diameter S equal to 2.2cm and so on in a linear progression. -
Page 48: Environmental Conditions
Figure 30. Field of View When accuracy is critical make sure that the target is at least twice as large as the Tip: spot size. Environmental Conditions Watch for environmental conditions in the working area. Steam, dust, smoke, etc., can prevent accurate measurement by obstructing the path between the target and the unit's optics. -
Page 49: Emissivity
To set or change the Emissivity value, complete the following: 1. Put the ThermoView Ti30 imager in regular Measurement mode. 2. Press the MODE button once. At this point you will be able to adjust Emissivity. - Page 50 1. You will need an infrared reflector. Take a piece of aluminum foil. Crumple and re- flatten the foil and put it on a cardboard plate, shiny side up. 2. Put the ThermoView Ti30 imager in regular Measurement mode. 3. Press the MODE button once. At this point you will be able to adjust Emissivity.
-
Page 51: Chapter 6 Organizing Your Data
Chapter 6 Organizing Your Data The ThermoView imager when used together with the InsideIR software provides a powerful way to organize and track maintenance data. Different groups of equipment can be inspected and data specific to different plant areas or departments can be individually named, saved, stored and retrieved in a straightforward fashion. -
Page 52: Uploading Data To The Imager
Upload Setup Imager button on the InsideIR main screen to upload data to the ThermoView imager. This displays the following screen: Select the folder and session you want to upload and press Next. Figure 33. Uploading Data to Your ThermoView Ti30 Imager July 1, 2003 - 52 - Version 1.0... - Page 53 If you wish to change parameters for different locations such as location name, emissivity, reflected temperature compensation, low and high alarms, and comments, you can do so by right-clicking the thumbnail of the image you wish to edit, clicking Edit data in the pop-up menu, and changing the desired field(s).
- Page 54 If you wish to restore the default parameters on the unit press the Restore button. Note By doing this all 100 locations on the imager will be restored with the factory parameters. These default parameters are: Location name: blank Emissivity: 1.00 RTC: OFF Low alarm: 0°C / 32°...
-
Page 55: Chapter 7 Analyzing Your Data
When the Scale Limits radio button at the bottom of the Image screen is selected, the limit bar underneath the image shows the temperature range your ThermoView Ti30 imager is capable of measuring. The minimum (0º C / 32º F) is represented at the far left of the bar, and the maximum (250º... - Page 56 Figure 35. Sample Image at Original Scale Limits Figure 36. Sample Image After Increasing Scale Limits July 1, 2003 - 56 - Version 1.0 Tel: (01943) 602001- WWW.ISSLTD.CO.UK - Fax: (01943) 816796...
-
Page 57: Isotherms
Isotherms When the Isotherm radio button at the bottom of the Image screen is selected, the limit bar underneath the image shows the temperature range captured in the current thermal image. The red area on the limit bar indicates the range of temperatures displayed in red in the image. -
Page 58: Additional Image Analysis Tools
Figure 38. Sample Image After Adjusting Isotherm Level Additional Image Analysis Tools You can tile the window vertically or horizontally by selecting the appropriate choice under the Window menu. The tiled windows may then be resized by grabbing any corner of the window and dragging accordingly. -
Page 59: The Profile Tab
Figure 39. The Temperature Table As mentioned above, this data can be saved as a .txt file, for import into a spreadsheet program for your own in-depth analysis. The Profile Tab There are two main components in the profile: an interactive radiometric thermal image on the top, and underneath it, a graph indicating the temperatures at the x and y axes of the cursor on thermal image. -
Page 60: The Histogram Tab
Figure 40. The Profile Tab The Histogram Tab The Histogram tab provides a summary of the pixel data presented on the previous screens. The histogram displays temperature values as either a percentage of the all temperature values captured in a given thermal scene, or by number of representative pixels in the thermal scene. -
Page 61: The Menu Bar
Figure 41. The Histogram Tab – Changing the Histogram Limits If you wish to use the chart or chart data in another program, you may select Copy Chart on the Images > Histogram menu. The information will be saved to your Windows clipboard, and can then be pasted into Word or Excel, using either the Paste or Paste Special command. -
Page 62: Temperature Scale
ThermoView Imager Info Product-specific information about each ThermoView Ti30 imager you have used with a specific computer. This is useful when contacting the factory for service information. It is also useful to use the name of the individual units at the highest level in your directory structure, keeping all images stored by a single unit in the same folder. -
Page 63: Image
Image The Image menu items are only active when at least one image is selected. Note: Export Image Allows you to save an image for use with another application in any of the following file formats: .bmp .jpg .gif .png .tiff .wmf .exif... -
Page 64: Window
Copy Profile Chart Saves the chart from the Profile tab to your Windows clipboard, and can then be pasted into Word or Excel, using either the Paste or Paste Special command. Window Cascade Cascades all open windows. Tile Horizontal If you have more than one window open, this command will divide display them tiled horizontally. -
Page 65: Reporting Your Findings
Reporting Your Findings The ThermoView Ti30 imager provides report forms for you to use in reporting your findings. To generate a report, you must first select an image from a given location. Then select Image from the Menu Bar and choose Create Report from the drop down list. -
Page 66: Appendix A - Technical Reference
Appendix A - Technical Reference Imager Accuracy Chart The following graph shows the measurement accuracy for a typical instrument over the measurement range of 0 – 250ºC. The heavy lines show the specified accuracy. July 1, 2003 Tel: (01943) 602001- WWW.ISSLTD.CO.UK - Fax: (01943) 816796 SOURCE TEMPERATURE Specification... -
Page 67: Imager Reading Error Vs Source D:s
These tables are to be used as a guide only, as emissivity changes with temperature, Note viewing angle, wavelength, target geometry and surface finish. Your ThermoView Ti30 thermal imager measures infrared energy in the 7 – 14 µm Note range. - Page 68 Table 1. Emissivity Values for Metals Material Aluminum Unoxidized Oxidized Alloy A3003, Oxidized Roughened Polished Brass Polished Burnished Oxidized Chromium Copper Polished Roughened Oxidized Electrical Terminal Blocks Gold Haynes Alloy Inconel Oxidized Sandblasted Electropolished Iron Oxidized Unoxidized Rusted Molten Iron, Cast Oxidized Unoxidized Molten...
- Page 69 Material Oxidized Unoxidized Monel (Ni-Cu) Nickel Oxidized Electrolytic Platinum Black Silver Steel Cold-Rolled Ground Sheet Polished Sheet Molten Oxidized Stainless Tin (Unoxidized) Titanium Polished Oxidized Tungsten Polished Zinc Oxidized Polished Table 2. Emissivity Values for Non-Metals Material Asbestos Asphalt Basalt Carbon Unoxidized Graphite...
- Page 70 Material “Gob” Gravel Gypsum Limestone Paint (non-Al.) Paper (any color) Plastic (opaque, over 20 mils) Rubber Sand Snow Soil Water Wood, Natural To optimize surface temperature measurement accuracy consider the following: 1. Determine the object emissivity for the spectral range of the instrument to be used for the measurement.
-
Page 71: Appendix B - Infrared Theory Q&A
Appendix B – Infrared Theory Q&A Q. Why use noncontact infrared thermometers? A. Noncontact infrared (IR) thermometers use infrared technology to quickly and conveniently measure the surface temperature of objects. They provide fast temperature readings without physically touching the object. The temperature is shown on the LCD display. - Page 72 Q. How to assure accurate temperature measurement? A. A solid understanding of infrared technology and its principles lies behind accurate temperature measurement. When the temperature is measured by a non- contact device the IR energy emitted from the measured object passes through the optical system of the thermometer or thermal imager and is converted to an electrical signal at the detector.
- Page 73 temperature of a shiny object you can compensate by covering the surface to be measured with masking tape or flat black paint. Allow time for the tape or paint to reach the same temperature as the material underneath. Measure the temperature of the taped or painted surface.
- Page 74 5. Process Control & Monitoring: check process temperature of steel, glass, plastics, cement, paper, food & beverage. For additional information on applications for non-contact IR thermometers visit our website at www.raytek.com. July 1, 2003 Tel: (01943) 602001- WWW.ISSLTD.CO.UK - Fax: (01943) 816796 - 74 - Version 1.0...
-
Page 75: Version 1.0
Glossary Absolute Zero The temperature (0 Kelvin) of an object defined by the theoretical condition where the object has zero energy. Accuracy Maximum deviation, expressed in temperature units, or as a percentage of the temperature reading, or as a percentage of the full scale temperature value, or as a percentage of the target temperature, indicating the difference between a temperature reading given by an instrument under ideal operating conditions, and the temperature of a calibration source (per the ASTM standard test method E 1256-88). - Page 76 Background Temperature Temperature behind and surrounding the target, as viewed from the instrument. Blackbody A perfect emitter; an object that absorbs all the radiant energy incident on it at all wavelengths and reflects and transmits none. A surface with emissivity of unity (1.00). °C (Celsius) Temperature scale based on 0°...
- Page 77 Display Resolution The level of precision to which a temperature value can be displayed, usually expressed in degrees or tenths of degrees. Drift The change in instrument indication over a long period of time, not caused by external influences on the device (per the ASTM standard test method E 1256-88). Electro-Magnetic Compatibility is the resistance to electrical signal disturbances within IR thermometers.
-
Page 78: Infrared (Ir)
Focus Point (or Distance) The distance from the instrument where the optical resolution is greatest. Full Scale The maximum of the temperature range or output signal. Full Scale Accuracy A convention for expressing the accuracy as percentage of an instrument’s (highest) full- scale temperature. -
Page 79: Nist Traceability
Low Alarm. Units with this feature can sound an alarm when they sense that a user-defined low temperature has been reached. Laser Single or dual lasers are used in some units for aiming and/or locating the optimum temperature measurement point. Location. - Page 80 Non-Gray Body A radiating object that is partly transparent to infrared (transmits infrared energy at certain wavelengths); also called Colored Bodies. Glass and plastic films are examples of non-gray bodies. Optical Pyrometer A system that, by comparing a source whose temperature is to be measured to a standardized source of illumination (usually com-pared to the human eye), determines the temperature of the former source.
-
Page 81: Relative Humidity
95 percent of full scale temperature indication (per the ASTM standard test method E 1256-88). The specification for Raytek instruments also includes the average time required for software computations. Scatter See Size of Source Effect. - Page 82 Spectral Response The wavelength region in which the IR Thermometer is sensitive. Spot The diameter of the area on the target where the temperature determination is made. The spot is defined by the circular aperture at the target that allows typically 90% of the IR energy to be collected by the instrument, as compared with the 100% spot diameter which is defined by the IR energy collected from a very large target.
-
Page 83: Warm-Up Time
Temperature Resolution The minimum simulated or actual change in target temperature that gives a usable change in output and/or indication (per the ASTM standard test method E 1256-88). Thermal Shock A short-term error in accuracy caused by a transient ambient temperature change. The instrument recovers from its accuracy error when it comes back into equilibrium with the new ambient conditions.
Need help?
Do you have a question about the ThermoView Ti30 and is the answer not in the manual?
Questions and answers