
Related Manuals for Thermo NanoDrop One


Summary of Contents for Thermo NanoDrop One
- Page 1 NanoDrop Micro-UV/Vis Spectrophotometers NanoDrop One User Guide 269-309101 Revision B July 2016...
- Page 2 Telephone: 1 800 532 4752 E-mail: us.techsupport.analyze@thermofisher.com Thermo Fisher Scientific Inc. provides this document to its customers with a product purchase to use in the product operation. This document is copyright protected and any reproduction of the whole or any part of this document is strictly prohibited, except with the written authorization of Thermo Fisher Scientific Inc.
-
Page 3: Table Of Contents
Chapter 1 About the NanoDrop One Spectrophotometer ......1 Instrument Models and Features ........2 Optional Accessories . - Page 4 Custom Method Reported Results....... . 144 NanoDrop One User Guide...
- Page 5 NanoDrop One Data Viewer ........222...
- Page 6 Contact Technical Support ..........313 NanoDrop One User Guide...
-
Page 7: About The Nanodrop One Spectrophotometer
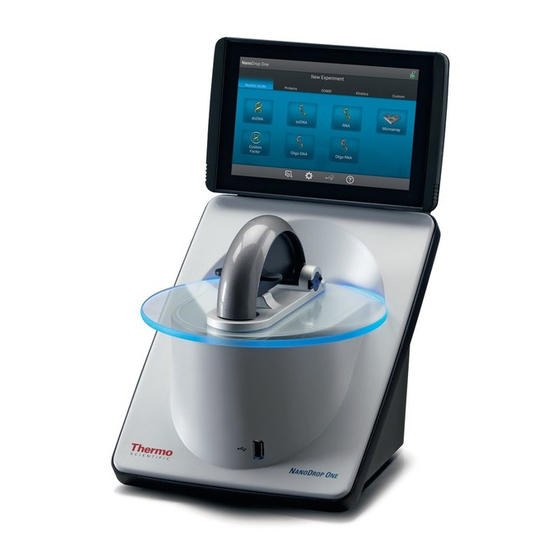
The NanoDrop One system comes with preloaded software and a touchscreen display. The instrument can be connected to an optional USB label printer. NOTICE Before operating a NanoDrop One instrument, please read the safety and operating precautions and then follow their recommendations when using the instrument. -
Page 8: Instrument Models And Features
About the NanoDrop One Spectrophotometer Instrument Models and Features Instrument Models and Features There are two models available for the NanoDrop One NanoDrop One Spectrophotometer Spectrophotometer NanoDrop One spectrophotometer—the NanoDrop One and the NanoDrop One . Both models include the patented... - Page 9 About the NanoDrop One Spectrophotometer Instrument Models and Features Touchscreen Touchscreen can slide left or right to accommodate personal Touchscreen preference, and tilt forward or back for optimal viewing Pedestals USB-A port Two more USB-A ports are located on instrument back panel...
- Page 10 About the NanoDrop One Spectrophotometer Instrument Models and Features NanoDrop One Software with Acclaro Sample Intelligence Technology The Thermo Scientific™ Acclaro™ Sample Intelligence technology built into the NanoDrop One instruments provides these exclusive features to help you assess sample integrity: •...
-
Page 11: Optional Accessories
About the NanoDrop One Spectrophotometer Optional Accessories Optional Accessories A number of accessories are available for the NanoDrop One instruments. To order an accessory, contact your local distributor or visit website. DYMO™ LabelWriter™ 450 USB Label Printer Prints two 5/16-in x 4-in self-adhesive labels for transferring sample data directly into laboratory notebooks or posting on bulletin boards. -
Page 12: Register Your Instrument
About the NanoDrop One Spectrophotometer Register Your Instrument Register Your Instrument Register your instrument to receive e-mail updates on software and accessories for the NanoDrop One instruments. An Internet connection is required for registration. To register your instrument 1. Do one of the following: –... -
Page 13: Update Software
Update Software Update Software Quickly and easily download and install the latest NanoDrop One software and release notes from our website. Follow the steps to update or upgrade the software on your local instrument and/or install or update the NanoDrop One Viewer software on a personal computer (PC). - Page 14 To update or upgrade NanoDrop One instrument software 1. Do one of the following: – From the NanoDrop One Viewer software, open the Help menu and choose NanoDrop One Website to open our website. – From any personal computer that is connected to the Internet, navigate to the NanoDrop website.
-
Page 15: Applications
49.5 ng/μL (cuvette) ±2% for samples >100 ng/μL 1.6 ng/μL (pedestal) 22,000 ng/μL (pedestal) ±2.0 ng/μL for sample concentrations between 2.0 and 100 ng/μL samples; 0.16 ng/μL (cuvette) 60 ng/μL (cuvette) ±2% for samples >100 ng/μL Thermo Scientific NanoDrop One User Guide... - Page 16 280 nm (for proteins) should be less than 62.5 A. • For measurements with 10 mm pathlength cuvettes, maximum absorbance at 260 nm (or 280 nm for proteins) should be less than 1.5 A, which is approximately 75 ng/μL dsDNA. NanoDrop One User Guide Thermo Scientific...
- Page 17 ±2% for samples >8.0 pmol/μL Alexa Fluor 546 0.3 pmol/μL (pedestal) 145 pmol/μL (pedestal) ±0.30 pmol/μL for sample concentrations between 0.30 and 6.0 pmol/μL; ±2% for samples >6.0 pmol/μL Values are approximate Based on five replicates (SD=ng/μL; CV=%) Thermo Scientific NanoDrop One User Guide...
-
Page 19: Measure Dsdna, Ssdna Or Rna
• Do not use a squirt or spray bottle on or near the instrument as liquids will flow into the instrument and may cause permanent damage. • Do not use hydrofluoric acid (HF) on the pedestals. Fluoride ions will permanently damage the quartz fiber optic cables. Thermo Scientific NanoDrop One User Guide... - Page 20 Measure dsDNA, ssDNA or RNA Before you begin... Before taking pedestal measurements with the NanoDrop One instrument, lift the instrument arm and clean the upper and lower pedestals. At a minimum, wipe the pedestals with a new laboratory wipe. For more information, see Cleaning the Pedestals.
- Page 21 – Use a 1-2 μL sample volume. See Recommended Sample Volumes for more information. • For cuvette measurements (NanoDrop One instruments only), use compatible cuvettes and follow best practices for cuvette measurements. Related Topics • Measure a Micro-Volume Sample •...
-
Page 22: Nucleic Acid Reported Results
Tap to end adjust axes; view table with more experiment and double-tap to reset measurement results export data Note Micro-volume absorbance measurements and measurements taken with nonstandard cuvettes are normalized to a 10.0 mm pathlength equivalent. NanoDrop One User Guide Thermo Scientific... -
Page 23: Setting For Nucleic Acid Measurements
• Basic Instrument Operations • Nucleic Acid Calculations Setting for Nucleic Acid Measurements To show the dsDNA, ssDNA or RNA settings, from the dsDNA, ssDNA or RNA measurement screen, tap > Nucleic Acid Setup. Thermo Scientific NanoDrop One User Guide... -
Page 24: Calculations For Nucleic Acid Measurements
Note: Dividing the measured absorbance of a sample solution by its molar extinction coefficient yields the molar concentration of the sample. See Published Extinction Coefficients for more information regarding molar vs. mass concentration values. NanoDrop One User Guide Thermo Scientific... - Page 25 For the Custom Factor application, the • ssDNA (factor = 33 ng-cm/μL) user-specified factor is used. • RNA (factor = 40 ng-cm/μL) • Custom Factor (user entered factor between 15 ng-cm/μL and 150 ng-cm/μL Thermo Scientific NanoDrop One User Guide...
- Page 26 • For cuvette measurements, pathlength is determined by the cuvette Pathlength setting in the software (see General Settings). • Displayed spectra and absorbance values are normalized to a 10 mm pathlength equivalent. NanoDrop One User Guide Thermo Scientific...
- Page 27 1.8 and 2.2 is generally accepted as “pure” for DNA and RNA. Note: Although purity ratios are important indicators of sample quality, the best quality indicator quality is functionality in the downstream application of interest (e.g., real-time PCR). Thermo Scientific NanoDrop One User Guide...
-
Page 29: Measure Microarray
• Do not use a squirt or spray bottle on or near the instrument as liquids will flow into the instrument and may cause permanent damage. • Do not use hydrofluoric acid (HF) on the pedestals. Fluoride ions will permanently damage the quartz fiber optic cables. Thermo Scientific NanoDrop One User Guide... - Page 30 Measure Microarray Before you begin... Before taking pedestal measurements with the NanoDrop One instrument, lift the instrument arm and clean the upper and lower pedestals. At a minimum, wipe the pedestals with a new laboratory wipe. For more information, see Cleaning the Pedestals.
- Page 31 (see the next section). 8. When you are finished measuring samples, tap End Experiment. 9. Lift the arm and clean both pedestals with a new wipe, or remove the sample cuvette. Thermo Scientific NanoDrop One User Guide...
- Page 32 • Best Practices for Nucleic Acid Measurements • Measure a Micro-Volume Sample • Measure a Sample Using a Cuvette • Best Practices for Micro-Volume Measurements • Best Practices for Cuvette Measurements • Prepare Samples and Blanks • Basic Instrument Operations NanoDrop One User Guide Thermo Scientific...
-
Page 33: Microarray Reported Results
• A baseline correction is performed at 750 nm (absorbance value at 750 nm is subtracted from absorbance values at all wavelengths in sample spectrum). • Micro-volume absorbance measurements and measurements taken with nonstandard cuvettes are normalized to a 10.0 mm pathlength equivalent. Thermo Scientific NanoDrop One User Guide... -
Page 34: Settings For Microarray Measurements
The Microarray Setup screen appears after you select the Microarray application from the Nucleic Acids tab on the Home screen. To show the Microarry settings from the Microarray measurement screen, tap > Microarray Setup. NanoDrop One User Guide Thermo Scientific... - Page 35 340 nm, select a different correction wavelength or turn off Analysis Correction. To add a custom dye or edit the list of available dyes, use the Dye/Chromophore Editor. The Analysis Correction affects the calculation for nucleic acid concentration only. Thermo Scientific NanoDrop One User Guide...
- Page 36 Selected dyes (will appear in Dye1 and Dye2 lists in Microarray Setup Custom dye (user-defined; Tap to close or Proteins & Labels Setup) can be edited or deleted) Dye/Chrom. Editor These operations are available from the Dye/Chromophore Editor: NanoDrop One User Guide Thermo Scientific...
- Page 37 Edit custom dye Tip Dyes pre-defined in the software cannot be edited. – tap to select custom dye – Thermo Scientific NanoDrop One User Guide...
-
Page 38: Calculations For Microarray Measurements
Tip: Ideally, the factor or extinction coefficient should be Note: See Sample Type for more information. determined empirically using a solution of the study nucleic acid at a known concentration using the same buffer. NanoDrop One User Guide Thermo Scientific... - Page 39 • A260 dye corrections are subtracted from the A260 absorbance value used to calculate nucleic acid concentration, and from the A260 absorbance value used to calculate the A260/A280 purity ratio. Thermo Scientific NanoDrop One User Guide...
- Page 40 Note: Although purity ratios are important indicators of sample quality, the best indicator of DNA or RNA quality is functionality in the downstream application of interest (e.g., microarray). Related Topics • Calculations for Nucleic Acid Measurements NanoDrop One User Guide Thermo Scientific...
-
Page 41: Measure Using A Custom Factor
• Do not use a squirt or spray bottle on or near the instrument as liquids will flow into the instrument and may cause permanent damage. • Do not use hydrofluoric acid (HF) on the pedestals. Fluoride ions will permanently damage the quartz fiber optic cables. Thermo Scientific NanoDrop One User Guide... - Page 42 Measure using a Custom Factor Before you begin... Before taking pedestal measurements with the NanoDrop One instrument, lift the instrument arm and clean the upper and lower pedestals. At a minimum, wipe the pedestals with a new laboratory wipe. For more information, see Cleaning the Pedestals.
-
Page 43: Custom Factor Reported Results
Here is an example: Note The Custom Factor measurement screen is identical to the measurement screen for the other nucleic acid applications except the Custom Factor is reported in the lower left corner (see image below). Thermo Scientific NanoDrop One User Guide... - Page 44 Measure using a Custom Factor Custom factor used to calculate nucleic acid concentration Related Topics • Basic Instrument Operations • Nucleic Acid Reported Results • Nucleic Acid Calculations NanoDrop One User Guide Thermo Scientific...
-
Page 45: Settings For Nucleic Acid Measurements Using A Custom Factor
= molar extinction coefficient at 260 nm in ng-cm/μL sample pathlength in cm (1 cm for nucleic acids measured with the NanoDrop One instruments) Baseline Correction On or off Optional user-defined baseline correction. Can be used to correct for any offset caused by light scattering particulates by... - Page 46 (550 AU * 55 ng-cm/μL) = 30,250 ng/μL Note For measurements with 10 mm pathlength cuvettes, the upper absorbance limit is 1.5 AU, which is approximately 75 ng/μL for dsDNA. Related Topics • Detection Limits for All Applications NanoDrop One User Guide Thermo Scientific...
-
Page 47: Measure Oligo Dna Or Oligo Rna
260 nm. If it does, we recommend using the Microarray application to quantify nucleic acid concentration. The Microarray application includes a correction to remove any absorbance contribution due to the dye from the oligo quantification result. Thermo Scientific NanoDrop One User Guide... - Page 48 Before you begin... Before taking pedestal measurements with the NanoDrop One instrument, lift the instrument arm and clean the upper and lower pedestals. At a minimum, wipe the pedestals with a new laboratory wipe. For more information, see Cleaning the Pedestals.
- Page 49 8. When you are finished measuring samples, tap End Experiment. 9. Lift the arm and clean both pedestals with a new wipe, or remove the sample cuvette. Related Topics • Best Practices for Nucleic Acid Measurements Thermo Scientific NanoDrop One User Guide...
- Page 50 Measure Oligo DNA or Oligo RNA • Measure a Micro-Volume Sample • Measure a Sample Using a Cuvette • Best Practices for Micro-Volume Measurements • Best Practices for Cuvette Measurements • Prepare Samples and Blanks • Basic Instrument Operations NanoDrop One User Guide Thermo Scientific...
-
Page 51: Oligo Reported Results
Measured oligo: TTT TTT TTT TTT TTT TTT TTT TTT Note Micro-volume absorbance measurements and measurements taken with nonstandard cuvettes are normalized to a 10.0 mm pathlength equivalent. Thermo Scientific NanoDrop One User Guide... - Page 52 • baseline correction • stirrer status Note The five nucleotides that comprise DNA and RNA exhibit widely varying A260/A280 ratios. See Oligo Purity Ratios for more information. Related Topics • Basic Instrument Operations • Oligo Calculations NanoDrop One User Guide Thermo Scientific...
-
Page 53: Settings For Oligo Dna And Oligo Rna Measurements
f = 1/( * b) where: f= factor = molar extinction coefficient at 260 nm in ng-cm/μL sample pathlength in cm (0.1 cm for nucleic acids measured with the NanoDrop One instrument) Thermo Scientific NanoDrop One User Guide... -
Page 54: Detection Limits For Oligo Dna And Oligo Rna Measurements
For example, for a sample measurement using an extinction coefficient of 55, the equation looks like this: (550 AU * 55 ng-cm/μL) = 30,250 ng/μL Note For measurements with 10 mm pathlength cuvettes, the upper absorbance limit is 1.5 AU, which is approximately 75 ng/μL for dsDNA. NanoDrop One User Guide Thermo Scientific... -
Page 55: Calculations For Oligo Dna And Oligo Rna Measurements
For any entered base sequence, the software uses the equation at the right to calculate the extinction coefficient. Tip: The extinction coefficient is wavelength specific for each oligonucleotide and can be affected by buffer type, ionic strength and pH. Thermo Scientific NanoDrop One User Guide... - Page 56 • For cuvette measurements, pathlength is determined by the cuvette Pathlength setting in the software (see General Settings). • Displayed spectra and absorbance values are normalized to a 10 mm pathlength equivalent. • NanoDrop One User Guide Thermo Scientific...
- Page 57 Note: RNA will typically have a higher 260/280 ratio due spectra are highly dependent on their base compositions. See side bar for to the higher ratio of Uracil compared to that of Thymine. more information. Related Topics • Calculations for Nucleic Acid Measurements Thermo Scientific NanoDrop One User Guide...
-
Page 59: Measure Protein A280
• Do not use a squirt or spray bottle on or near the instrument as liquids will flow into the instrument and may cause permanent damage. • Do not use hydrofluoric acid (HF) on the pedestals. Fluoride ions will permanently damage the quartz fiber optic cables. Thermo Scientific NanoDrop One User Guide... - Page 60 Measure Protein A280 Before you begin... Before taking pedestal measurements with the NanoDrop One instrument, lift the instrument arm and clean the upper and lower pedestals. At a minimum, wipe the pedestals with a new laboratory wipe. For more information, see Cleaning the Pedestals.
- Page 61 (see the next section). Low concentration BSA sample 8. When you are finished measuring samples, tap End Experiment. 9. Lift the arm and clean both pedestals with a new wipe, or remove the sample cuvette. Thermo Scientific NanoDrop One User Guide...
- Page 62 – Use a 2 μL sample volume. See Recommended Sample Volumes for more information. • For cuvette measurements (NanoDrop One instruments only), use compatible cuvettes and follow best practices for cuvette measurements. NanoDrop One User Guide Thermo Scientific...
-
Page 63: Protein A280 Reported Results
• Prepare Samples and Blanks • Basic Instrument Operations Protein A280 Reported Results Protein A280 measurement screen For each measured sample, this application shows the absorbance spectrum and a summary of the results. Here is an example: Thermo Scientific NanoDrop One User Guide... - Page 64 Protein A280 reported values The initial screen that appears after each measurement (see previous image) shows a summary of the reported values. To view all reported values, press and hold the sample row. Here is an example: NanoDrop One User Guide Thermo Scientific...
-
Page 65: Settings For Protein A280 Measurements
To show the Protein A280 settings, from the Protein A280 measurement screen, tap > Protein A280 Setup. Protein A280 settings The Protein A280 application provides a variety of sample type options for purified protein analysis. Thermo Scientific NanoDrop One User Guide... - Page 66 Calculates lysozyme protein concentration using mass extinction coefficient ( ) of 26.4 L/gm-cm at 280 nm for 1% (i.e., 10 mg/mL) lysozyme solution. Assumes molar extinction coefficient for egg white lysozyme ranges between 36,000 M and 39,000 M NanoDrop One User Guide Thermo Scientific...
- Page 67 Proteins & Labels Setup. To access the Protein Editor: • from the Home screen, tap > Protein Editor • from the Protein A280 or Proteins & Labels measurement screen, tap > Settings > Protein Editor Thermo Scientific NanoDrop One User Guide...
- Page 68 Molar Extinction coefficient or Mass Extinction coefficient for custom protein – if Mass Extinction coefficient is selected 1%) protein – enter mass extinction coefficient in L/gm-cm for 10 mg/mL ( solution NanoDrop One User Guide Thermo Scientific...
- Page 69 Setup and Proteins & Labels Setup. Edit custom protein – in Protein Editor, tap to select custom protein – to show Edit Protein Type box – edit any entries or settings – tap OK Thermo Scientific NanoDrop One User Guide...
-
Page 70: Detection Limits For Protein A280 Measurements
For example, if the sample’s mass extinction coefficient at 280 nm is 6.67 for a 1% (10 mg/mL) solution, the equation looks like this: (550 / 6.67) * 10 = 824.6 (or ~825) Related Topics • Detection Limits for All Applications NanoDrop One User Guide Thermo Scientific... -
Page 71: Calculations For Protein A280 Measurements
= (nW * 5500) + (nY * 1490) + (nC * 125) where: = molar extinction coefficient = number of each amino acid residue 5500, 1490 and 125 = amino acid molar absorptivities at 280 nm Thermo Scientific NanoDrop One User Guide... - Page 72 (MW) of 66,400 daltons (Da), rearrange and solve the above equation as follows: 1% = ( * 10) / (MW molar protein 1% = (43,824 * 10) / 66,400 Da) 1% = 6.6 g/100 mL NanoDrop One User Guide Thermo Scientific...
- Page 73 = (A / 1%) * 10 protein Tip: The NanoDrop One software includes the conversion factor when reporting protein concentrations. Example: If measured absorbance for a protein sample at 280 nm relative to the reference is 5.8 A, protein concentration can be calculated as: ...
- Page 74 “pure” for proteins. Note: Although purity ratios are important indicators of sample quality, the best indicator of protein quality is functionality in the downstream application of interest (e.g., real-time PCR). NanoDrop One User Guide Thermo Scientific...
-
Page 75: Measure Proteins And Labels
• Do not use a squirt or spray bottle on or near the instrument as liquids will flow into the instrument and may cause permanent damage. • Do not use hydrofluoric acid (HF) on the pedestals. Fluoride ions will permanently damage the quartz fiber optic cables. Thermo Scientific NanoDrop One User Guide... - Page 76 Measure Proteins and Labels Before you begin... Before taking pedestal measurements with the NanoDrop One instrument, lift the instrument arm and clean the upper and lower pedestals. At a minimum, wipe the pedestals with a new laboratory wipe. For more information, see Cleaning the Pedestals.
- Page 77 (see the next section). 8. When you are finished measuring samples, tap End Experiment. 9. Lift the arm and clean both pedestals with a new wipe, or remove the sample cuvette. Thermo Scientific NanoDrop One User Guide...
-
Page 78: Proteins & Labels Reported Results
• Basic Instrument Operations Proteins & Labels Reported Results Proteins & Labels measurement screen For each measured sample, this application shows the absorbance spectrum and a summary of the results. Here is an example: NanoDrop One User Guide Thermo Scientific... - Page 79 • A baseline correction is performed at 750 nm (absorbance value at 750 nm is subtracted from absorbance values at all wavelengths in sample spectrum). • Micro-volume absorbance measurements and measurements taken with nonstandard cuvettes are normalized to a 10.0 mm pathlength equivalent. Thermo Scientific NanoDrop One User Guide...
-
Page 80: Settings For Proteins And Labels Measurements
• Basic Instrument Operations • Proteins & Labels calculations Settings for Proteins and Labels Measurements To show the Proteins & Labels settings, from the Proteins & Labels measurement screen, tap > Proteins & Labels Setup. NanoDrop One User Guide Thermo Scientific... - Page 81 To add or edit a custom protein, use Protein Editor. Analysis Correction affects calculation for protein concentration only. To add custom dye or edit list of available dyes, use Dye/Chromophore Editor. Sloping Dye Correction affects calculations for dye concentration only. Thermo Scientific NanoDrop One User Guide...
-
Page 82: Detection Limits For Proteins And Labels Measurements
For example, if the sample’s mass extinction coefficient at 280 nm is 6.67 for a 1% (10 mg/mL) solution, the equation looks like this: (550 / 6.67) * 10 = 824.6 (or ~825) Related Topics • Detection Limits for All Applications NanoDrop One User Guide Thermo Scientific... -
Page 83: Calculations For Proteins And Labels Measurements
280 nm is reported and used to calculate protein concentration. • If a Dye is used, the 750-corrected, normalized, analysis-corrected and dye-corrected absorbance value at 280 nm is reported and used to calculate protein concentration. Thermo Scientific NanoDrop One User Guide... - Page 84 Calculations are based on Beer-Lambert equation using corrected protein absorbance value. • Dye1/Dye2 concentration. Reported in pmol/μL. Calculations are based on Beer’s Law equation using (sloping) baseline-corrected dye absorbance value(s). Related Topics • Beer-Lambert Equation • Protein A280 Calculations NanoDrop One User Guide Thermo Scientific...
-
Page 85: Measure Protein A205
• Do not use a squirt or spray bottle on or near the instrument as liquids will flow into the instrument and may cause permanent damage. • Do not use hydrofluoric acid (HF) on the pedestals. Fluoride ions will permanently damage the quartz fiber optic cables. Thermo Scientific NanoDrop One User Guide... - Page 86 Measure Protein A205 Before you begin... Before taking pedestal measurements with the NanoDrop One instrument, lift the instrument arm and clean the upper and lower pedestals. At a minimum, wipe the pedestals with a new laboratory wipe. For more information, see Cleaning the Pedestals.
- Page 87 Measure Protein A205 • Prepare Samples and Blanks • Basic Instrument Operations Thermo Scientific NanoDrop One User Guide...
-
Page 88: Protein A205 Reported Results
Note Micro-volume absorbance measurements and measurements taken with nonstandard cuvettes are normalized to a 10.0 mm pathlength equivalent. NanoDrop One User Guide Thermo Scientific... -
Page 89: Settings For Protein A205 Measurements
Related Topics • Basic Instrument Operations • Protein A205 Calculations Settings for Protein A205 Measurements To show the Protein A205 settings, from the Protein A205 measurement screen, tap > Protein A205 Setup. Thermo Scientific NanoDrop One User Guide... - Page 90 As a result, absorbance of sample spectrum is zero at specified baseline correction wavelength. Tip: If the sample has a modification that absorbs light at 340 nm, select a different correction wavelength or turn off Baseline Correction. Related Topics • Instrument Settings NanoDrop One User Guide Thermo Scientific...
-
Page 91: Calculations For Protein A205 Measurements
205 nm is reported and used to calculate protein concentration. A280 absorbance • Normalized and baseline-corrected (if selected) absorbance value at 280 nm is also reported. Thermo Scientific NanoDrop One User Guide... - Page 92 Reported Values • Protein concentration. Reported in selected unit (mg/mL or μg/mL). Calculations are based on Beer-Lambert equation using corrected protein absorbance value. Related Topics • Beer-Lambert Equation • Protein A280 Calculations NanoDrop One User Guide Thermo Scientific...
-
Page 93: Measure Protein Bca
). The resulting Cu-BCA chelate formed in the presence of protein is measured at 562 nm and baseline-corrected using the absorbance value at 750 nm. Pre-formulated kits of BCA reagent and CuSO are available from us or a local distributor. Thermo Scientific NanoDrop One User Guide... - Page 94 Protein assay kits and protocols Please refer to the NanoDrop website for up-to-date kits and protocols for the NanoDrop One instruments. Follow the assay kit manufacturer’s recommendations for all standards and samples (unknowns). Ensure each is subjected to the same timing and temperature throughout the assay.
- Page 95 As you measure the standards, a measurement screen appears, similar to the measurement screens for samples. Menu; tap Standard concentrations Reference concentration to open and absorbance value and absorbance values Press and hold any row to view details Swipe left one screen to view standard curve Thermo Scientific NanoDrop One User Guide...
- Page 96 The R value indicates how well the standard curve fits the standard data points (1.0 is a perfect fit; all points lie exactly on the curve). NanoDrop One User Guide Thermo Scientific...
- Page 97 Press and hold any row to view details Press and hold a row in any of the previous screens to view details about an individual standard. Here is an example: Tap to delete this measurement Thermo Scientific NanoDrop One User Guide...
- Page 98 The standard no longer appears in the table on the measurement screen and its concentration value no longer appears on the setup screen. Note You can use this method to delete the reference measurement; however, a new reference must be measured immediately afterwards. NanoDrop One User Guide Thermo Scientific...
- Page 99 Before you begin... Before taking pedestal measurements with the NanoDrop One instrument, lift the instrument arm and clean the upper and lower pedestals. At a minimum, wipe the pedestals with a new laboratory wipe. For more information, see Cleaning the Pedestals.
- Page 100 8. Lift the arm and clean both pedestals with a new wipe, or remove the sample cuvette. Related Topics • Best practices for protein measurements • Measure a Micro-Volume Sample • Measure a Sample Using a Cuvette NanoDrop One User Guide Thermo Scientific...
- Page 101 Measure Protein BCA • Prepare Samples and Blanks • Basic Instrument Operations Thermo Scientific NanoDrop One User Guide...
-
Page 102: Protein Bca Reported Results
Visible spectrum view measurement details. Drag tab down/up to see more/less sample data Pinch and zoom to adjust axes; Swipe screen left to double-tap to reset view standard curve NanoDrop One User Guide Thermo Scientific... - Page 103 A horizontal line connects the sample absorbance value on the Y-axis to the standard curve. A vertical line connects that point to the sample concentration value on the X-axis. Thermo Scientific NanoDrop One User Guide...
- Page 104 Page control; swipe screen left or Pinch and zoom to adjust axes; sample data right to view next or previous screen double-tap to reset NanoDrop One User Guide Thermo Scientific...
- Page 105 Here is an example: Sampling Sample name; method tap to edit Date/time measured Protein conc. Absorbance at 562 nm Baseline correction Baseline correction wavelength absorbance Related Topics • Basic Instrument Operations • Protein A280 Calculations Thermo Scientific NanoDrop One User Guide...
-
Page 106: Settings For Protein Bca Measurements
Standards Enter actual concentration value of each standard. Note: Concentration values can be entered in any order but the standards must be measured in the order they were entered. Related Topics • Instrument Settings NanoDrop One User Guide Thermo Scientific... -
Page 107: Measure Protein Bradford
The bound protein-dye complex is measured at 595 nm and baseline-corrected using the absorbance value at 750 nm. Pre-formulated kits of stabilized reagent mixture containing Coomassie Blue dye, alcohol, and surfactant are available from us or a local distributor. Thermo Scientific NanoDrop One User Guide... - Page 108 Protein assay kits and protocols Please refer to the NanoDrop website for up-to-date kits and protocols for the NanoDrop One instruments. Follow the assay kit manufacturer’s recommendations for all standards and samples (unknowns). Ensure each is subjected to the same timing and temperature throughout the assay.
- Page 109 Measure Protein Bradford Before you begin... Before taking pedestal measurements with the NanoDrop One instrument, lift the instrument arm and clean the upper and lower pedestals. At a minimum, wipe the pedestals with a new laboratory wipe. For more information, see Cleaning the Pedestals.
- Page 110 8. Lift the arm and clean both pedestals with a new wipe, or remove the sample cuvette. Related Topics • Working with standard curves • Best practices for protein measurements • Measure a Micro-Volume Sample NanoDrop One User Guide Thermo Scientific...
- Page 111 Measure Protein Bradford • Measure a Sample Using a Cuvette • Prepare Samples and Blanks • Basic Instrument Operations Thermo Scientific NanoDrop One User Guide...
-
Page 112: Protein Bradford Reported Results
Press and hold sample row to view measurement details. Drag tab down/up to see Swipe screen left to Pinch and zoom to adjust axes; more/less view standard curve double-tap to reset sample data NanoDrop One User Guide Thermo Scientific... - Page 113 A vertical line connects that point to the sample concentration value on the X-axis. The R value indicates how well the standard curve fits the standard data points (1.0 is a perfect fit; that is, all points lie exactly on the curve). Thermo Scientific NanoDrop One User Guide...
- Page 114 The initial screen that appears after each measurement and the standards screen (see previous image) show a summary of the reported values. To view all reported values, press and hold the sample row. Here is an example: NanoDrop One User Guide Thermo Scientific...
-
Page 115: Settings For Protein Bradford Measurements
Note You can edit the Curve Type setting when measuring standards by changing the list box at the top of the application measurement screen. You can edit the concentration value for a standard from the application setup screen. After the first sample measurement, these settings cannot be changed. Thermo Scientific NanoDrop One User Guide... - Page 116 Standards Enter actual concentration value of each standard. Note: Concentration values can be entered in any order but the standards must be measured in the order they were entered. Related Topics • Instrument Settings NanoDrop One User Guide Thermo Scientific...
-
Page 117: Measure Protein Lowry
The water-soluble blue reaction product is measured at 650 nm and baseline-corrected using the absorbance value at 405 nm. Pre-formulated kits of Folin-Ciocalteu reagent and CuSO are available from us or a local distributor. Thermo Scientific NanoDrop One User Guide... - Page 118 Before you begin... Before taking pedestal measurements with the NanoDrop One instrument, lift the instrument arm and clean the upper and lower pedestals. At a minimum, wipe the pedestals with a new laboratory wipe. For more information, see Cleaning the Pedestals.
- Page 119 8. Lift the arm and clean both pedestals with a new wipe, or remove the sample cuvette. Related Topics • Working with standard curves • Best practices for protein measurements • Measure a Micro-Volume Sample Thermo Scientific NanoDrop One User Guide...
-
Page 120: Protein Lowry Reported Results
Press and hold sample row to view measurement details. Pinch and zoom to adjust axes; Swipe screen left to Drag tab down/up to double-tap to reset view standard curve see more/less sample data NanoDrop One User Guide Thermo Scientific... - Page 121 A vertical line connects that point to the sample concentration value on the X-axis. The R value indicates how well the standard curve fits the standard data points (1.0 is a perfect fit; that is, all points lie exactly on the curve). Thermo Scientific NanoDrop One User Guide...
- Page 122 Page control; swipe screen left or Pinch and zoom to adjust axes; right to view next or previous screen sample data double-tap to reset NanoDrop One User Guide Thermo Scientific...
- Page 123 Here is an example: Sampling Sample name; method tap to edit Date/time measured Protein conc. Absorbance at 650 nm Baseline correction Baseline correction wavelength absorbance Related Topics • Example standard curve • Basic Instrument Operations Thermo Scientific NanoDrop One User Guide...
-
Page 124: Settings For Protein Lowry Measurements
Standards Enter actual concentration value of each standard. Note: Concentration values can be entered in any order but the standards must be measured in the order they were entered. Related Topics • Instrument Settings NanoDrop One User Guide Thermo Scientific... -
Page 125: Measure Protein Pierce 660
The reaction product is measured at 660 nm and baseline-corrected using the absorbance value at 750 nm. Thermo Scientific NanoDrop One User Guide... - Page 126 Before you begin... Before taking pedestal measurements with the NanoDrop One instrument, lift the instrument arm and clean the upper and lower pedestals. At a minimum, wipe the pedestals with a new laboratory wipe. For more information, see Cleaning the Pedestals.
- Page 127 Pipette 2 μL reference solution onto lower pedestal and lower arm, or insert reference solution blanking cuvette into cuvette holder (reference solution should contain none of the standard protein stock; see Working With Standard Curves details) Thermo Scientific NanoDrop One User Guide...
- Page 128 8. Lift the arm and clean both pedestals with a new wipe, or remove the sample cuvette. Related Topics • Working with standard curves • Best practices for protein measurements • Measure a Micro-Volume Sample NanoDrop One User Guide Thermo Scientific...
- Page 129 Measure Protein Pierce 660 • Measure a Sample Using a Cuvette • Prepare Samples and Blanks • Basic Instrument Operations Thermo Scientific NanoDrop One User Guide...
-
Page 130: Protein Pierce 660 Reported Results
• A baseline correction is performed at 750 nm (absorbance value at 750 nm is subtracted from absorbance values at all wavelengths in sample spectrum). • Micro-volume absorbance measurements and measurements taken with nonstandard cuvettes are normalized to a 10.0 mm pathlength equivalent. NanoDrop One User Guide Thermo Scientific... - Page 131 Page control; swipe screen left or Pinch and zoom to adjust axes; sample data right to view next or previous screen double-tap to reset Thermo Scientific NanoDrop One User Guide...
- Page 132 Here is an example: Sampling Sample name; method tap to edit Date/time measured Protein conc. Absorbance at 660 nm Baseline correction Baseline correction wavelength absorbance Related Topics • Example standard curve • Basic Instrument Operations NanoDrop One User Guide Thermo Scientific...
-
Page 133: Settings For Protein Pierce 660 Measurements
If you also want to enter previously measured absorbance values for the standards, select this check box: and then enter absorbance values for all the standards. Related Topics Thermo Scientific NanoDrop One User Guide... - Page 134 Measure Protein Pierce 660 • Instrument Settings NanoDrop One User Guide Thermo Scientific...
-
Page 135: Measure Od600
The OD600 application measures light transmission and uses that value to calculate absorbance. In spectroscopy, transmitted light is defined as any light that is not absorbed by, reflected from and scattered off a sample. Thermo Scientific NanoDrop One User Guide... - Page 136 OD600 Measurements for details. • For cuvette reading with the NanoDrop One instrument, accurate absorbance readings are typically in the range between 0.04 A and 1.5 A. Serial dilutions of the sample are usually needed to bring the absorbance readings within this range.
- Page 137 Before you begin... Before taking pedestal measurements with the NanoDrop One instrument, lift the instrument arm and clean the upper and lower pedestals. At a minimum, wipe the pedestals with a new laboratory wipe. For more information, see Cleaning the Pedestals.
- Page 138 9. Lift the arm and clean both pedestals with a new wipe, or remove the sample cuvette. Related Topics • Measure a Micro-Volume Sample • Measure a Sample Using a Cuvette • Prepare Samples and Blanks • Basic Instrument Operations NanoDrop One User Guide Thermo Scientific...
-
Page 139: Od600 Reported Results
Swipe screen left to view table more/less double-tap to reset with more measurement results sample data Note Micro-volume absorbance measurements and measurements taken with nonstandard cuvettes are normalized to a 10.0 mm pathlength equivalent. Thermo Scientific NanoDrop One User Guide... -
Page 140: Settings For Od600 Measurements
Cell culture concentration Factor wavelength (A600 * Factor) Related Topics • Basic Instrument Operations • OD600 Calculations Settings for OD600 Measurements To show the OD600 settings, from the OD600 measurement screen, tap > OD600 Setup. NanoDrop One User Guide Thermo Scientific... - Page 141 Absorbance correction value is subtracted from absorbance values at all wavelengths in sample spectrum. (All displayed absorbance values are corrected values.) Thermo Scientific NanoDrop One User Guide...
- Page 142 ) = molar absorption coefficient (or extinction coefficient) at specified wavelength b = pathlength in cm (1.0 cm for the NanoDrop One instruments) Cell number Any number User-defined factor. Generally accepted factor for measured cell conversion factor (10 type, or one derived empirically using a solution of study cells at known concentration using the same media.
-
Page 143: Calculations For Od600 Measurements
Settings). • Displayed spectra and absorbance values are normalized to a 10 mm pathlength equivalent. • Reported Values Cell concentration. Reported in cells/mL. Calculations are based on Beer-Lambert equation using corrected A600 absorbance value. Thermo Scientific NanoDrop One User Guide... -
Page 145: Measure Custom
Measure Custom Method Delete Custom Method Reported Results Measure using a Custom Method Use the Custom application to run a user-defined method created using the NanoDrop One Viewer software running on a personal computer. For more information, see Create Custom Method. - Page 146 4. Use the list box at the top of the screen to indicate the USB port used. 5. Tap Load Method. A message box shows the NanoDrop One methods available on the selected USB device. 6. Tap one or more method names in the Load Method box to select the methods to load.
- Page 147 Before you begin... Before taking pedestal measurements with the NanoDrop One instrument, lift the instrument arm and clean the upper and lower pedestals. At a minimum, wipe the pedestals with a new laboratory wipe. For more information, see Cleaning the Pedestals.
- Page 148 3. In the Select Method box, tap to select the method to run. Information about the selected method appears in the Method Details box. 4. Tap Run Method. 5. Follow the on-screen instructions to measure a sample. NanoDrop One User Guide Thermo Scientific...
-
Page 149: Delete Custom Method
• Set Up the Instrument • Export Custom Method Delete Custom Method – From Home screen, select Custom tab and tap Custom. – In Select Method box, tap to select method to delete – Thermo Scientific NanoDrop One User Guide... -
Page 150: Custom Method Reported Results
Pinch and zoom to Swipe screen left to adjust axes; view table with more double-tap to reset measurement results Note Micro-volume absorbance measurements and measurements taken with nonstandard cuvettes are normalized to a 10.0 mm pathlength equivalent. NanoDrop One User Guide Thermo Scientific... - Page 151 To view all reported values, press and hold the sample row. Here is an example: Method Sampling Sample name; name method tap to edit Date/time measured Analyte concentration Method details Related Topics • Basic Instrument Operations Thermo Scientific NanoDrop One User Guide...
-
Page 153: Measure Uv-Vis
• Do not use a squirt or spray bottle on or near the instrument as liquids will flow into the instrument and may cause permanent damage. • Do not use hydrofluoric acid (HF) on the pedestals. Fluoride ions will permanently damage the quartz fiber optic cables. Thermo Scientific NanoDrop One User Guide... - Page 154 Measure UV-Vis Before you begin... Before taking pedestal measurements with the NanoDrop One instrument, lift the instrument arm and clean the upper and lower pedestals. At a minimum, wipe the pedestals with a new laboratory wipe. For more information, see Cleaning the Pedestals.
- Page 155 – Use a 1-2 μL sample volume. See Recommended Sample Volumes for more information. • For cuvette measurements (NanoDrop One instruments only), use compatible cuvettes and follow best practices for cuvette measurements. Related Topics • Measure a Micro-Volume Sample •...
-
Page 156: Uv-Vis Reported Results
Note Micro-volume absorbance measurements and measurements taken with nonstandard cuvettes are normalized to a 10.0 mm pathlength equivalent. NanoDrop One User Guide Thermo Scientific... - Page 157 Absorbance at 450 nm User-defined Baseline correction Absorbance Absorbance at wavelengths wavelength at 635 nm 623 nm Note Scroll up to display absorbance values for any additional user-defined wavelengths. Related Topics • Basic Instrument Operations Thermo Scientific NanoDrop One User Guide...
-
Page 158: Settings For Uv-Vis Measurements
(750 nm) spectrum. As a result, absorbance of sample spectrum is zero at specified baseline correction wavelength. Related Topics • Instrument Settings NanoDrop One User Guide Thermo Scientific... - Page 159 Measure UV-Vis Thermo Scientific NanoDrop One User Guide...
- Page 160 Measure UV-Vis NanoDrop One User Guide Thermo Scientific...
-
Page 161: Measure Kinetics
• To prevent damage from spills, keep containers of liquids away from the instrument. • Do not use a squirt or spray bottle on or near the instrument as liquids will flow into the instrument and may cause permanent damage. Thermo Scientific NanoDrop One User Guide... - Page 162 Fill clean, dry cuvette with enough blanking solution to cover instrument optical path – Lift instrument arm and insert blanking cuvette into cuvette holder, making sure to align light path of cuvette with light path of instrument – Tap Blank NanoDrop One User Guide Thermo Scientific...
- Page 163 7. When you are finished reviewing the data, tap End Experiment. Each saved experiment contains one complete set of kinetic measurements based on the selected method. Related Topics • Measure a Sample Using a Cuvette Thermo Scientific NanoDrop One User Guide...
-
Page 164: Create Kinetics Method
Kinetics methods can be created and run only on the NanoDrop One instrument. However, once the method is created, it can be saved in the NanoDrop One database on the local instrument, or in the NanoDrop Viewer database on a connected PC. To create a new kinetics method: –... -
Page 165: Edit Kinetics Method
Related Topics • Edit Kinetics Method Edit Kinetics Method Kinetics methods can be edited only on the NanoDrop One instrument. To edit an existing kinetics method: – if the instrument has a connected PC (Ethernet or Wi-Fi), make sure Data Storage is... - Page 166 Select Method box – tap Edit Method – edit method settings as desired – tap Save Method to save your changes – tap Run Method to run the updated method Related Topics • Create Kinetic Method NanoDrop One User Guide Thermo Scientific...
-
Page 167: Kinetics Reported Results
Tap to end experiment axes; double-tap to reset Rate measurement screen and export data Note For measurements taken with nonstandard (other than 10 mm) cuvettes, the spectra are normalized to a 10 mm pathlength equivalent. Thermo Scientific NanoDrop One User Guide... - Page 168 (see example below) Swipe screen left to view data table; swipe Tap to end experiment right to return to absorbance measurement screen and export data NanoDrop One User Guide Thermo Scientific...
- Page 169 Tap to update plot to show measured absorbance over time (see example above) Swipe screen left to view data table; swipe Tap to end experiment right to return to absorbance measurement screen and export data Thermo Scientific NanoDrop One User Guide...
- Page 170 Absorbance values for each number (click to specify unit) Stage user-defined wavelength Press and hold row to view measurement details Swipe screen right to return Tap to end experiment to Rate measurement screen and export data NanoDrop One User Guide Thermo Scientific...
- Page 171 260 nm Absorbance at 340 nm Absorbance at 660 nm Print this Return to Delete this screen previous screen measurement User-defined Method details (scroll wavelengths up to view more) Related Topics • Basic Instrument Operations Thermo Scientific NanoDrop One User Guide...
-
Page 172: Settings For Kinetic Measurements
Note If the instrument has a connected PC (Ethernet or Wi-Fi), kinetics methods can be located in the NanoDrop One database on the local instrument, or in the NanoDrop Viewer database on a connected PC. Use the Data Storage box to select which database is active and then follow the steps to display the Kinetics methods that are stored in that location and their associated settings. - Page 173 If the unit is seconds in the example above, a total of 11 measurements are taken at the following times over a period of 32 seconds: Thermo Scientific NanoDrop One User Guide...
- Page 174 Note: Kinetic experiments are limited to 1000 measurements. This means the total number of measurements from all intervals in all stages must be less than 1000. Consider available instrument or computer disc space for lengthy experiments. Related Topics • Instrument Settings NanoDrop One User Guide Thermo Scientific...
-
Page 175: Chapter 3 Learning Center
Learning Center How the Set Up the Measure a Measure using Prepare Instrument Instrument Micro-Volume a Cuvette Samples and Works Sample Blanks Basic Acclaro Instrument NanoDrop One Multimedia Instrument Sample Settings Viewer Operations Intelligence Thermo Scientific NanoDrop One User Guide... -
Page 176: Micro-Volume Sampling-How It Works
Sample Concentration Baseline Correction Surface Tension The NanoDrop One spectrophotometer uses surface tension to hold a small volume of sample between two pedestals. The patented sample retention system enables the measurement of highly concentrated samples without the need for dilutions. - Page 177 “anchoring” the spectrum to zero absorbance units at the reference wavelength. Related Topics • Instrument Models and Features • Measure a Micro-Volume Sample Thermo Scientific NanoDrop One User Guide...
-
Page 178: Set Up The Instrument
To connect a compatible printer or other compatible accessory such as a USB keyboard and/or mouse to the instrument, use any USB port on the instrument (front, back-left or back-right). See Accessories for information about accessories compatible with the NanoDrop One instruments. NanoDrop One User Guide Thermo Scientific... - Page 179 Bluetooth devices were found” is displayed – to add a Bluetooth device, follow manufacturer instructions to pair the device (for example, you may need to hold down a button) and tap Search For Devices on instrument) Thermo Scientific NanoDrop One User Guide...
- Page 180 Note If your Bluetooth device does not pair, restart the device and then repeat the steps above to pair it with the instrument (you may also try turning Bluetooth off and back on). After a device is paired, it remains paired even after the instrument is restarted. NanoDrop One User Guide Thermo Scientific...
- Page 181 – from instrument Home screen, tap – tap System tab – tap Bluetooth – to deselect a paired Bluetooth device such as a keyboard for input, tap its Profiles button Thermo Scientific NanoDrop One User Guide...
- Page 182 • To select the device again, follow the steps above and select the device’s Use for Input checkbox. Disconnect Bluetooth device – from instrument Home screen, tap – tap System tab – tap Bluetooth – to disconnect paired Bluetooth device, tap its Profiles button NanoDrop One User Guide Thermo Scientific...
- Page 183 The instrument Ethernet port can be used to set up a wired connection between the instrument and a personal computer (or PC). The connected computer can then be used to store or view data acquired with the NanoDrop One instrument. (NanoDrop One Viewer software must be installed on the computer.)
- Page 184 W-Fi, NanoDrop One Viewer software must be installed on the remote computer and the computer must be configured for Wi-Fi data storage. The instrument must also be connected to the remote computer’s network host and have Wi-Fi enabled.
- Page 185 For more information, see the system administrator at your work site. – record IP address (you will need to enter it on the remote computer in the next section) – tap Done to exit Settings Thermo Scientific NanoDrop One User Guide...
- Page 186 Learning Center Set Up the Instrument Configure Wi-Fi data storage on the remote computer – from remote computer, open NanoDrop One Viewer software – choose File (menu) > Set Up Wi-Fi Data Storage (the following screen is displayed) – enter the following information: –...
- Page 187 – to remove an item from the list, tap to select the row and then tap Delete – when finished, choose OK to close Wi-Fi Data Storage setup Thermo Scientific NanoDrop One User Guide...
- Page 188 • to store all subsequently acquired measurement results only in the NanoDrop One database on the instrument, set Data Storage to Local (see example above). • to store all subsequently acquired measurement results in the NanoDrop One...
-
Page 189: Data Storage
Data storage location (wireless computer) Computer’s IP address all subsequently acquired measurement results are saved in the NanoDrop Viewer database on the selected computer, and in the NanoDrop One database on the local instrument. Thermo Scientific NanoDrop One User Guide... - Page 190 Learning Center Set Up the Instrument Note • The NanoDrop One Viewer software does not need to be running for data from the instrument to be saved there. • If the wireless or Ethernet connection is interrupted during a measurement, data storage switches back to the local instrument with no loss of data.
- Page 191 Note If operating the instrument at the low end of the recommended humidity range, use adequate sample volume to avoid evaporation. After the instrument is installed, you can leave it turned on. Related Topics • Safety and Operating Precautions • Instrument Models and Features Thermo Scientific NanoDrop One User Guide...
- Page 192 Learning Center Set Up the Instrument • Optional Accessories • Instrument Settings NanoDrop One User Guide Thermo Scientific...
-
Page 193: Measure A Micro-Volume Sample
Learning Center Measure a Micro-Volume Sample Measure a Micro-Volume Sample The NanoDrop One spectrophotometer uses surface tension to hold a small volume of sample between two pedestals. The patented sample retention system enables the measurement of highly concentrated samples without the need for dilutions. - Page 194 • After each measurement, clean both pedestals with new wipe to prevent carryover. • After each set of measurements, clean pedestals with DI H2O (see Clean pedestals between users) • Recondition pedestals periodically to maintain their hydrophobic property. NanoDrop One User Guide Thermo Scientific...
- Page 195 2 μL Other protein applications such as Bradford or BCA 2 μL Microbial cell suspensions 2 μL Use 2 μL for samples that contain materials that may reduce surface tension such as a surfactant. Thermo Scientific NanoDrop One User Guide...
- Page 196 If the Connectivity Status icon is blue, tap the icon and set Data Storage to Local as shown at the left. 2. From the instrument Home screen, select an application tab such as Nucleic Acids and tap an application name such as dsDNA or RNA. NanoDrop One User Guide Thermo Scientific...
- Page 197 Start the sample measurement: – Auto-Measure is On, lower arm – if Auto-Measure is off, lower arm and tap Measure – When the sample measurement is completed, the spectra and reported values are displayed. Thermo Scientific NanoDrop One User Guide...
- Page 198 The new spectrum replaces the previous one on the spectral display and the new reported values appear under the previous ones in the table. (Drag tab down to show both sets of data.) Tap to end experiment NanoDrop One User Guide Thermo Scientific...
- Page 199 • Absorbance Detection Limits • Prepare Samples and Blanks • Auto-Measure and Auto-Blank • Acclaro Sample Intelligence • Cleaning the Pedestals • Search Experiment Database • Export Data • Measure a Sample Using a Cuvette Thermo Scientific NanoDrop One User Guide...
-
Page 200: Measure A Sample Using A Cuvette
• sample material resuspended in appropriate buffer solution (see Preparing Samples) • pure buffer solution for blanking instrument (see Choosing and Measuring a Blank or watch multimedia training What is a blank?) NanoDrop One User Guide Thermo Scientific... - Page 201 • To prevent damage from spills, keep containers of liquids away from the instrument. • Do not use a squirt or spray bottle on or near the instrument as liquids will flow into the instrument and may cause permanent damage. Thermo Scientific NanoDrop One User Guide...
- Page 202 Lift instrument arm and insert blanking cuvette into cuvette holder, making sure to align light path of cuvette with light path of instrument. – Tap Blank and wait for the measurement to complete. Instrument light path NanoDrop One User Guide Thermo Scientific...
- Page 203 Related Topics • Instrument Models and Features • Absorbance Detection Limits • Prepare Samples and Blanks • Acclaro Sample Intelligence • Instrument Settings • Search Experiment Database • Export Data • Measure a Micro-Volume Sample Thermo Scientific NanoDrop One User Guide...
-
Page 204: Prepare Samples And Blanks
The resulting sample spectrum represents the absorbance of only the analyte of interest. For more information, watch the multimedia training What is a blank? NanoDrop One User Guide Thermo Scientific... - Page 205 Protein sample solution used to blank values or, in some cases, resemble a mirror image of a instrument results in “mirror image” spectrum typical pure nucleic acid or protein spectrum as in example at right.) Thermo Scientific NanoDrop One User Guide...
- Page 206 Supplies needed • lint-free laboratory wipes • calibrated precision pipettor (0–2 μL) • buffer solution for evaluation To run a blanking cycle For quick demonstration, watch multimedia training Evaluating a Blanking Solution for Suitability. NanoDrop One User Guide Thermo Scientific...
- Page 207 • Do not use a squirt or spray bottle on or near the instrument as liquids will flow into the instrument and may cause permanent damage. • Do not use hydrofluoric acid (HF) on the pedestals. Fluoride ions will permanently damage the quartz fiber optic cables. Thermo Scientific NanoDrop One User Guide...
- Page 208 5. When you are finished with the blanking cycle, tap for Protein A280 protein quantification End Experiment. 6. Lift the arm and clean both pedestals with a new wipe. Related Topics • Absorbance Detection Limits NanoDrop One User Guide Thermo Scientific...
- Page 209 • Effects of Bubbles in Samples • What is a Blank? • Evaluating a Blanking Solution for Suitability • Maintaining the Pedestals • Measure a Micro-Volume Sample • Measure a Sample Using a Cuvette Thermo Scientific NanoDrop One User Guide...
-
Page 210: Basic Instrument Operations
Learning Center Basic Instrument Operations Basic Instrument Operations Measurement Data Viewer General Operations Home Screen screens NanoDrop One User Guide Thermo Scientific... -
Page 211: Nanodrop One Home Screen
Settings Diagnostics Applications The NanoDrop One offers a broad range of applications for measuring samples with the instrument. To select an application, tap an Application tab such as Nucleic Acids and then tap an application name such as dsDNA. Tap here for detailed information about each available application. - Page 212 System Status on the instrument Home screen to open the system status box. Here is an example: The available information is described below. Instrument type Instrument model (NanoDrop One or NanoDrop One Serial number Instrument serial number Instrument status Current status of the instrument...
- Page 213 Data Viewer on the instrument. Note The instrument will only allow you to view data in its local NanoDrop One database. When the instrument is connected to a computer with an Ethernet cable or through a wireless network, the Data Viewer icon on the instrument Home screen is unavailable.
- Page 214 Learning Center Basic Instrument Operations Training and Help on the Home screen to access this Help system. The NanoDrop One software comes with comprehensive embedded training and support. Tap here for information on how to navigate the available information. Related Topics •...
-
Page 215: Nanodrop One Measurement Screens
Menu in any measurement screen to see the available menu options. Home Return to NanoDrop One Home screen [application] Setup View or change settings for selected application Settings View or change instrument settings... - Page 216 Home screen, tap to open Data Viewer – select experiment – swipe left to show data table – press and hold sample name to show Sample Details box – tap Sample Name field to display keyboard NanoDrop One User Guide Thermo Scientific...
- Page 217 Sample Pathlength All applications display the sample pathlength along the spectrum’s vertical axis. Micro-volume absorbance measurements and measurements taken with nonstandard cuvettes are normalized to a 10.0 mm pathlength equivalent. Thermo Scientific NanoDrop One User Guide...
- Page 218 Measurement Alerts Acclaro Sample Intelligence technology built into the NanoDrop One instruments provides important features to help you assess sample integrity. Tap a Sample Intelligence icon in the software to view its associated information. For more information, tap a link below.
- Page 219 Basic Instrument Operations Auto-Measure and Auto-Blank Speed up sample analysis with the NanoDrop One Auto-Measure and Auto-Blank features, which cause the instrument to start the measurement immediately after you lower the instrument arm. These options eliminate the need for repetitive Measure or Blank operations for large batches of samples.
- Page 220 Here is an example: Note You can also edit the sample name from the Sample Details box. NanoDrop One User Guide Thermo Scientific...
- Page 221 Application Page control; swipe screen right to used return to measurement screen Related Topics • Measure Nucleic Acids • Measure Proteins • Instrument Settings • Print Data • Acclaro Sample Intelligence Thermo Scientific NanoDrop One User Guide...
-
Page 222: Nanodrop One Data Viewer
Measure a Micro-Volume Sample • Measure a Sample Using a Cuvette NanoDrop One Data Viewer The Data Viewer opens the database that stores sample data measured with the instrument. The data are saved according to acquisition date, experiment name, application used... - Page 223 Whether you collect one sample or many in a row, after you choose End Experiment, the acquired data are automatically saved in an experiment with an experiment name. In the default configuration, experiments are stored in the NanoDrop One database on the local instrument according to acquisition date, experiment name,...
- Page 224 Data Viewer to list experiments acquired on that date, or use Search feature to find experiment – insert USB memory device into available USB port on instrument (front, back-left or back-right) – tap Select NanoDrop One User Guide Thermo Scientific...
- Page 225 – tap Select – tap to select one or more experiments to delete (tap again to deselect an experiment) – tap Delete and OK NOTICE Deleted data cannot be recovered. Thermo Scientific NanoDrop One User Guide...
- Page 226 Note The data shown are dependent upon the application used to measure the samples (nucleic acids in these examples). For more information, see the application details. NanoDrop One User Guide Thermo Scientific...
- Page 227 Drag tab down/up to Pinch and zoom Page control; swipe screen left or Selected see more/less application to adjust axes right to view next or previous screen sample data Thermo Scientific NanoDrop One User Guide...
- Page 228 (2) Menu from any Spectral Data or Data Table screen to see the available menu options. Home Return to NanoDrop One Home screen Manage Identifiers Add or delete labels for selected experiment to make it easier to find (see...
-
Page 229: Nanodrop One General Operations
You can add one or more “identifiers” (i.e., labels or metadata tags) to an experiment to make the experiment easier to find. Labels can be added from the NanoDrop One software running on the instrument, or from the NanoDrop One Viewer software installed on a personal... - Page 230 Manage Identifiers box, select label and tap – tap OK Export Selected Measurements You can export measurement data from one or more experiments when you save the experiment, or afterwards from the Data Viewer. NanoDrop One User Guide Thermo Scientific...
- Page 231 The SQL file can be opened only using our NanoDrop One Viewer software, and only after the file has been imported. Data can be exported to a USB device connected to any USB port on the local instrument...
- Page 232 USB memory device into available USB port on instrument (front, back-left or back-right) – tap Select – tap to select one or more experiments to export (tap again to deselect an experiment) – tap Export NanoDrop One User Guide Thermo Scientific...
- Page 233 Data Viewer – tap row in Data Viewer to list experiments acquired on that date, or use Search feature to find desired experiment – press and hold sample row to open Sample Details box – Thermo Scientific NanoDrop One User Guide...
- Page 234 Viewer, tap to select one or more sample rows to print (tap again to deselect a sample row) – and choose Print – in the Print Information box, choose OK One label is printed for each selected measurement. NanoDrop One User Guide Thermo Scientific...
- Page 235 Print Information box, choose OK One label is printed for this measurement. Related Topics • Instrument Settings • NanoDrop One Data Viewer • Search Experiment Database • Select Experiments to Export or Delete • Open Experiment Thermo Scientific...
-
Page 236: Instrument Settings
Language Select language for displaying NanoDrop One software and for any connected input device such as a keyboard, mouse or barcode scanner Notice: Changing the language requires a software restart. -
Page 237: General Settings
Adjust brightness of instrument touchscreen Sound Volume Adjust volume of instrument touchscreen Update Software Update NanoDrop One software via USB device connected to instrument; if connected USB device contains multiple eligible update files, you can choose which files to update (see Update... - Page 238 Learning Center Instrument Settings Use cuvette Select cuvette sampling mode (available for NanoDrop One instrument model only). When selected, these additional options are available: Pathlength: Enter cuvette pathlength (width) before taking blank or sample measurements with cuvettes (see cuvette manufacturer for cuvette specifications)
- Page 239 Learning Center Instrument Settings Thermo Scientific NanoDrop One User Guide...
-
Page 240: Acclaro Sample Intelligence
Learning Center Acclaro Sample Intelligence Acclaro Sample Intelligence The Thermo Scientific™ Acclaro™ Sample Intelligence technology built into the NanoDrop One instruments provides these exclusive features to help you assess sample integrity: contaminant analysis to help qualify a sample before use in downstream applications... - Page 241 (see above), and in the data table, as well as Data Viewer (see below). The icons are active in all three places; the information remains with the data indefinitely, even after it has been exported. Thermo Scientific NanoDrop One User Guide...
- Page 242 Learning Center Acclaro Sample Intelligence Contaminant Analysis For the dsDNA, RNA and Protein A280 applications, the NanoDrop One software automatically initiates a spectral analysis for several known contaminants during the measurement. Examples of known contaminants include: • for dsDNA and RNA measurements: –...
- Page 243 • % coefficient of variation for the measurement result (uncertainty x 100/measurement result = 5.3%; a high %CV indicates the measurement result is close to the instrument detection limit or there is an interfering component) Thermo Scientific NanoDrop One User Guide...
- Page 244 Note Achieving consistent, high quality contaminant analysis results is dependent on the quality of the measured sample spectra, which is dependent on the maintenance status of the instrument. For more information, see Maintenance Schedule. NanoDrop One User Guide Thermo Scientific...
- Page 245 Learning Center Acclaro Sample Intelligence On-Demand Technical Support For the dsDNA and Protein A280 applications, the NanoDrop One software monitors all sample measurements for the presence of contaminants or other anomalies that may affect the measurement. Examples of monitored characteristics include: •...
- Page 246 Tap Learn More for the next level of information which, for this example, includes a link to a multimedia training video. Invalid-Results Alerts The NanoDrop One software uses an embedded image sensor to monitor all measurements for conditions (such as a broken liquid column) that are likely to invalidate the measurement results.
- Page 247 After an invalid-results alert, the Invalid Results icon is displayed and the measurement is stopped. See Troubleshooting for more information. Related Topics • NanoDrop One Measurement Screens • NanoDrop One Data Viewer • Maintenance Schedule • Maintaining the Pedestals • Troubleshooting...
-
Page 248: Nanodrop One Viewer Software
NanoDrop One Viewer Software NanoDrop One Viewer Software The NanoDrop One Viewer software gives you the flexibility to work with data acquired with the NanoDrop One instrument at your location and convenience. Use the Viewer software to: • view or print data acquired using the NanoDrop One instrument on any personal computer •... -
Page 249: Viewer Home Screen
Learning Center NanoDrop One Viewer Software Viewer Home Screen After you install the Viewer software, it opens with a blank screen if there are no custom methods or saved or imported data in its database. These operations are available from the Viewer Home screen. -
Page 250: Help Menu
NanoDrop One Website Opens a local web browser, if available, and navigates to the NanoDrop One website Help Displays the full NanoDrop One Help system including detailed information about the instrument, the NanoDrop One software, and the Viewer software About... -
Page 251: Manage Experiments And Associated Data
Import Experiments You can import data acquired with the NanoDrop One instrument to the NanoDrop One Viewer software installed on a personal computer, in order to view or print the data at your location and convenience. Note •... - Page 252 Note By default, exported SQL files are stored on the USB memory device in a folder named “NanodropOne” followed by the instrument serial number. – the NanoDrop One experiments stored in the SQL file are added to the Viewer Home screen. Here is an example: Imported experiments...
- Page 253 Learning Center NanoDrop One Viewer Software • User identifier. Only labels assigned to experiments in the Viewer database are available. To list only the experiments that contain the “Good” label, for example, select Good under the User Identifier filter (selected filter buttons are blue). To turn off the User Identifier filter, make sure none of the buttons are selected.
- Page 254 Learning Center NanoDrop One Viewer Software Open Experiment and View Associated Data Use the Viewer software to open experiments stored in the Viewer database in order to view, print or export the spectra and associated data. The Viewer Home screen shows a list of experiments that match the current filter settings.
- Page 255 Learning Center NanoDrop One Viewer Software These options are available from the Viewer measurement screen. Return to Viewer Spectral Experiment Print Experiment details Home screen pane name Manage Identifiers Export Spectrum Right-click to overlay spectra Click and hold a point to...
- Page 256 Learning Center NanoDrop One Viewer Software Print Data You can print selected measurements in an open experiment using standard Windows print tools. Print selected measurements – open the experiment – click to select a measurements to print (use Shift+click, or click and drag, to select sequential measurements;...
-
Page 257: Delete Data
CSV, TSV or XML file. The SQL file can be opened only using our NanoDrop One Viewer software, and only after the file has been imported. The XML file can also be opened with an XML reader application. - Page 258 Learning Center NanoDrop One Viewer Software NOTICE Deleted data cannot be recovered. Find Absorbance Values on a Spectrum You can easily view the absorbance value that corresponds with any wavelength in a displayed spectrum. Find absorbance values on a spectrum –...
- Page 259 Learning Center NanoDrop One Viewer Software Expand or Contract Displayed Spectra After you open an experiment, you can use the scroll wheel on your mouse to expand or contract a displayed spectrum or spectra along the X- and Y-axis. To reset both axes, double-click the spectral pane.
-
Page 260: Manage Identifiers On A Pc
Manage Identifiers on a PC You can add one or more “identifiers” (i.e., labels or metadata tags) to an experiment to make the experiment easier to find. Labels can be added from the NanoDrop One software running on the instrument (see... - Page 261 Learning Center NanoDrop One Viewer Software Show User Identifier filter buttons – click the adjacent arrow so the arrow points up Hide User Identifier Filter buttons – click the adjacent arrow so the arrow points down Label Experiment in Viewer You can use the Viewer software to add user-defined labels to experiments.
- Page 262 Learning Center NanoDrop One Viewer Software – choose OK (new label appears in User Identifier Filter group on Viewer Home screen) New label Assign existing label to experiment – from Viewer Home screen, right-click experiment in experiment list and choose Manage Identifiers –...
- Page 263 Learning Center NanoDrop One Viewer Software View Labels Assigned to an Experiment You can use the Viewer software to see all the user-defined labels assigned to an experiment. View assigned labels – from Viewer Home screen, right-click experiment in experiment list and choose...
- Page 264 Learning Center NanoDrop One Viewer Software – click each User Identifier filter button to select it (selected filter buttons are blue) (if the buttons are hidden, click the adjacent arrow to show them) Show/hide filters Selected filter The list of experiments is filtered and updated automatically so only experiments that match the selected filters are listed.
-
Page 265: Manage Custom Methods
Learning Center NanoDrop One Viewer Software Manage Custom Methods The Viewer software is your tool for creating and managing custom methods, which contain user-defined settings that can be used to acquire data with the instrument. Custom methods can be made with or without standards. - Page 266 Learning Center NanoDrop One Viewer Software – in the setup window, enter Method Name (this name appears in the Custom Setup box on the instrument after the method has been transferred there) Custom Method Setup for Create Formula Method selection –...
- Page 267 Learning Center NanoDrop One Viewer Software – if method has standards, enter name and concentration of each standard and select the curve fit type – enter or choose remaining custom settings as needed (see below) – choose Save Note If this icon appears next to the Save button instead of a green check mark icon, the method is invalid because it contains an error.
- Page 268 Learning Center NanoDrop One Viewer Software View or edit custom method – choose Custom Methods (menu) > Manage Custom Methods (existing methods are listed in Select Method box along with their type (formula or standards) and Description custom formula method...
- Page 269 Learning Center NanoDrop One Viewer Software Custom method settings These settings are available for creating custom methods. Setting Available Options Measurement range Select spectral range in which method will acquire data. Available options: • Ultra-violet only (190 nm - 350 nm) •...
- Page 270 Learning Center NanoDrop One Viewer Software Setting Available Options Factor or Extinction Specify whether to use factor or extinction coefficient to calculate concentration coefficient at 1 cm result: pathlength (Formula methods only) • User-defined factor. Enter factor for 1 cm pathlength and use adjacent drop down list to select appropriate unit.
- Page 271 Learning Center NanoDrop One Viewer Software Setting Available Options Notes: • Refer to product literature for information about factors and extinction coefficients for specific materials. • To set up a method that reports absorbance measurements only, select Factor or Extinction Coefficient with the factor or extinction coefficient set to “1”.
- Page 272 Learning Center NanoDrop One Viewer Software Setting Available Options • Select curve fit type. Specify type of equation used to create standard curve from standard concentration values. Available options: – Linear: Draws the linear least squares line through all measured standards (requires reference measurement and at least one standard) –...
- Page 273 Learning Center NanoDrop One Viewer Software Setting Available Options Automated pathlength Affects micro-volume measurements only. • When Automated Pathlength is selected, software selects the optimal pathlength (between 1.0 mm and 0.03 mm) based on sample absorbance at the analysis wavelength. For example, when sample absorbance at the analysis wavelength is less than or equal to 12.5 (10 mm pathlength equivalent), the optimal longer...
- Page 274 Learning Center NanoDrop One Viewer Software Setting Available Options Formula table (optional) Use the Formula table to specify additional reported results, such as a purity ratio, for each sample. Available options: • Predefined. Select from a list of predefined formulas, which can be used as is or edited, and choose Add.
- Page 275 Note If the computer is connected to the instrument with an Ethernet cable or through a wireless network, custom methods can reside on the computer and the measurement results will be stored in the NanoDrop One Viewer database on that computer. For more information, see “Set Up Ethernet Connection” or “Set Up Wi-Fi Connections” in Set Up Instrument.
- Page 276 (*.method filename extension) in proprietary format; default folder is “C:\[user name]\My Documents\Thermo\NanoDrop One”) To transfer the method to the NanoDrop One instrument, copy the method file to a USB memory device and then load the method (see To Load a Custom Method...
-
Page 277: Multimedia
Learning Center Multimedia Multimedia What is a Purity Ratio? Evaluating a Blanking Solution for Suitability What is a Blank? Effects of Bubbles in Samples Thermo Scientific NanoDrop One User Guide... - Page 278 Learning Center Multimedia Pedestal Cleaning and Reconditioning NanoDrop One User Guide Thermo Scientific...
-
Page 279: Chapter 4 Maintaining Your Instrument
Maintaining Your Instrument Maintenance Schedule Clean Touchscreen Maintain Pedestals Decontaminate Cuvette System Instrument Diagnostics Thermo Scientific NanoDrop One User Guide... -
Page 280: Maintenance Schedule
If you are experiencing an issue with your system, refer to the troubleshooting information. If the issue persists, contact us. If you are outside the U.S.A. and Canada, please contact your local distributor. If your instrument requires maintenance or repair, contact us your local distributor. NanoDrop One User Guide Thermo Scientific... -
Page 281: Cleaning The Touchscreen
Gently wipe the touchscreen with a soft, lint-free cloth such as microfiber. If necessary, use a cleaner intended for glass LCD displays and follow the manufacturer’s recommendations. Related Topics • Clean Pedestals • Recondition Pedestals • Decontaminate Instrument Thermo Scientific NanoDrop One User Guide... -
Page 282: Maintaining The Pedestals
• Do not allow HCl, alcohol, bleach, acetone or any other solvent to remain on the diaphragm for more than one minute or it may loosen the seals. If the diaphragm becomes loose, contact NanoDrop One User Guide Thermo Scientific... - Page 283 Maintaining Your Instrument Maintaining the Pedestals Note Solutions containing detergent or isopropyl alcohol may uncondition the pedestals. If these are required for sample analyses, follow immediately with 3–5 μL DI H Thermo Scientific NanoDrop One User Guide...
- Page 284 (for example, to remove dried sample left on the pedestals), substitute 0.5M HCl for the DI H2O in the procedure above and follow with 3-5 μL DI H2O. You can also recondition the pedestals using PR-1 compound. NanoDrop One User Guide Thermo Scientific...
-
Page 285: Reconditioning The Pedestals
Properly conditioned pedestal (droplet flattens out) (droplet beads up) Supplies needed • lint-free laboratory wipes • PR-1 pedestal reconditioning kit (available from us or a local distributor) • calibrated precision pipettor (0-2 μL) • canned air Thermo Scientific NanoDrop One User Guide... - Page 286 5. Use canned air to remove any paper residue from the pedestals. 6. Pipette 1 μL DI H O onto the lower pedestal. The DI H O should “bead up” or form a rounded droplet. Droplet “beads up” on properly conditioned pedestal NanoDrop One User Guide Thermo Scientific...
-
Page 287: Decontaminating The Instrument
Decontaminate the instrument after measurements with samples that contain hazardous materials and before returning the instrument to us for maintenance or repair. Note If your instrument requires maintenance or repair, contact us or your local distributor. Thermo Scientific NanoDrop One User Guide... - Page 288 If the diaphragm becomes loose, contact Supplies needed • lint-free laboratory wipes • deionized water (DI H • 0.5% sodium hypochlorite solution (1:10 dilution of commercial bleach, freshly prepared) • pipettor NanoDrop One User Guide Thermo Scientific...
- Page 289 2. Use a clean cloth or wipe dampened with DI H O to remove the bleach solution. Related Topics • Clean Pedestals • Recondition Pedestals • Clean Touchscreen Thermo Scientific NanoDrop One User Guide...
-
Page 290: Maintaining The Cuvette Sampling System
Maintaining Your Instrument Maintaining the Cuvette Sampling System Maintaining the Cuvette Sampling System The cuvette sampling system is included only with the NanoDrop One model instrument. For information about compatible cuvettes, see Measuring a Sample using a Cuvette. Note Clean and dry cuvettes after each measurement. Use cuvettes that are free of scratches and avoid fingerprints which may affect results. -
Page 291: Instrument Diagnostics
The test measures the intensity of light from the xenon source through the instrument to verify that throughput, wavelength accuracy, and bias are within specifications. If the instrument has a cuvette holder (NanoDrop One model only), the test is automatically repeated using the cuvette optical path. - Page 292 6. To rerun the intensity check, tap Measure. 7. When finished, tap End Experiment. After the test is completed, the results are available from the Data Viewer (see example below). See Manage identifiers on the instrument for details. NanoDrop One User Guide Thermo Scientific...
- Page 293 After the ampoule is opened, its contents must be used within one hour. Pipette directly from the ampoule; do not transfer the solution. Thermo Scientific NanoDrop One User Guide...
-
Page 294: Before You Begin
To run performance verification 1. From the instrument home screen, tap (Diagnostics) and then tap Performance Verification. A message asks for target absorbance values. Tap an entry box to display a numerical keyboard NanoDrop One User Guide Thermo Scientific... - Page 295 Swipe screen left to view detailed results 7. Repeat step 6 to measure the PV-1 solution nine more times using a new 1 μL aliquot for each measurement and cleaning both pedestals after each measurement. Thermo Scientific NanoDrop One User Guide...
- Page 296 After each measurement, a new sample result is added to the display. Swipe the screen left to see a summary of the 10 sample results. Swipe left again to see additional measurement details, along with the overall test result. Performance test result NanoDrop One User Guide Thermo Scientific...
- Page 297 To interpret performance verification results If your instrument failed performance verification and you repeated ten measurements using 2 uL aliquots, contact Related Topics • PV-1 Performance Verification Solution • Intensity Check • Pedestal Image Check Thermo Scientific NanoDrop One User Guide...
- Page 298 If the Pedestal Image Check displays a yellow triangle instead of the green check mark, follow the on-screen instructions to fix any possible problems. Then rerun the Pedestal Image Check. If the instrument fails again, contact Related Topics • Performance Verification • Intensity Check NanoDrop One User Guide Thermo Scientific...
-
Page 299: Chapter 5 Safety And Operating Precautions
Safety and Operating Precautions Safety Information Operating Precautions NOTICE Be sure that all persons operating this system read the safety manual first. Thermo Scientific NanoDrop One User Guide... -
Page 300: Operating Precautions
The instrument warranty is void if the cover has been removed. NanoDrop One spectrophotometers are designed to operate indoors in an environment that meets our specifications. For details, see the site preparation guide for your instrument. -
Page 301: Safety Information
Safety Information Before operating a NanoDrop One instrument, please read the safety information and follow its recommendations for the system. Safety and Special Notices In many cases, safety information is displayed on the instrument itself. The symbol indicates that there is additional safety information in the documentation and failure to heed the safety precautions could result in injury. - Page 302 Use approved containers and proper procedures to dispose of waste. Symbol Description Alternating current Earth terminal or ground Direct current Protective conductor terminal Frame or chassis terminal Fuse Power on Power off NanoDrop One User Guide Thermo Scientific...
- Page 303 • Damage due to removing the sealed plastic bag before the instrument has come to room temperature. • Note It is important to have all system utilities installed before the instrument arrives. Utility installations must comply with all local building and safety codes. Thermo Scientific NanoDrop One User Guide...
- Page 304 • Do not attempt to remove the cover of the instrument. Grounding CAUTION Avoid shock hazard. Each wall outlet used must be equipped with a ground. The ground must be a noncurrent-carrying wire connected to earth ground at the main distribution box. NanoDrop One User Guide Thermo Scientific...
- Page 305 Generally, 50% more power should be available than the entire system (including accessories) typically uses. Maximum power consumption and heat dissipation specifications for the spectrometer and accessories are shown below. The values are approximate. Item Power Consumption Max. Heat Dissipation instrument 60 W 205 Btu/hr Thermo Scientific NanoDrop One User Guide...
- Page 306 Volatile Solvents and Flammable Samples CAUTION Avoid personal injury. Do not leave solvents or flammable samples near the instrument. Be sure that the workspace is properly ventilated. Compatible Solvents NanoDrop One User Guide Thermo Scientific...
- Page 307 Wear appropriate protective equipment. Individuals should be trained according to applicable regulatory and organization requirements before working with potentially infectious materials. Follow your organization’s Biosafety Program protocols for working with and/or handling potentially infectious materials. Thermo Scientific NanoDrop One User Guide...
- Page 308 Contact us if you have questions about decontamination requirements. NanoDrop One User Guide Thermo Scientific...
-
Page 309: Chapter 6 About This Help System
Bluetooth is either a trademark or a registered trademark of Bluetooth Special Interest Group. Windows is either a trademark or a registered trademark of Microsoft Corporation in the United States and/or other countries. All other trademarks are the property of Thermo Fisher Scientific inc. and its subsidiaries. Thermo Scientific NanoDrop One User Guide... - Page 310 About this Help System © 2015-2016 Thermo Fisher Scientific Inc. All rights reserved. NanoDrop One User Guide Thermo Scientific...
-
Page 311: Chapter 7 Contact Technical Support
If the issue persists, contact us. If you are outside the U.S.A. and Canada, please contact your local distributor. If your instrument requires maintenance or repair, contact us or your local distributor. Thermo Scientific NanoDrop One User Guide... - Page 312 Contact Technical Support NanoDrop One User Guide Thermo Scientific...
Need help?
Do you have a question about the NanoDrop One and is the answer not in the manual?
Questions and answers