
Related Manuals for VWR International UV-6300PC


Summary of Contents for VWR International UV-6300PC
- Page 1 UV-6300PC Spectrophotometer Instruction Manual European Catalogue Number: 634-6041 Version: 1.0.2 Issued: 04 April 2014...
- Page 2 Legal Address of Manufacturer Europe VWR International Europe bvba Researchpark Haasrode 2020 Geldenaaksebaan 464 B 3001 Leuven Tel.: +32 16 385 011 http://www.be.vwr.com Made in China...
-
Page 3: Table Of Contents
Table of Contents Part 1: Spectrophotometer Safety Information ....................3 Package Contents ....................4 Unpacking ......................4 Installation ......................4 Symbols and Conventions .................. 5 Specifications ...................... 5 Overview ......................6 Description of Buttons and Switches ..............6 Operational Keys....................7 Getting Started .................... - Page 4 Accessories and Spare Parts ................35 Part 2: Software Functions......................37 Main Functions ....................37 Spectrum processing function ............... 38 System check and calibration function ............38 Installation ......................39 Introduction ....................... 42 Operation ......................46 Single wavelength photometric measurement ..........46 Fixed point measurement ................
-
Page 5: Part 1: Spectrophotometer
Part 1: Spectrophotometer Safety Information Please follow the guidelines below, and read this manual in its entirety to ensure safe operation of the unit. VWR issues the following recommendations with regard to the use of the UV-6300PC Spectrophotometer. ... -
Page 6: Package Contents
Package Contents Description Quantity Spectrophotometer Glass Cuvette 4PCS Quartz Cuvette 2PCS USB Disk Power Cord (Euro Plug) Power Cord (UK Plug) Power Cord (CH Plug) USB Cable CD-ROM Quick Manual Instruction Manual Dust Cover Unpacking Open the package and carefully check the enclosed items against the packing list. If any of the items are missing or damaged please contact your local VWR office and authorized contractual partners. -
Page 7: Symbols And Conventions
Symbols and Conventions The following chart is an illustrated glossary of the symbols that are used in this manual. CAUTION This symbol indicates a potential risk and alerts you to proceed with caution CAUTION This symbol indicates the presence of high voltage and alerts you to proceed with caution CAUTION This symbol indicates risks associated with hot surfaces Specifications... -
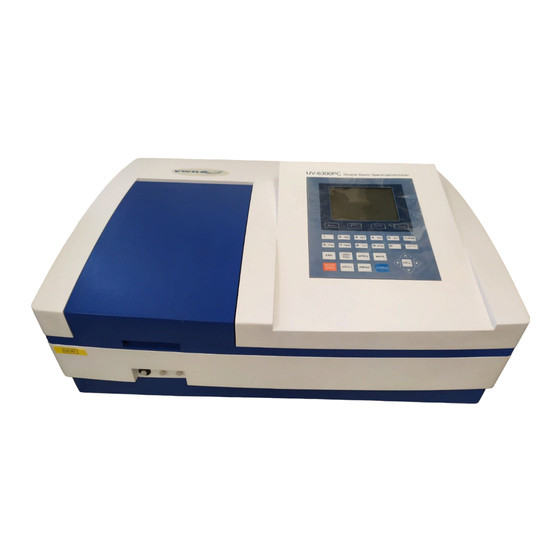
Page 8: Overview
Overview UV-6300PC Spectrophotometer used in chemistry, pharmaceuticals, biochemical, metallurgy, light industry, textile, material, environments, medical, education and some other fields for quality control laboratories. Description of Buttons and Switches Front View Rear View... -
Page 9: Operational Keys
Operational Keys Functions Function keys: Functions on-screen prompts... - Page 10 … Numeric keys: Enter numbers and letters CLEAR key: Delete the input value or stored data ESC key: Return to previous interface 100%T/0Abs key: Blank OPEN key: Open files stored in internal memory SAVE key: Save files to internal memory START/STOP key: Start/Stop testing GOTO ʎ...
-
Page 11: Getting Started
Getting Started The following chart describes the basic operation of the instrument. Turn on and self-check Switch on the power. The instrument begins to self-check and perform 15 minutes’ warm-up. Self-check includes the following steps: Turn on lamps → RAM Check → Start RTOS kernel→ Initialize Comm. Port → Initialize Printer → Initialize AD →... -
Page 12: Important Guidelines
Important Guidelines Reagents and dilution buffers can cause cauterization and other damage to health. Samples (nucleic acids, proteins, bacteria cultures) can be infectious and cause serious damage to health. During sample preparation, measuring procedures and maintenance and cleaning work, observe all local laboratory safety precautions (e.g. -
Page 13: Operation
Press to delete the test result or stored data. If the USB disk was installed, the data will be deleted from the USB disk, otherwise the data will be deleted in the internal memory. Blank Put the reference in the main light path and reference light path, press to carry out the blank. -
Page 14: Basic Mode
The cuvettes must be clear with no remains of previous samples on the surface. Only silicon (quartz) cuvettes are permitted to be used in the range of UV area. Basic Mode 1. Enter into Basic Mode Main menu, press numeric key to select Basic Mode, then press to enter. -
Page 15: Quantitative Mode
5. Set wavelength Press to set the wavelength, input the value by the numeric keypad, then press to confirm. 6. Measurement samples Put the sample to be measured in the main light path and put reference in the reference light path; the result is then displayed on the screen automatically. - Page 16 Press to enter the setup interface. Two methods are then available. Set up standard curve: Method 1: Input regression equation Set Fit Curve method. Press to set Fit Curve method, use to choose the method and press to confirm. Set wavelength. Press to set wavelength.
- Page 17 can use to select the value that they have just input and press to delete, then input a new value and press to confirm. Press to cancel after all the values have been input. Calibrate standard samples. Put the corresponding standard samples in the main light path and the reference in the reference light path as the screen indicates and press measure.
- Page 18 In the Calibration Table interface, press to return to the Quantitative Test interface. 5. Measure samples Place the sample to be tested in the main light path and reference in the reference light path, then press to measure. The test result will then be displayed in the data sheet. Repeat this step until all the samples have been measured.
-
Page 19: Wavelength Scan
Wavelength Scan 1. Enter the wavelength scan interface Main menu, press numeric key to select Wavelength Scan and press to enter. 2. Parameters setup Press to set parameters, set scan from, scan to, scan step and scan speed, then press confirm. - Page 20 to scan the sample, or press to cancel. 5. Search peaks After scanning, press to go into peak search mode. Press to set peak height, input the peak height and press to confirm. Press to display the value of every wavelength point. Press to display the value of every peak.
-
Page 21: Kinetics
Kinetics 1. Enter Kinetics Mode Main menu, press to select Kinetics Mode and press to confirm. 2. Setup parameters... - Page 22 Press to set parameters, input the corresponding values of Total Time, Delay Time and Time Intervals according the on-screen indications. Press to confirm. 3. Set photometric mode Press to set photometric mode, choose T% or Abs. and press to confirm. 4.
- Page 23 7. Search peaks After scanning has finished, press to go into search mode. Press to search the value of every point. 8. Print the test results Press to print the test results.
-
Page 24: Dna/Protein Mode
DNA/Protein Mode 1. Enter DNA/Protein Mode Main menu, press to select DNA/Protein Mode and press to confirm. 2. Setup parameters Press to set coefficients, input all the values of f1 to f4 using the numeric keypad according the on-screen indications and press to confirm. -
Page 25: Multi-Wavelength Mode
6. Print the test results Press to print the test results. Multi-Wavelength Mode 1. Enter Multi-Wavelength Mode Main menu, press to select Multi-Wavelength Mode and then press to enter the multi-wavelength measurement interface. - Page 26 2. Set up wavelength Press to enter the wavelength setting interface, then input all the wavelength values one by one using the numeric keypad. Press to confirm, or press to return. 3. Set photometric mode Press to set the photometric mode, use to select Abs.
-
Page 27: System Utility
Sample---1 500.0nm 0.251Abs 510.0nm 0.243Abs Unit: Model: UV-6300PC UQEXXXXXXX Version: A1.176 VWR International bvba. System Utility Main menu, press or use to select System Utility and press to confirm. Wavelength Reset Press or use to select Wavelength Reset then press to begin the calibration. - Page 28 Reset Printer Press or use to select Reset Printer and press to confirm. Then the printer will be reset to its initial condition. Select Print Port Press or use to choose Select Print Port and press to confirm. Use to choose LPT or Comm.
- Page 29 Press or use to select Reset D2 Lamp Usage Time” and press . The D2 lamp’s usage time will be displayed and the system will ask for confirmation that you want to reset the usage time. Press to select Yes, then press to confirm.
- Page 30 Press to select Set Time and press to confirm. Input the time (hour, minute, second) using the numeric keypad, then press to confirm and return automatically. Set date Press or use to select Set Date and press to confirm. Input the date (year, month, day) using the numeric keypad, then press to confirm and return automatically.
-
Page 31: Troubleshooting
Beeper on/off Press or use to select Beeper On/Off and press to switch on or switch off the beeper. Language selection Press or use to choose Language Selection and press to enter the language selection interface, press to choose language (English, French, German, Spanish) and press to confirm. -
Page 32: Repair And Maintenance
Glass cuvettes used in UV Use quartz cuvettes range Sample is not stable Improve the sample The concentration of sample is Dilute the sample too high Power supply voltage low or Improve the power supply not stable Lamp damage or lamp life Replace lamp maturity Dark current error... -
Page 33: Check Lamp
Clean the cuvettes After every test or after a solution change, the cuvettes should be cleaned carefully, otherwise any remains on the surface will cause measuring errors. Check lamp In Wavelength Scan mode, set the test parameters as follow: Scan From: 500 nm Scan To: 200 nm Scan Step:... - Page 34 5. Reset the fuse seat Replace the fuse seat in the power socket. 6. Switch on the power Plug the cord into the socket and switch on the power. Replace lamps Hot! Wait 20 minutes before opening the lamp chamber after power off to avoid scalding! 1.
- Page 35 5. Replace the D2 lamp Unscrew the 2 screws on the D2 Flange (No.1), unplug the connector in the power board (No.2) and remove the D2 lamp. Wearing a cotton glove, remove and replace the lamp bulb. Fix the 2 screws and plug in the connector again.
- Page 36 Switch on the power (the switch mirror should be placed to the position as indicated). Observe the entrance facular: it should be in the centre of the entrance hole. If the facular deviates to the left or right, loosen the No.1 screws in Fig. 5-8 and move the lamp seat to the left or right until it is flush with the centre of the slot.
-
Page 37: Accessories And Spare Parts
4. Replace the battery Remove the old battery and replace it with a new one. 5. Finish Reattach the bottom plate and fix all the screws. Accessories and Spare Parts Description Quantity Cat. No. CELL HOLDER, 4-CELL, 10 MM 634-6057 CELL HOLDER, 4-CELL, 10 TO 50 MM 634-6045 CELL HOLDER, 4-CELL, 10 TO 100 MM... - Page 38 CELL HOLDER, 8-POSITION AUTO CELL CHANGER 634-6064 CUVETTE, SQUARE. GLASS, 10 MM 4PCS 634-6013 CUVETTE, SQUARE. GLASS, 20 MM 2PCS 634-6014 CUVETTE, SQUARE. GLASS, 30 MM 2PCS 634-6015 CUVETTE, SQUARE. GLASS, 50 MM 2PCS 634-6016 CUVETTE, SQUARE. GLASS, 100 MM 634-6017 CUVETTE, SQUARE.
-
Page 39: Part 2: Software
Part 2: Software Functions This section introduces the functions of the UV-Vis Analyst. Main Functions Single wavelength photometric measurement Go to a desired wavelength quickly and conveniently. Photometric value display mode can be changed (%Transmittance or Absorbance). Fixed points measurement Multi-wavelength photometric measurement ... -
Page 40: Spectrum Processing Function
Spectrum processing function Trace a spectrum The cursor can be moved to a desired point in the spectrum displayed on the screen and the photometric data at this point is displayed. Automatic peak detection After scanning is complete, peaks and valleys can be automatically detected and listed in a table format. They will also be labelled on the spectrum. -
Page 41: Installation
Installation This section describes how to set up the UV-Vis Analyst to PC. PC system requirements Pentium or above PC; CD-ROM; USB Ports. 512 MB memory (1 GB or above is strongly recommended); 50 MB or above hard disk space; ... - Page 42 < Back Next > Cancel Select “I accept this agreement”. Click Next to copy files to PC; < Back Next > Cancel Click Finish to finish installation of the USB drive; < Back Finish Cancel Click Finish to complete the setup.
- Page 43 Uninstall UV-Vis Analyst Start → All Programs → UV-Vis Analyst → Uninstall UV-Vis Analyst to remove. Run UV-Vis Analyst Before you run UV-Vis Analyst, please check the following: Computer is connected to spectrophotometer using the USB cable; Spectrophotometer is on main interface. There are two ways to start the UV-Vis Analyst: ...
-
Page 44: Introduction
Introduction We will introduce the UV-Vis Analyst in this chapter. Main Interface This is the main interface after starting. Menu bar and toolbar Menu bar and toolbar are both provided in the software offering you two ways to select a desired function. ... - Page 45 New instrument validity Open… Open a spectrum/data file Close Close current measurement Save Save current measurement Save current measurement with a Save As… new file name Open file from Open a file saved in instrument UV-Photometer Export Export data or method Print…...
- Page 46 Link Connect to the instrument Spectrophotometer Reset Reset parameters of instrument Spectrophotometer Escape Stop current measurement View Dark Current Retest the dark current Set Amplifier Reset amplifier Locate 656.1 nm Relocate 656.1 nm Calibrate System Scan system baseline Baseline Automatic Blank UV-Photometer Carry out the blank Calibration...
- Page 47 Stop Stop a measurement Measure spectrum and scan Service energy Display Range Set up scan display parameters Settings Peak Height Define peak/valley threshold Add two spectra Subtract one spectrum from another Multiply Multiply two spectra Divide Divide one spectrum from another Compute Moving Window Smooth a spectrum with the moving...
-
Page 48: Operation
Modify a measurement result Delete results selected Set and go to one wavelength Display instrument CPU information Delete current spectrum Display result as mode %T Display result as mode Abs Undo scale Note: * Only for the model with Variable Slit ** Only for the model with 8-Cell Auto Charger Operation This chapter describes how to use UV-Vis Analyst. -
Page 49: Fixed Point Measurement
3. Place a sample in the sample compartment and a reference in the reference compartment. The wavelength position and photometric value will be displayed in the Readout box. Fixed point measurement This UV-Vis Analyst performs fixed wavelength measurement at 1–20 points and defines how to analyse unknown compounds against calibration standards. - Page 50 7. Place a sample in the sample compartment. Click Start or to run a new measurement. The display will change to the following. Enter the sample name in the Name box. 8. Click OK. The photometric data for sample will be listed in the Sample table. 9.
- Page 51 Concentration measurement Set up linear regression curve There are two methods available to set up the linear regression curve. You can use standards to set up the regression curve or just enter the parameters manually. Use the following steps to select the method you wish to use.
- Page 52 (8) Repeat steps 4–7 to measure all the prepared standards. (9) Click down arrow in Curve Fit box to select curve fit method. Method 2: Input the factor of the linear regression curve. (1) Leave the Use Standard Samples tick box unticked. (2) Click down arrow in Curve Fit box to select curve fit method.
- Page 53 Measure concentration by using the linear regression curve The following procedure describes how to measure concentration of samples. 1. Set up linear regression curve or click to open a file of linear regression curve (*.QUA). 2. Place reference into the reference holder. 3.
-
Page 54: Wavelength Scanning
Wavelength Scanning This chapter describes how to collect a spectrum while using Wavelength Scan function. Scan sample Click on the toolbar to new a sample scan measurement to display the following form. Click on the toolbar to display the following form. Input start wavelength in From box (range: 190–1100 nm), end wavelength in To box (range: 190–1100 nm), select scan interval (0.1, 0.2, 0.5, 1.0, 2.0 or 5.0 nm) and filter times (5, 10, 30 or 50), click OK. - Page 55 Click on the toolbar to select %Transmittance mode or click to select Absorbance mode. Click on the toolbar to set display parameters. Place reference into the reference holder. Place sample into the sample holder. Click to scan sample, the real time spectrum will be displayed.
- Page 56 Auto list peaks and valleys Click on the toolbar to set the peak/Valley threshold (range: 0 to 1.000, step: 0.001), input the threshold value, click OK. Click to list peaks and click to list valleys. Rescale Click on the toolbar to set the new parameters for display. Original scales Click on the toolbar to restore the default display settings.
- Page 57 Trace a spectrum Click on the toolbar, a crosshair cursor appears, move the cursor on the spectrum. Move the crosshair cursor left or right on the spectrum. The data in the cursor window indicate the X-axis and Y-axis values for the current cursor location.
- Page 58 Select a spectrum as current As UV-Vis Application software can display several spectra overlaid on the screen, you should specify the spectrum you wish to process. Click the down arrow on the toolbar. All spectra will be listed in the drop-down menu.
- Page 59 4.3.2.1 Moving window averaging Click on the toolbar. The following dialogue box will be displayed. Click up/down arrow of the Range box to select range value, enter a file name in the Name box, click OK. The result spectrum will be displayed overlaid with the original one.
- Page 60 Savitzky-Golay Smoothing Filter On the Computer menu, click Savitzky-Golay Smoothing Filter. The following dialogue box will be displayed. Click up/down arrow to select the parameters, enter a file name in the Name of Result box, click OK. The result spectrum will be displayed overlaid with the original one. Resample Click on the toolbar.
- Page 61 Spectrum addition Spectrum addition can assist in the development of artificial spectrum in multi-component mixtures. Click on the toolbar. The following dialogue box will be displayed. Click the down arrow next to File 1 to select a spectrum and define it as source 1. Select a spectrum for File 2 in the same way. It will not allow you to select the same spectrum twice.
- Page 62 Spectrum subtraction Subtracting one spectrum from another is a classic technique to offset spectrum interference from the spectrum of interest. Click on the toolbar. The following dialogue box will be displayed. Click the down arrow next to File 1 to select a spectrum and define it as source 1. Select a spectrum for File 2 in the same way. It will not allow you to select the same spectrum twice.
- Page 63 Spectrum multiplication Multiplying spectra can assist in the development of artificial structure of a spectrum in multi-component mixtures. Click on the toolbar. The following dialogue box will be displayed. Click the down arrow next to File 1 to select a spectrum and define it as source 1. Select a spectrum for File 2 in the same way. It will not allow you to select the same spectrum twice.
- Page 64 Spectrum division Dividing one spectrum from another is a classic technique to offset spectrum interference from the spectrum of interest. Click on the toolbar. The following dialogue box will be displayed. Click the down arrow next to File 1 to select a spectrum and define it as source 1. Select a spectrum for File 2 in the same way. It will not allow you to select the same spectrum twice.
- Page 65 Unload a spectrum Select the spectrum you want to unload as the Current Spectrum, Click on the toolbar to remove the spectrum from the display. Define display information Click on the toolbar to display the Settings to display and print the spectra form, click the Legend tab, enter the information for display.
-
Page 66: Time Scanning (Kinetic Analysis)
Time Scanning (Kinetic Analysis) This chapter describes how to obtain the absorbance or transmittance value for a sample as a function of time at a given wavelength. Scan sample 1. Click on the toolbar, the following dialogue box will appear. 2. - Page 67 4. Place a reference in the reference holder. 5. Take out the blank in the sample holder, place a sample in it and close the cover. 6. Place a sample in the sample holder. Click on the toolbar. The instrument will start scanning automatically.
-
Page 68: Dna/Protein Measurement
Define display information Click on the toolbar to display the Settings to display and print the spectra form, click the Legend tab, enter the information for display. Edit print information Click on the toolbar to display the Settings to display and print the spectra form, click the Legend tab, enter the information for display. - Page 69 Click the down arrows of the method to select the test method. Enter the wavelength position in the Wavelength box. Enter the value of DNA/Protein Conc. Place a reference in the reference holder. Click the Sample tab. It will display the following. The control menu contains six buttons: Start, Delete, Modify, Recalculate, Font and Print.
- Page 70 The UV-Vis Analyst will read the photometric value of sample 1 at the fixed wavelength automatically. Enter the sample name in the Name box. Click OK after the measurement is complete. The photometric data for sample 1 will be listed in the sample table. Repeat steps 5 and 6 to test all samples.
-
Page 71: Appendix 1
Appendix 1 Methods of Quantitative Analysis Single Wavelength Method: Abs.=A1 Double Wavelengths Method: Abs.=m*A1-n*A2 Three Wavelengths Method: Abs.=A1-(W1-W2)*(A2-A3)/(W2-W3)-A3... -
Page 72: Technical Service
Warranty VWR International warrants that this product will be free from defects in material and workmanship for a period of two (2) years from date of delivery. If a defect is present, VWR will, at its option and cost, repair, replace, or refund the purchase price of this product to the customer, provided it is returned during the warranty period. -
Page 73: Equipment Disposal
Equipment disposal This equipment is marked with the crossed out wheeled bin symbol to indicate that this equipment must not be disposed of with unsorted waste. Instead it's your responsibility to correctly dispose of your equipment at lifecycle -end by handling it over to an authorized facility for separate collection and recycling. - Page 74 Your Distributor Australia Germany Poland VWR International Pty.LTD VWR International GmbH VWR International Sp. z o.o. Unit 1/31 Archimedes Place Hilpertstraße 20a Limbowa 5 Murarrie D - 64295 Darmstadt 80-175 Gdansk QLD 4172 Australia Freecall: 0800 702 00 07 Tel.: 058 32 38 210 Tel.: 1300 727 696...
Need help?
Do you have a question about the UV-6300PC and is the answer not in the manual?
Questions and answers