Table of Contents
Advertisement
Quick Links
Alternatively, you can press the red stop sign symbol on the tool bar and this will also
stop the software from recording.
To save the data for future reference, go to File(F), Export Data and this will
automatically take you to the Save As window to save the data as a Microsoft Excel
spreadsheet. Before saving the data, change the file name from *.xls to an appropriate
name, as it will not allow you to save the data as *.xls.
To save the data as a text file rather than an Excel file, go to File(F), Save and change
the file from *.txt and press Save. Or alternatively, you can press the floppy disc
symbol on the toolbar.
9. Datalogger Window
To use the DATALOGGER window you must have saved data stored to your computer
from the software, otherwise you will not be able to use this facility. This function allows
you to view any saved data as a graph rather than a txt or xls file.
To open the DATALOGGER window, go to DataLogger(D) at the top of the DT-1309
software and the DATALOGGER window should appear upon the desktop. You will
notice that the window will appear to be blank because the data you wish to view
needs to be imported from the computer into the software.
To import data go to Import Data(I) at the top of the DATALOGGER window and the
software will automatically detect data saved in the computer and list them.
However, this will only work with data saved as a text file and not an excel file.
Click on the data you wish to open and this will automatically import the data to the
DATALOGGER window. You will notice that there is no information on the graph. This
is because you have not selected the data, on the left hand side of the window, that
you wish to view.
On the left hand side of the DATALOGGER window you will see three of five columns
(the other two can be seen by using the scrolling) that have the headings: Set, DATE,
TIME UNIT and NUMS. Highlight the row of information you wish to view in blue by
clicking on the row once. With the row still highlighted, double click on the row and the
data you have selected should appear upon the graph.
10. Using/Interpreting the Graph
With the data imported into the DATALOGGER window, select the data you wish to
view and a red line graph will appear with information about the recorded data
York Survey Supply Centre, Prospect House, George Cayley Drive, Clifton Moor, York, England YO30 4XE
Tel: +44 (0) 1904 692723
E-Mail: sales@yorksurvey.co.uk
Ref:.. \operat98\instructions 18\343680.qxp 05-01-18
displayed above the graph in the boxes labelled: Real-Time, DataNo, Start Time,
Unit, AVG, Maximum and Minimum.
Real-Time From: 2008-04-18 10:18:01 To: 2008-04-18 10:18:27 is the date and time
of when the meter started and finished recording.
DataNo. 228 is the total amount of recordings taken within the recording period.
Start Time 10:18:01 is the time that the meter began recording data.
Unit Lux is the unit that the meter was measuring in whilst recording.
Avg 234.0 is the average taken from all the readings recorded.
Maximum 347.4 @ 10:18:06 is the maximum lux reading recorded and the time it was
recorded.
Minimum 47.9 @ 10:18:24 is the minimum lux reading recorded and the time it was
recorded.
At the bottom of the DATALOGGER window you will see empty boxes labelled:
CursorA, CursorB, Max.Between A and B, Min.Between A and B and Avg.Between
A and B. Unfortunately, no data can be displayed in these boxes on the
DATALOGGER window because it is a facility that can only be used on the main
LX-1309 software window when the data has just been recorded.
To display information in these boxes on the main window, double click on any part of
the graph once to display a green line and double click again on a different part of the
graph (must be to the right of the green line) to display a blue line. The green line is
CursorA and the blue line is CursorB. By using these cursors it allows you to focus on
a sample of all the data recorded and find out information about the sample in the
boxes below the graph.
CursorA 164.5 @ 10:18:07 displays the time and lux of the recorded data where
CursorA is positioned.
CursorB 282.2 @ 10:18:16 displays the time and lux of the recorded data where
CursorB is positioned.
Max.Between A and B 341.1 @ 10:18:10 is the maximum lux reading detected by the
meter between the two cursors and the time of which this reading was recorded.
Min.Between A and B 93.9 @ 10:18:08 is the minimum lux reading detected by the
meter between the two cursors and the time of which this reading was recorded.
Avg.Between A and B 256.8 is the average reading from all the data between the two
cursors.
To remove the cursors, click once onto the graph or double click
somewhere else on the graph where you would like CursorA to be moved.
When using the graph in the DATALOGGER window you can zoom in on certain areas
by pressing the Undo Zoom button at the top right hand side of the window and using
the mouse, click on the graph and drag the mouse to create a square in the place
you wish to zoom in on. To undo zoom press the Undo Zoom box again.
To save any changes made in the DATALOGGER window go to Save Data(S) at the
top of the window.
Fax: +44 (0) 1904 690385
www.yorksurvey.co.uk
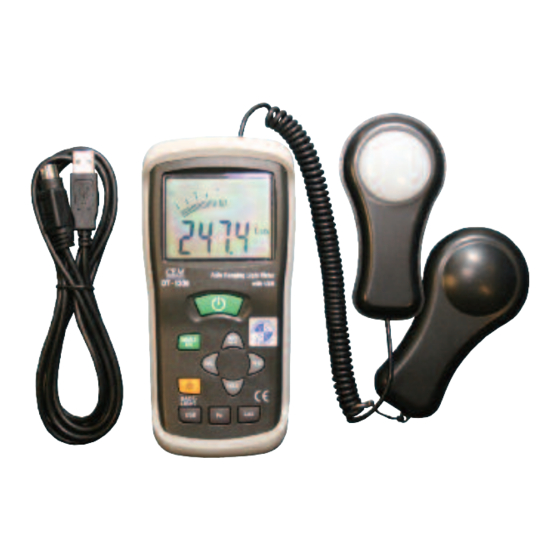
Lux Meter
Code: 343680
Operating
Instructions
©York Survey Supply Centre 2018
Advertisement
Table of Contents

Subscribe to Our Youtube Channel
Related Manuals for York Survey Supply 343680


Summary of Contents for York Survey Supply 343680
- Page 1 York Survey Supply Centre, Prospect House, George Cayley Drive, Clifton Moor, York, England YO30 4XE Tel: +44 (0) 1904 692723 Fax: +44 (0) 1904 690385 E-Mail: sales@yorksurvey.co.uk...
- Page 2 To stop the software from recording, go to Real Time(R) and select Stop(S). This will (1) LCD Screen CP2102 USB to UART Bridge Controller. Click FINISH and both hardware drivers stop the software from recording data and stop the graph from moving. (2) Auto-Ranging Ref:.. \operat98\instructions 18\343680.qxp 05-01-18 ©York Survey Supply Centre 2018...
Need help?
Do you have a question about the 343680 and is the answer not in the manual?
Questions and answers